0446
Correction of physiological field fluctuations in high- and low-resolution 3D-EPI acquisitions at 7 Tesla1German Center for Neurodegenerative Diseases (DZNE), Bonn, Germany, 2Department of Physics and Astronomy, University of Bonn, Bonn, Germany
Synopsis
Segmented gradient-echo 3D-EPI images suffer from physiologically induced field fluctuations due to long echo times and k-space data acquisition across multiple shots. In this work, the effect of 0th-order B0 correction on high-resolution and low-resolution 3D-EPI acquisitions is investigated by means of a 16-channel NMR field probe system. A clear improvement in image quality and
Introduction
3D-EPI1 is increasingly utilized for fMRI and other applications such as QSM and T2* mapping1-5. At long echo times (TE), gradient-echo EPI sequences suffer from physiologically induced field perturbations, particularly at ultra-high fields. Furthermore, subject motion changes the field distribution and affects signal encoding.
Extracting phase variation from the EPI phase correction scans6 is one common method to determine B0 fluctuations. Alternatively, NMR field probes7 enable monitoring of field dynamics up to 3rd-order spherical harmonics. Using this method, Vannesjo et al.8 investigated higher-order correction of motion-induced field perturbation for T2*-weighted 2D-GRE acquisitions at 7T. For a 2D-EPI sequence at 3T, the influence of physiological field fluctuations was found to be small relative to hardware-related field changes9.
It has been shown that the influence of physiological field fluctuations on image quality is higher for multi-shot sequences such as segmented 3D-EPI2. The temporal signal-to-noise (tSNR) decreases with increasing segmentation. The effect of physiology scales with signal amplitude and is, therefore, more prominent at 7T.
In this project, we use a field probe system to monitor physiological field fluctuations during 2D-segmented 3D-EPI acquisitions³. A 0th-order B0 field correction is investigated for different resolutions and subject motions and tSNR gain is examined.
Methods
Whole-brain measurements were performed on a 7T scanner (Siemens) utilizing a 32-channel head coil (Nova Medical).
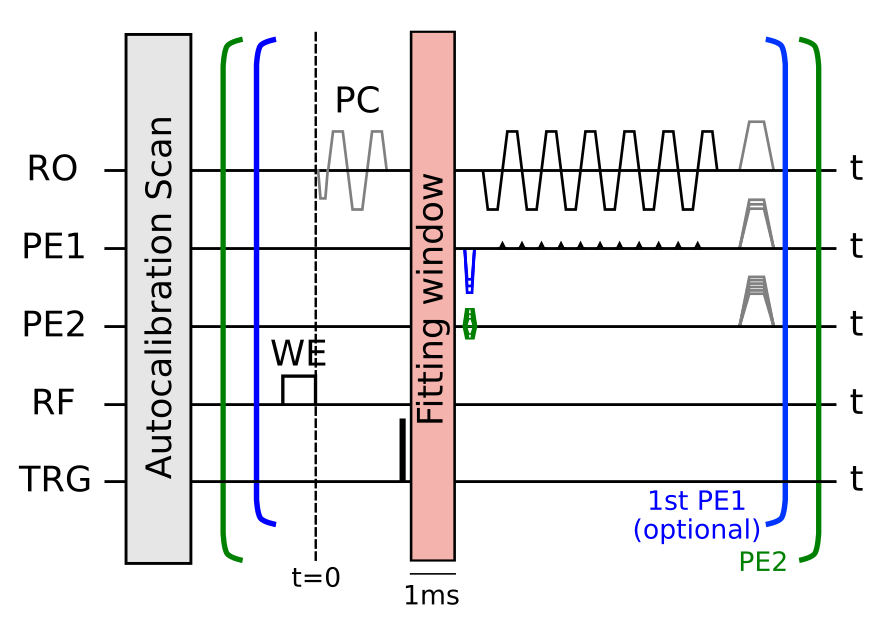
Data were acquired with a typical 3D-EPI fMRI protocol (2mm isotropic, FOV=192x192x160mm³ (sagittal), TE/TRshot =21ms/35ms, TRvol =14s, FA=12°, repetitions=50, R=3x2 and FLASH autocalibration scans) and with a typical high-resolution protocol (e.g. QSM)(1mm isotropic, FOV=192x192x160mm³, TE/TRshot =16ms/27ms, TRvol =22s, 1.09ms echo spacing, FA=10°, repetitions=20, R=3x1), where additionally 5-fold segmentation along the first phase encode direction was applied (PE1, Fig. 1).
For both protocols, physiological field fluctuations were induced by instructing the subject to breathe deeply or repeat hand movement from waist to chin. Field changes during the measurements were monitored using a Clip-On Camera (Skope) which consists of 16 NMR field probes placed around the head coil. Field variations were fitted by the vendor software, based on field measurements during a gradient-free window of 1ms (Fig. 1). As physiological fluctuations are slow, they were assumed constant during a single EPI readout (TRshot , or 2TRshot for the 1mm-protocol).
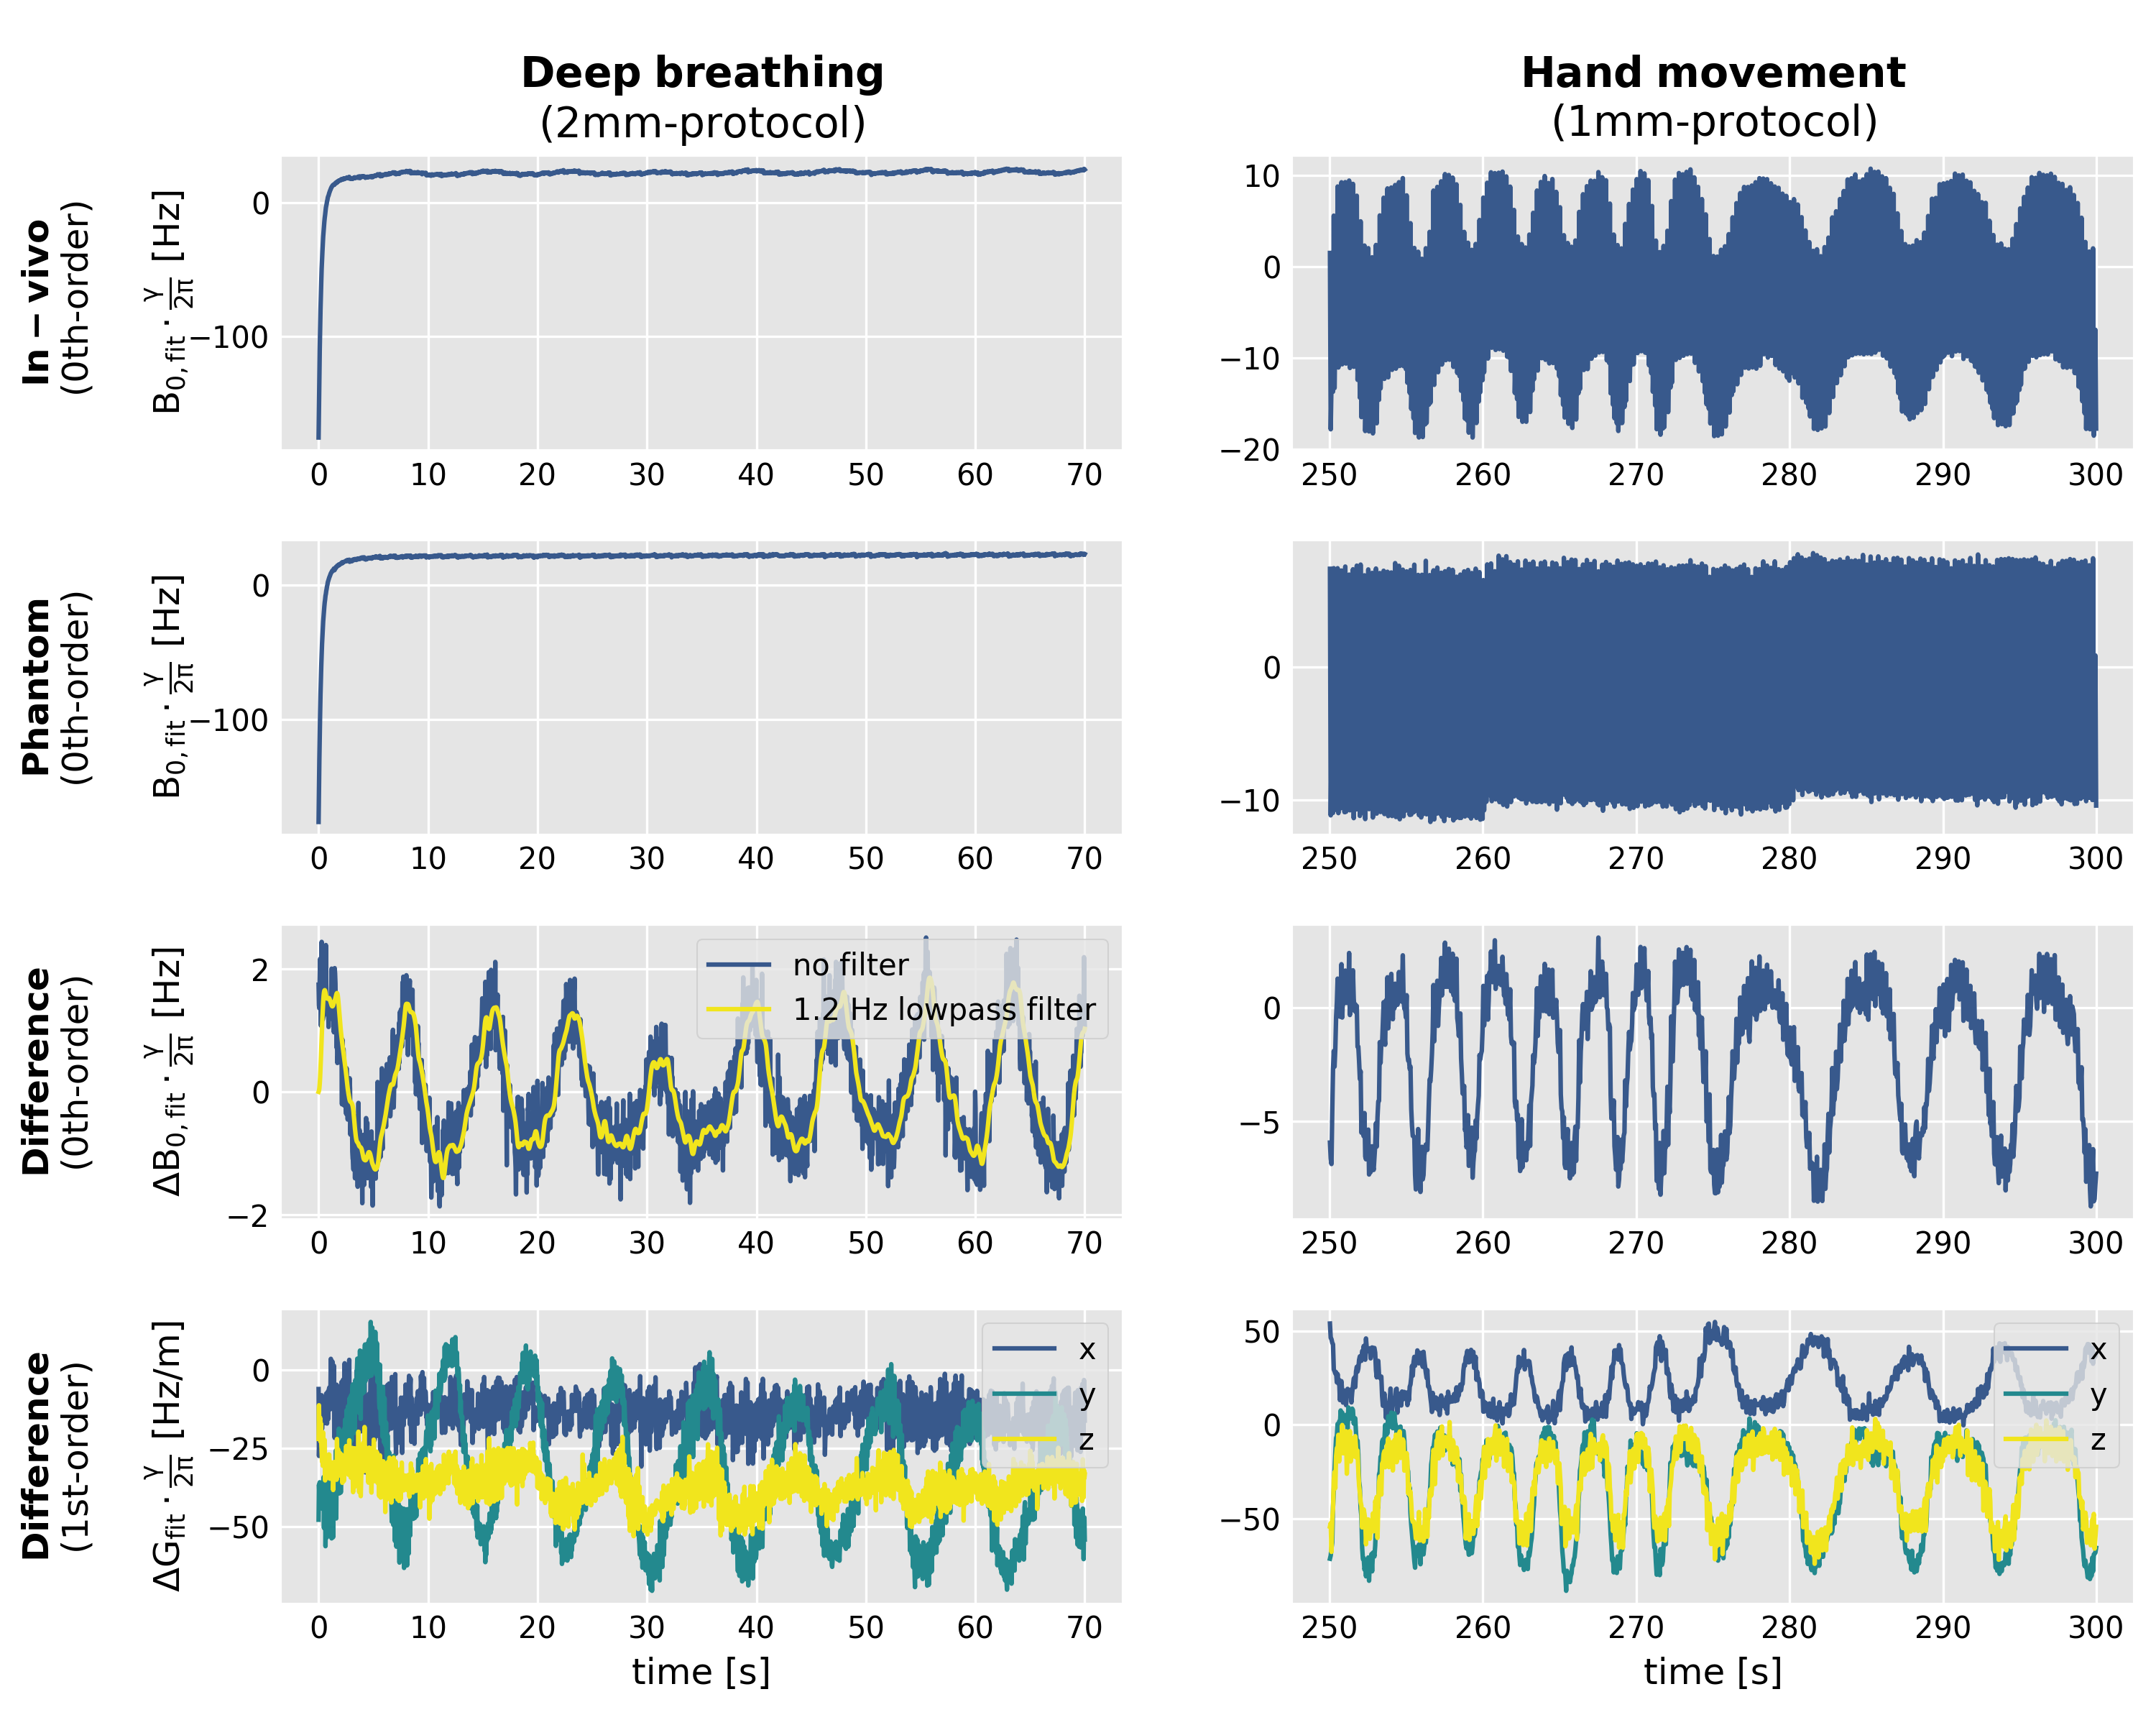
The MRI scanner applies eddy current compensation during transmission and reception. To separate physiological frequency modulations from scanner-induced receive frequency modulations, the fitted fields of a reference phantom measurement were subtracted from the in-vivo measurement (Fig. 2). To separate physiological noise from hardware imperfections, the fitted field values of the 2mm-protocol were filtered by a Butterworth lowpass filter (2Hz for hand-to-chin, 1.2Hz for deep breathing). For 1mm-measurements, filtering was not necessary.
Using the 0th-order fields ΔB0,fit, all receive coil signals were demodulated by the phase Δφ0(t)=γ· ΔB0,fit. Image reconstruction was performed using an in-house developed python toolbox. TSNR maps were computed and evaluated over the whole brain for uncorrected and B0-corrected images.
Results
During deep breathing, the 0th-order field fluctuates by approximately 4Hz for the 2mm-protocol (Fig. 2, right). Larger field variations of up to 10Hz were induced by the hand-to-chin movement (Fig. 2, right). 1st-order field fluctuations are displayed but currently not corrected for.
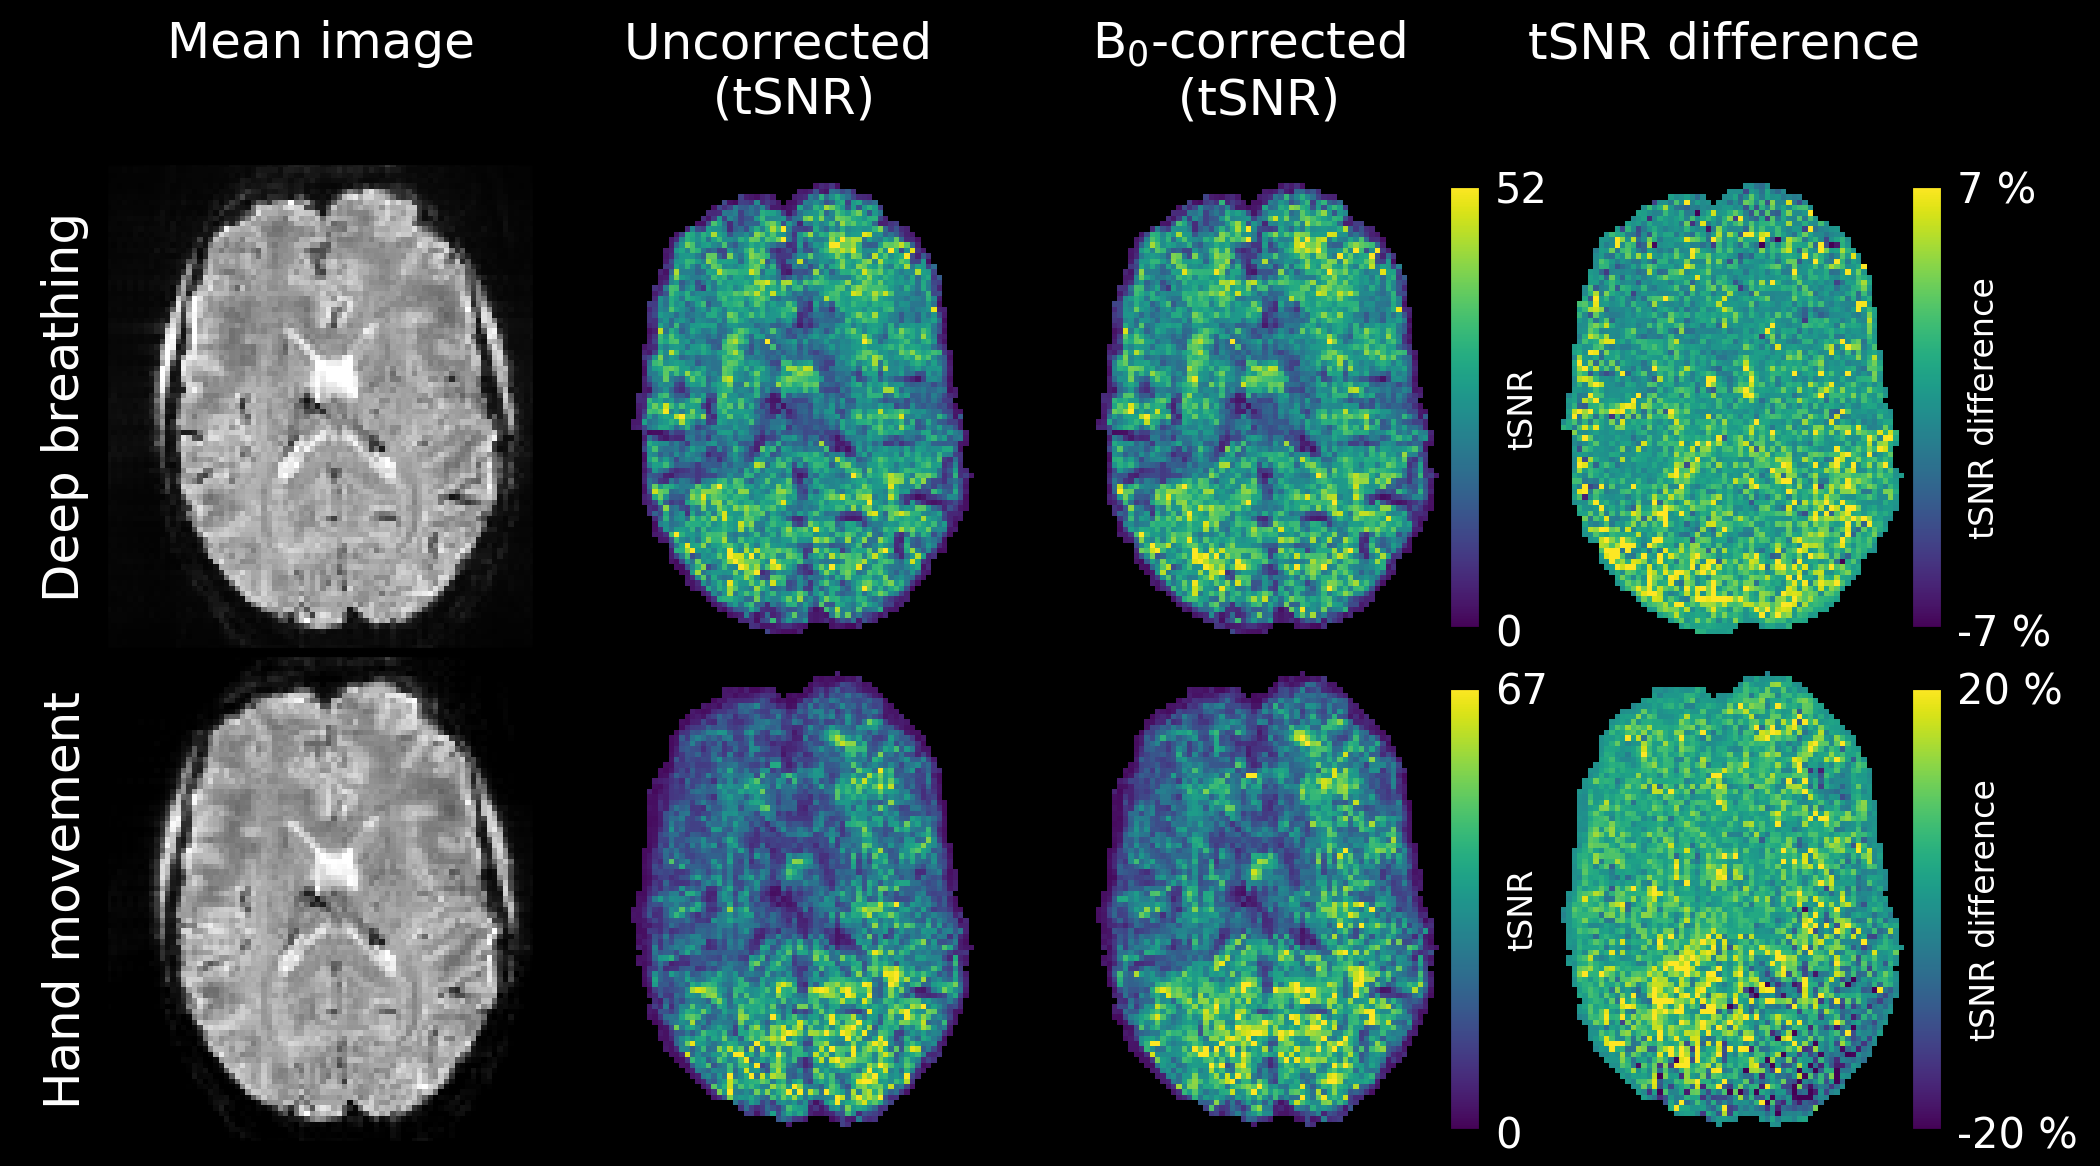
Axial example slices of tSNR maps for the 2mm-acquisitions are depicted in Fig. 3. By applying a 0th-order field correction, the mean tSNR in the brain was improved by 3.6% for the deep breathing experiment and by 11.0% for the hand-to-chin measurement. Despite this tSNR improvement, image voxels still show a considerable intensity fluctuation over time.
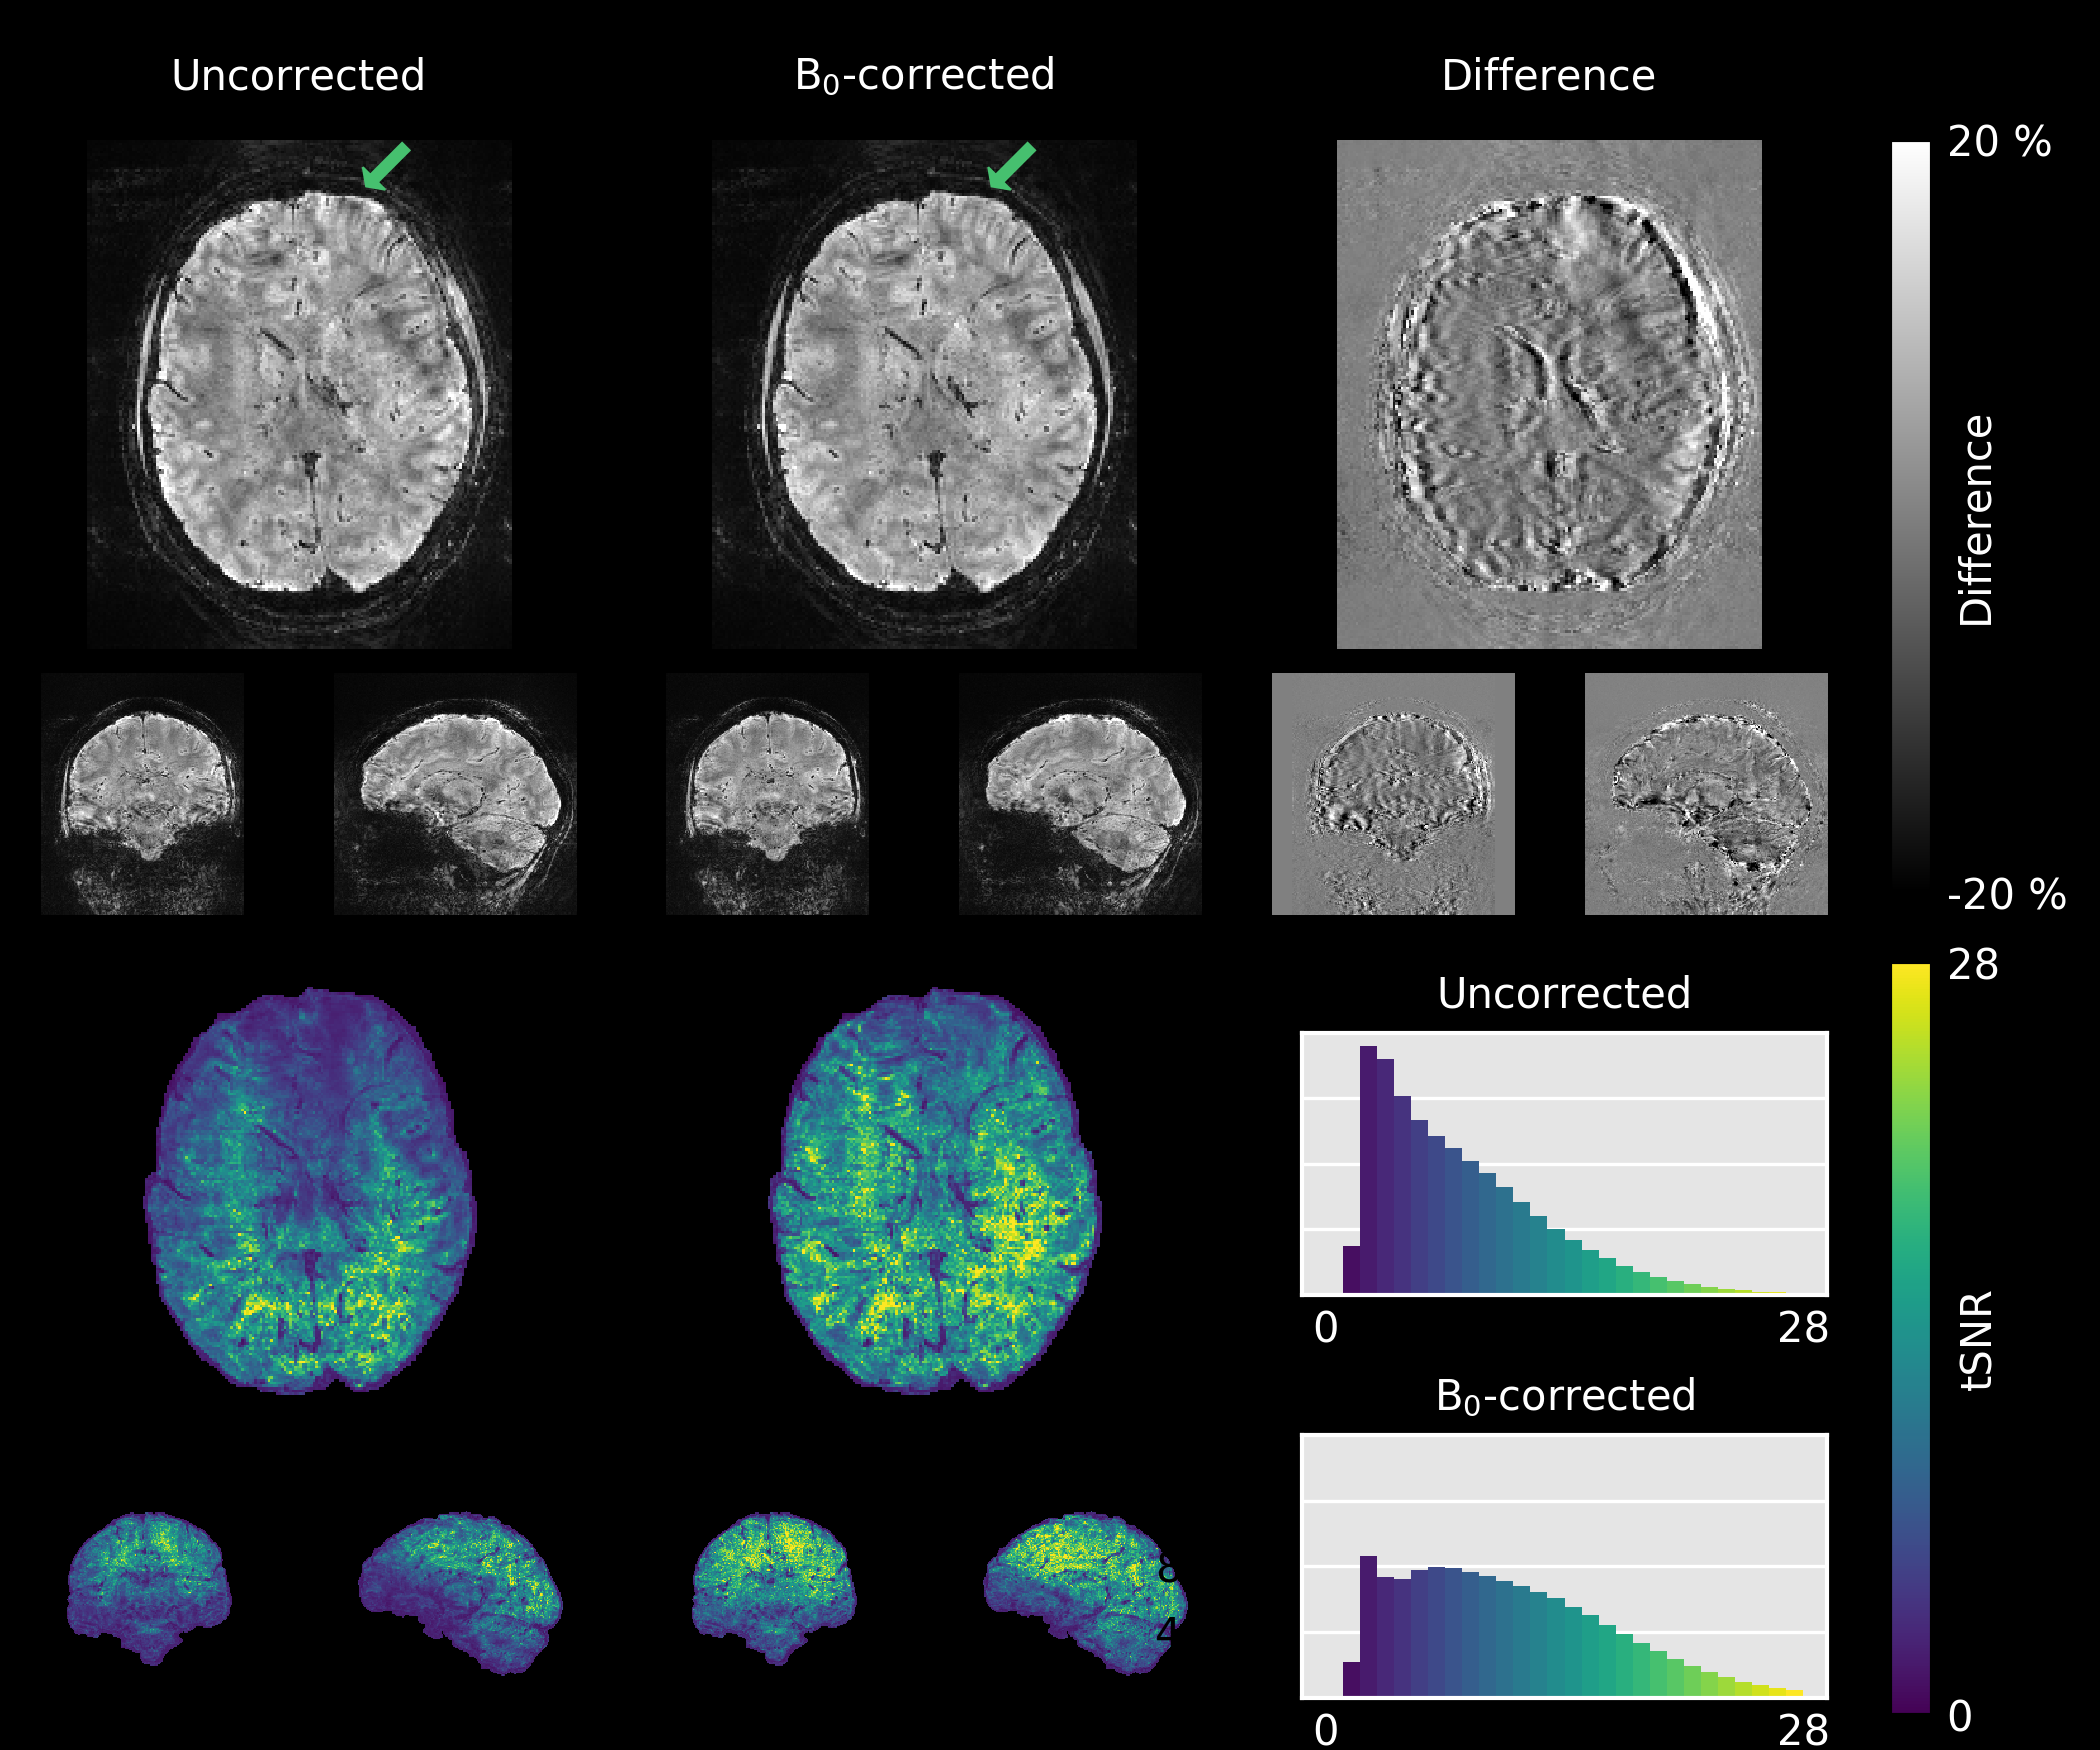
For the 1mm-protocol, a significant tSNR gain could be achieved with 0th-order field correction. The mean tSNR of the deep breathing data increased by 14.3%, those of the hand-to-chin experiment even by 35.6% (Fig. 4.). Severe image artifacts due to the large field fluctuations could be removed by B0 correction. Nevertheless, residual artifacts are clearly visible.
Discussion & Conclusion
The results confirm that segmented 3D-EPI measurements are prone to field fluctuations and that image quality and tSNR strongly benefits from 0th-order field correction. As expected, the influence of field changes is larger on the 1mm-measurements due to higher segmentation factor and longer volume acquisition time. However, remaining intensity fluctuations and image artifacts show that a higher spatial order field correction is necessary to further improve image quality. Vannesjo et al.8 demonstrated that field corrections of up to the 1st-order remove most artifacts in T2*-weighted 2D-GRE acquisitions.
In the next steps, the effect of 1st- or if necessary higher-order field correction will be investigated for 3D-EPI fMRI and QSM experiments. Furthermore, we aim to examine hardware-related higher-order field fluctuations by measuring field dynamics during the whole EPI echo train and include them in image reconstruction.
Acknowledgements
No acknowledgement found.References
1. Poser B, Koopmans P, Witzelm T, Wald L, Barth M. Three dimensional echo-planar imaging at 7 Tesla. NeuroImage. 2010;51:261–266.
2. Van Der Zwaag W, Marques J, Kober T, Glover G, Gruetter R, Krueger G. Temporal SNR characteristics in segmented 3D-EPI at 7T. Magn. Reson. Med. 2012;67:344–352.
3. Stirnberg R, Acosta-Cabronero J, Poser B, Stöcker T. 2D-segmented, multi-TE 3D-EPI for high-resolution R2* and quantitative susceptibility mapping at 7 Tesla. Proc. Intl. Soc. Mag. Reson. Med. 2015;23.
4. Stirnberg R, Deistung A, Reichenbach A, Stöcker T. Accelerated quantitative susceptibility and R2* mapping with flexible k-t-segmented 3D-EPI. Proc. Intl. Soc. Mag. Reson. Med. 2018;26.
5. Stirnberg R, Huijbers W, Brenner D, Poser B, Breteler M, Stöcker T. Rapid whole-brain resting-state fMRI at 3 Tesla: Efficiency-optimized three-dimensional EPI versus repetition time-matched simultaneous-multi-slice EPI. NeuroImage. 2017;163:81–92.
6. Pfeuffer J, Van de Moortele P, Ugurbil K, Hu X, Glover G. Correction of physiologically induced global off-resonance effects in dynamic echo-planar and spiral functional imaging. Magn. Reson. Med. 2002;47:344–353.
7. De Zanche N, Barmet C, Nordmeyer-Massner J, Pruessmann K. NMR Probes for measuring magnetic fields and field dynamics in MR systems. Magn. Reson. Med. 2008;60:176–186.
8. Vannesjo S, Wilm B, Duerst Y, Gross S, Brunner D, Dietrich B, Schmid T, Barmet C, Pruessmann K. Retrospective correction of physiological field fluctuations in high-field brain MRI using concurrent field monitoring. Magn. Reson. Med. 2015;73:1833–1843.
9. Bollmann S, Kasper L, Vannesjo S, Diaconescu A, Dietrich B, Gross S, Stephan K, Pruessmann K. Analysis and correction of field fluctuations in fMRI data using field monitoring. NeuroImage. 2017;154:92–105.
10. Stirnberg R, Brenner D, Stöcker T, Shah N. Rapid fat suppression for three-dimensional echo planar imaging with minimized specific absorption rate. Magn. Reson. Med. 2016;76:1517–1523.
Figures