0417
Quantification of patellofemoral cartilage deformation and contact area changes in response to static loading via high-resolution MRI with prospective motion correction1Dept. of Radiology, Medical Physics, Medical Center - University of Freiburg, Freiburg, Germany, 2Department of Informatics, Medical Image Computing Group, University of Bremen, Bremen, Germany, 3Institute for Medical Image Computing, Fraunhofer MEVIS Bremen, Bremen, Germany, 4Medical Physics in Radiology, German Cancer Research Center (DKFZ), Heidelberg, Germany, 5Department of Orthopedic and Trauma Surgery, Medical Center – University of Freiburg, Freiburg, Germany
Synopsis
Patellofemoral cartilage deformation and contact area changes in response to in situ loading were measured with high-resolution MRI. In situ loading was realized with a pneumatic loading device and motion artifacts were corrected with prospective motion correction based on optical tracking of the knee cap. Semi-automatic cartilage segmentation based on deep learning proved essential for robust quantification of the load-induced changes. Cartilage thickness and contact area showed significant and weight-dependent changes in response to loading. The patellofemoral deformation and contact mechanism under loading might be used for investigation of the knee biomechanics and as a biomarker of early-stage cartilage degeneration.
Introduction
In vivo cartilage deformation under in situ loading has only been
investigated in a few studies with biplane fluoroscopy1 and MRI2,3. However, MRI measurements with in situ loading are strongly hampered
by subject motion, particularly for the patellofemoral joint, which can only be
loaded involving knee flexion. In this work, robust measurement and
quantification of patellofemoral cartilage deformation and contact area changes
in response to in situ loading is demonstrated via high-resolution MRI with
prospective motion correction.4Methods
All MRI experiments were performed on a Magnetom Trio 3T system (Siemens Healthineers, Germany), using an 8-channel multipurpose coil (NORAS MRI products, Germany) for signal reception. Knee loading was performed with an MR-compatible pneumatic loading device enabling accurate load adjustment in the range of 0-500 N.5 Prospective motion correction was realized with a moiré phase tracking (MPT) system (Metria Innovation Inc., Milwaukee, US) consisting of a single in-bore camera and a single tracking marker.6,7 All MRI scans were performed with a T1-weighted spoiled 3D gradient-echo sequence using slab-selective water excitation with a spatial resolution of 0.4×0.4×0.5 mm3. Measurements with loads of 0/200/400 N were carried out in 15 healthy subjects with a knee flexion angle of approximately 40°. Repeatability was assessed via three examinations of the same subject with the protocol described above. Bone and cartilage segmentation was initially done manually for the whole subject cohort and was then regularized with a convolutional neural network (CNN) for the final results. For calculation of the cartilage contact area (CCA), the Euclidean distance between the two opposing cartilage surfaces was computed. Visualization of the inter-cartilage distance suggested the CCA to be defined as the cartilage surface region with an inter-cartilage distance below 1 mm. Cartilage thickness changes were evaluated within a region of interest (ROI) corresponding to the CCA under loading of 400 N. This ROI was transferred to the two other datasets (acquired with loads of 0 and 200 N) through registration of the three scans. For statistical evaluation, Wilcoxon signed-rank tests were used.Results
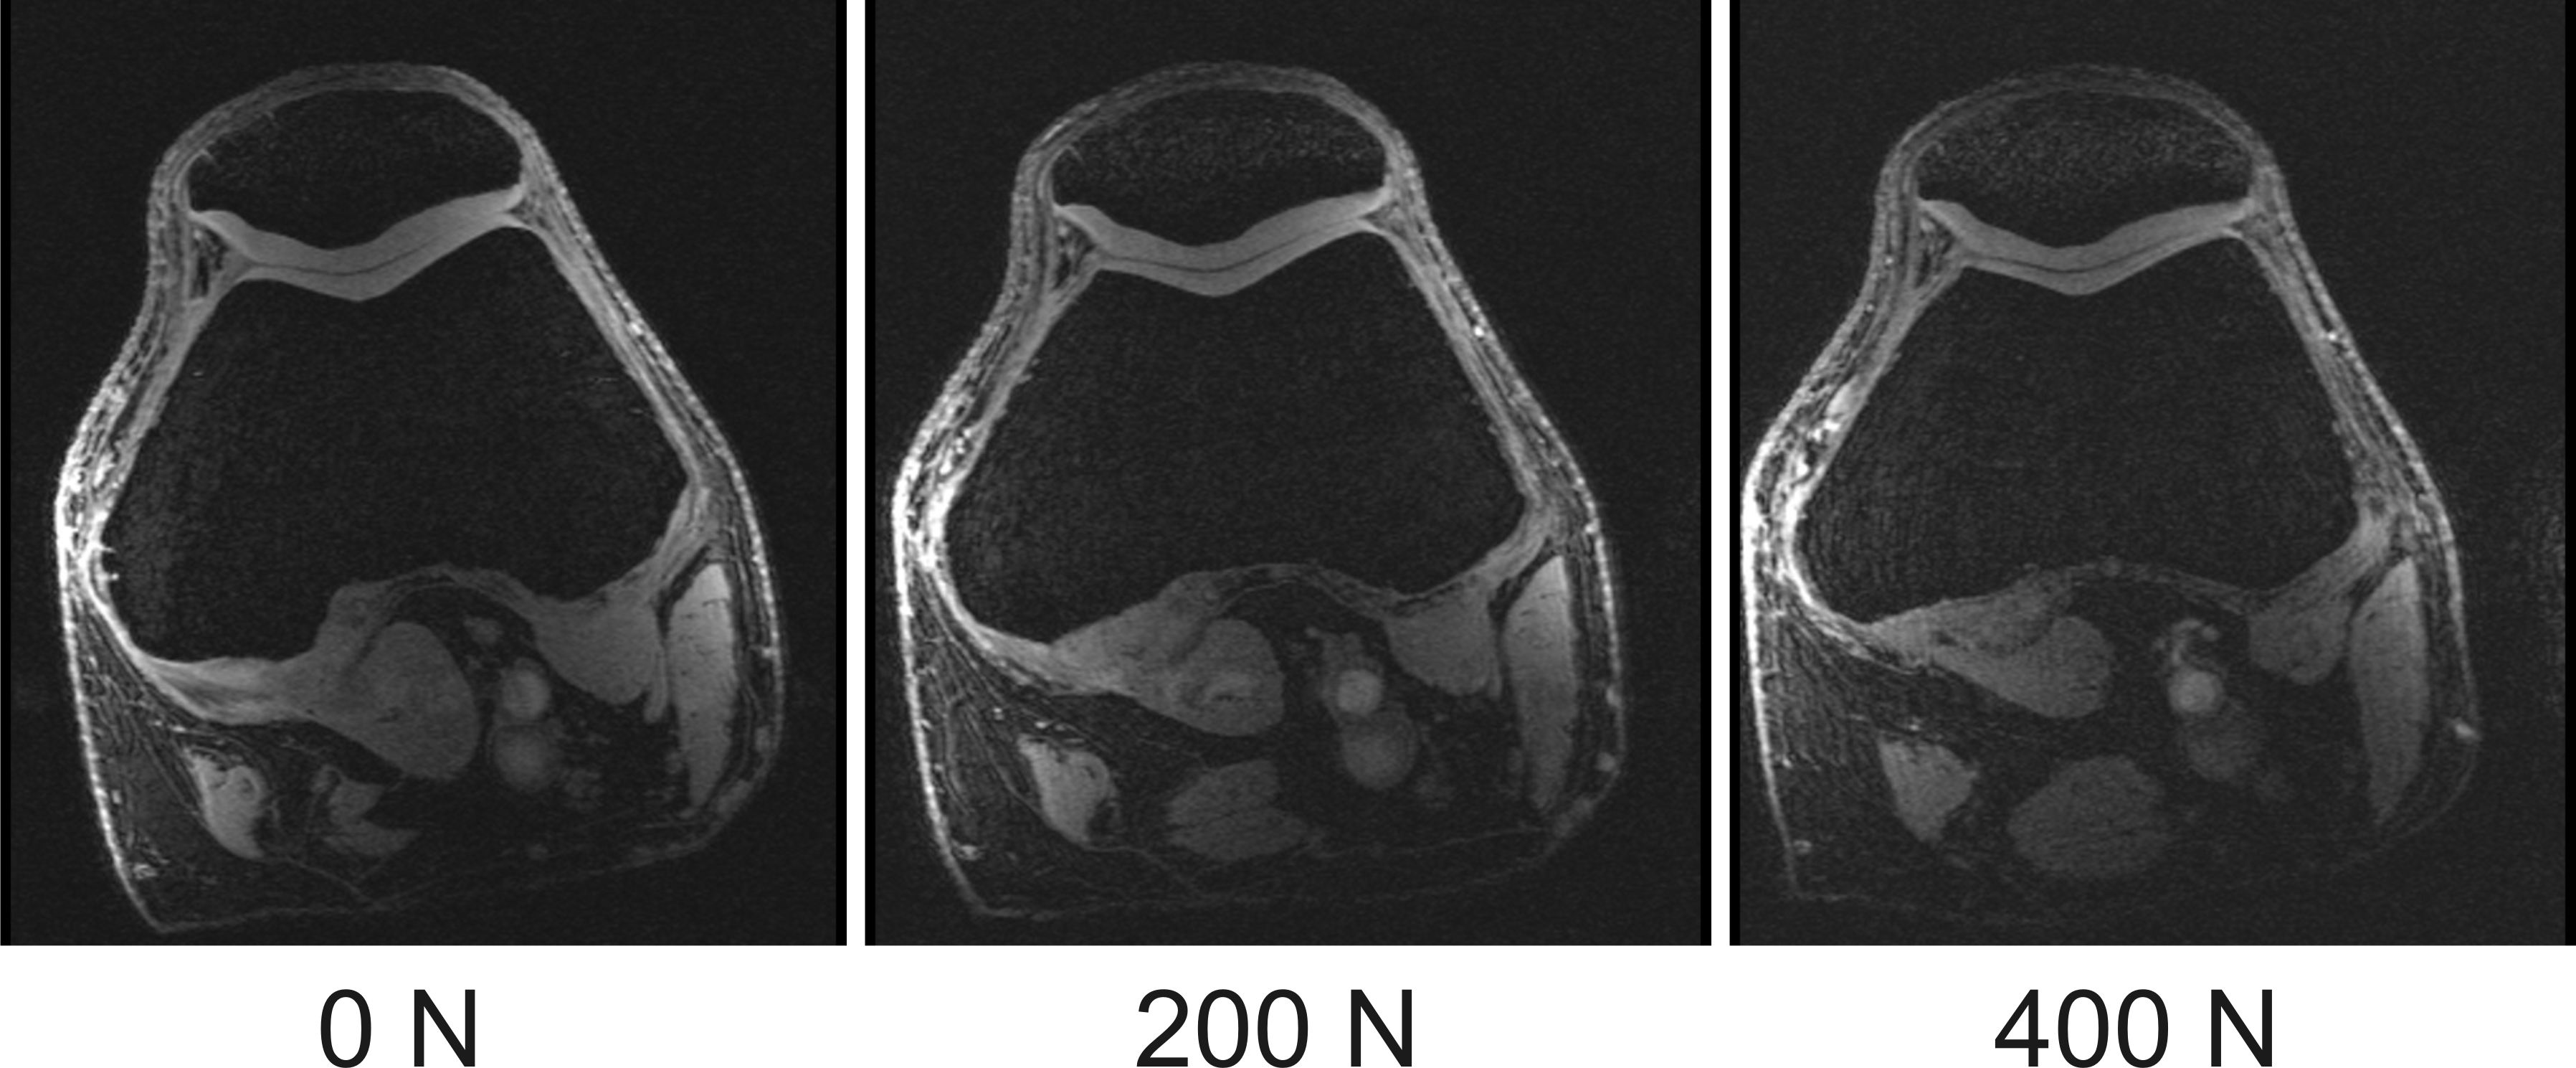
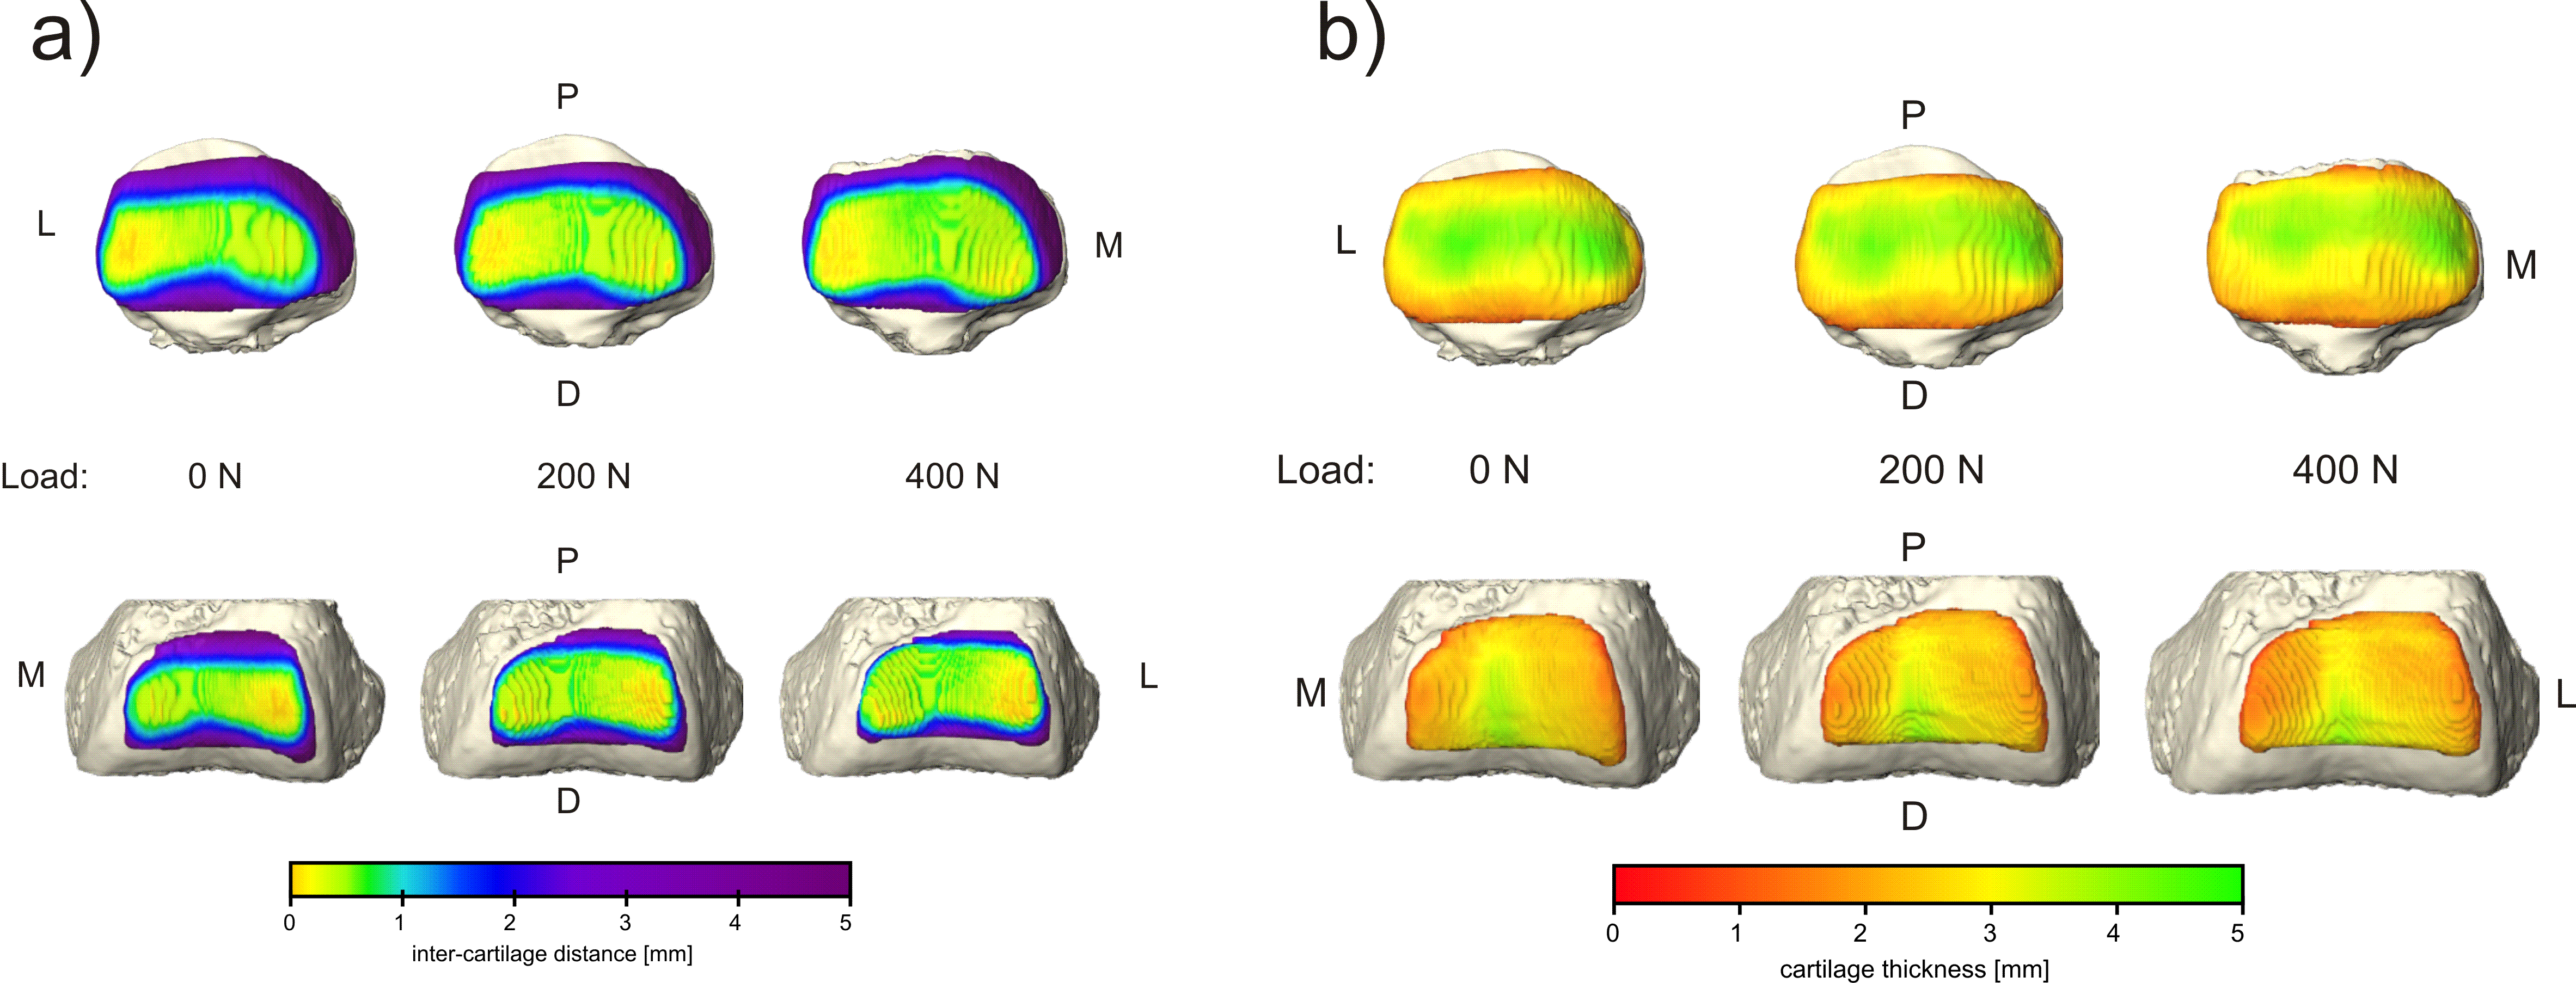
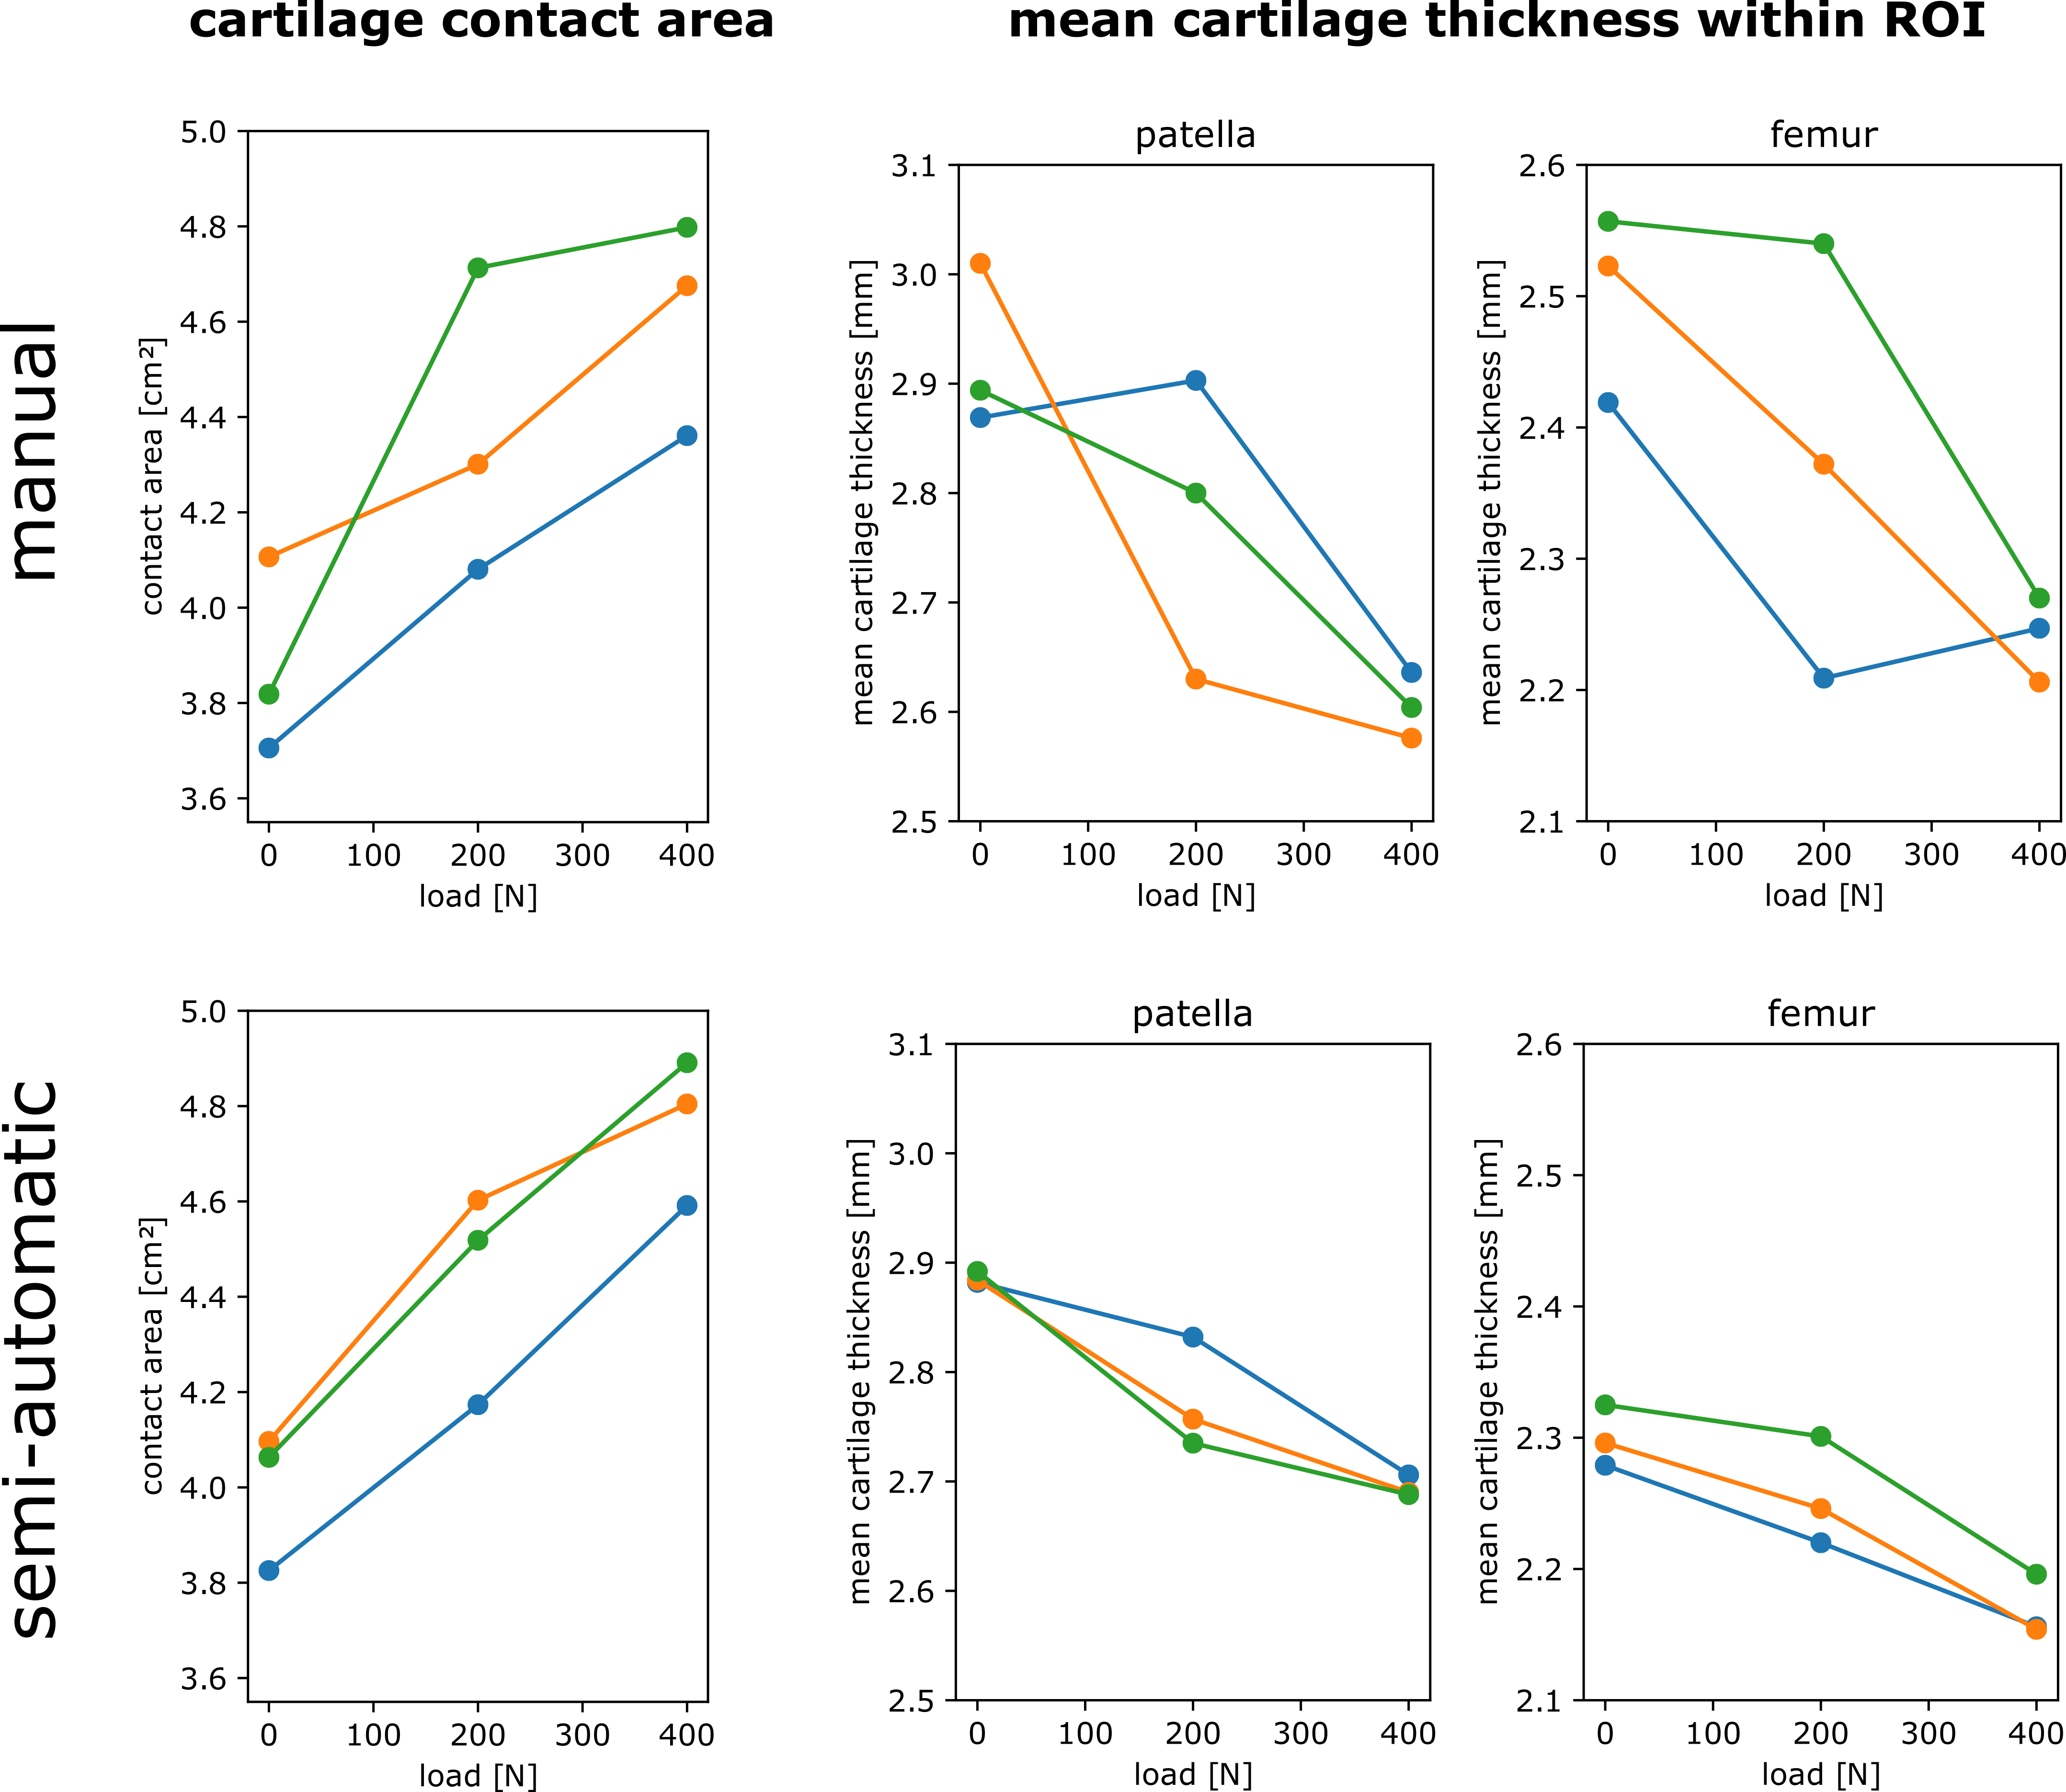
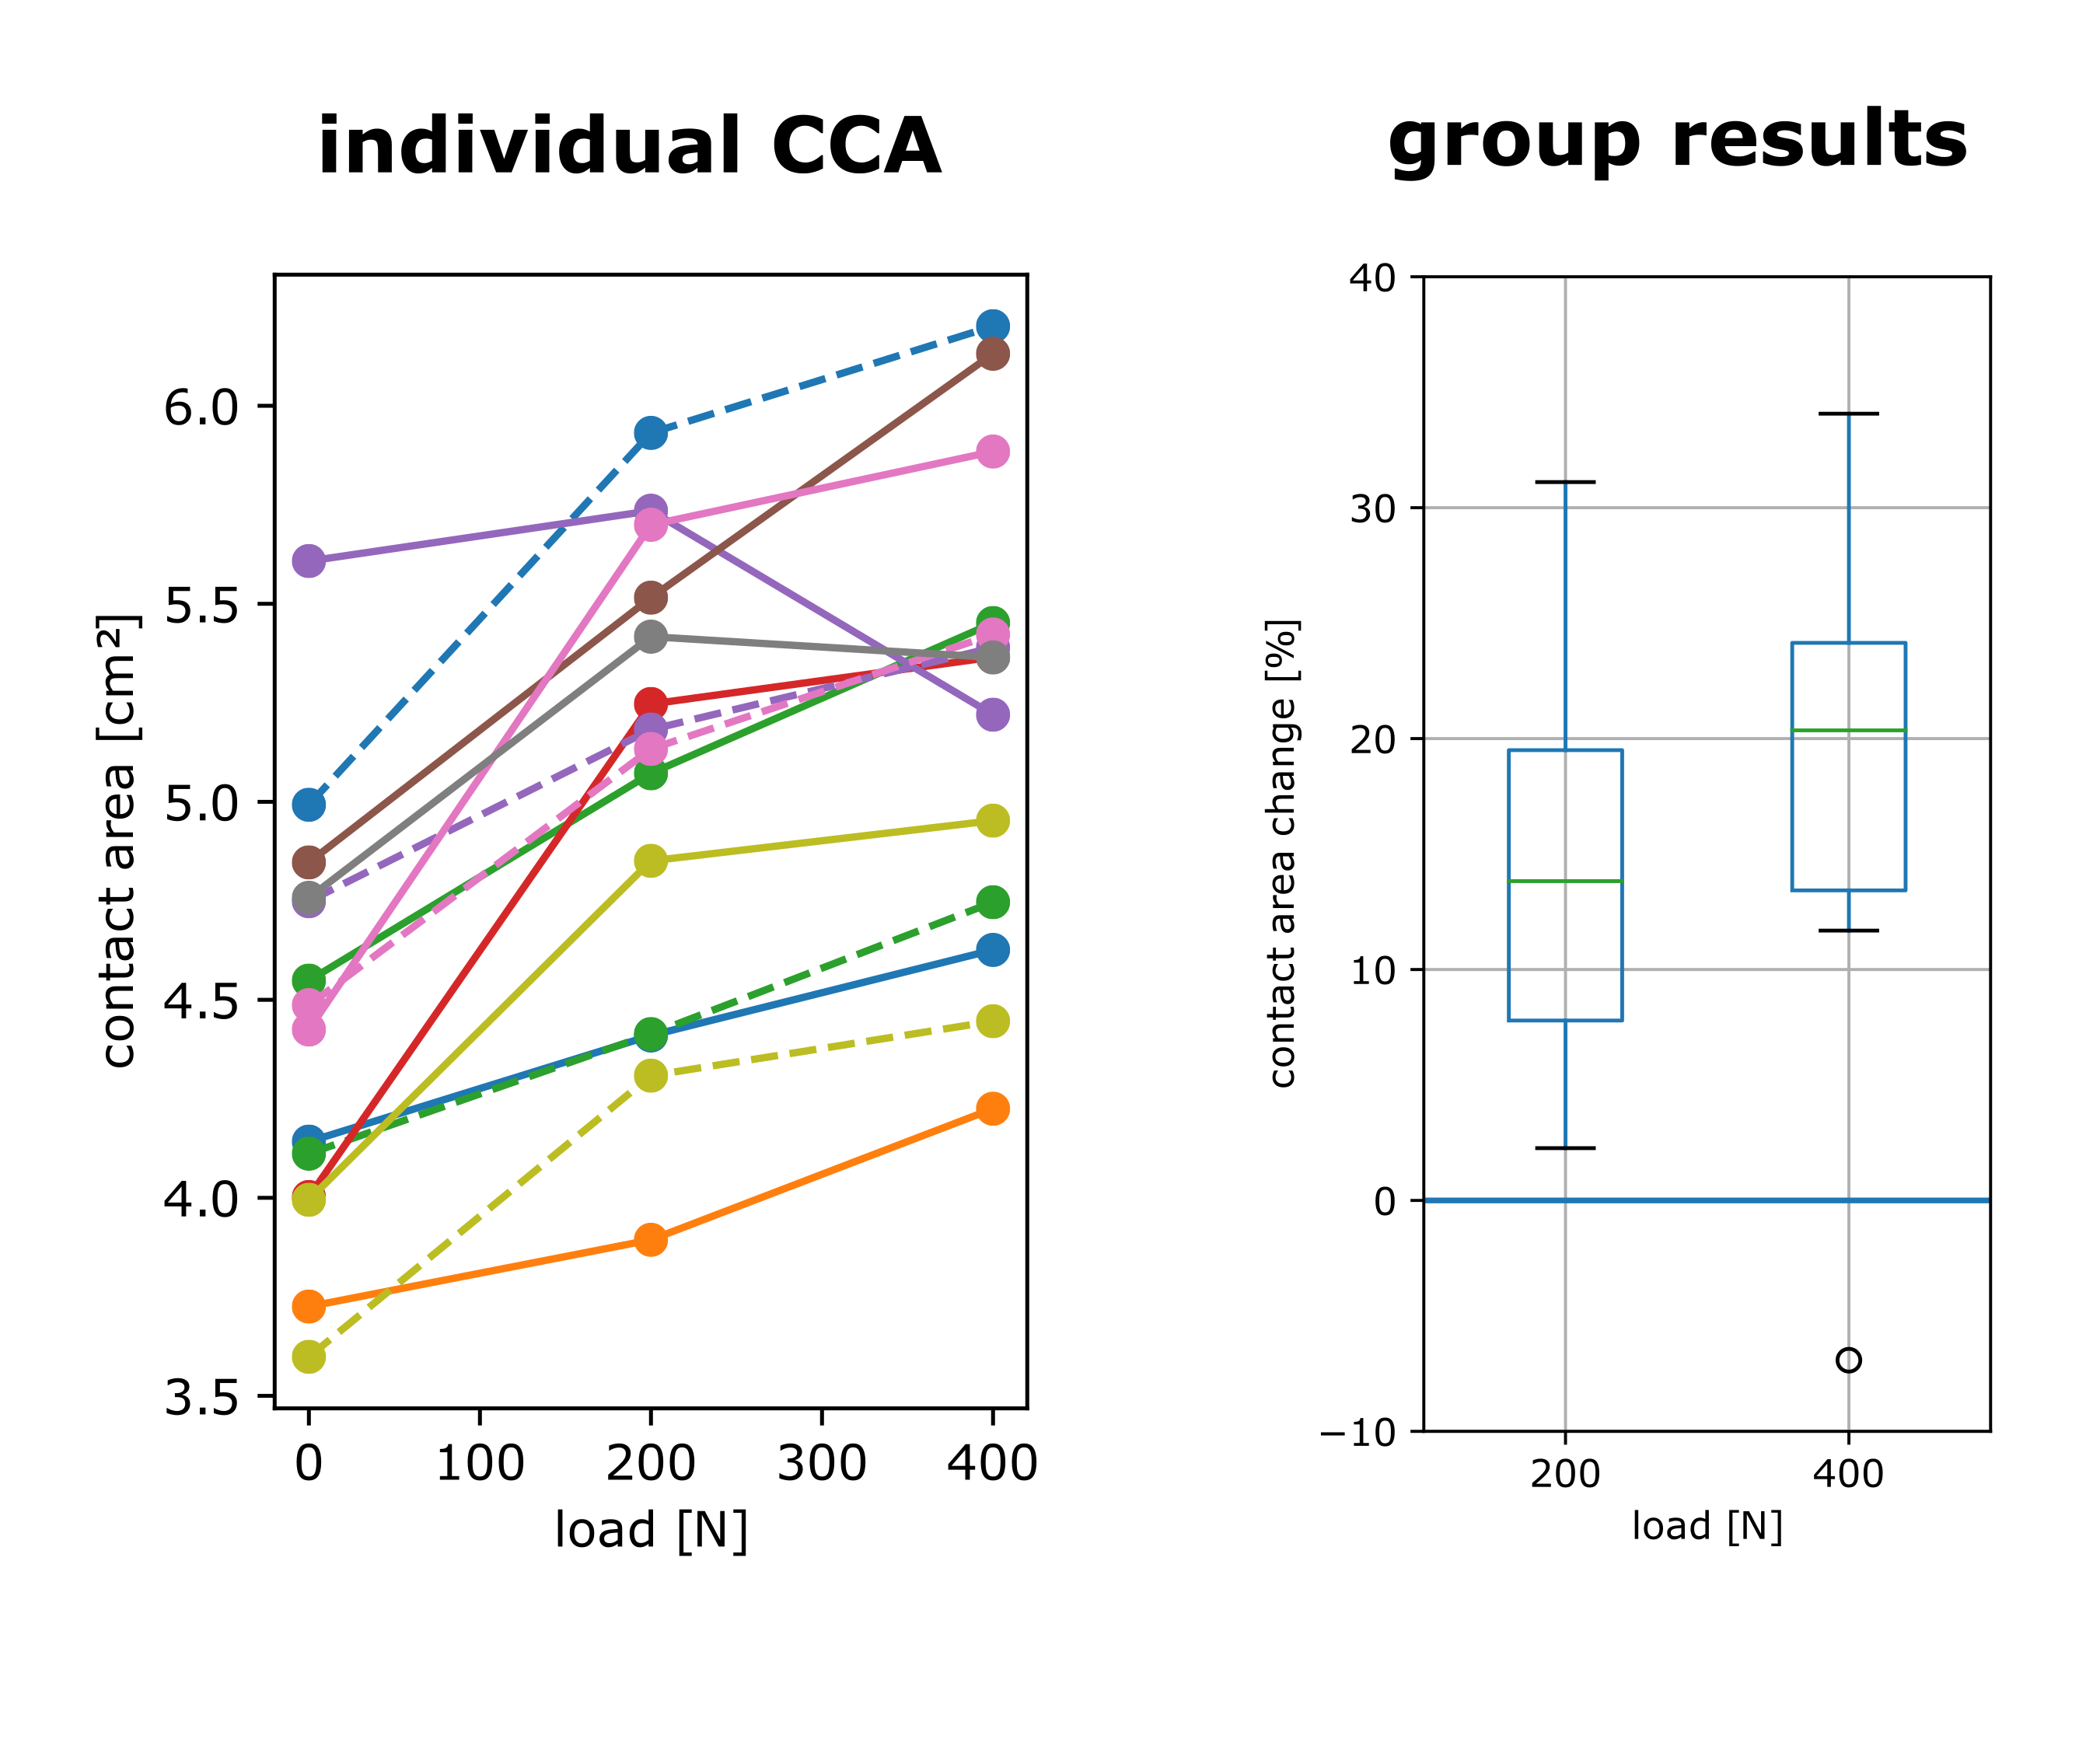
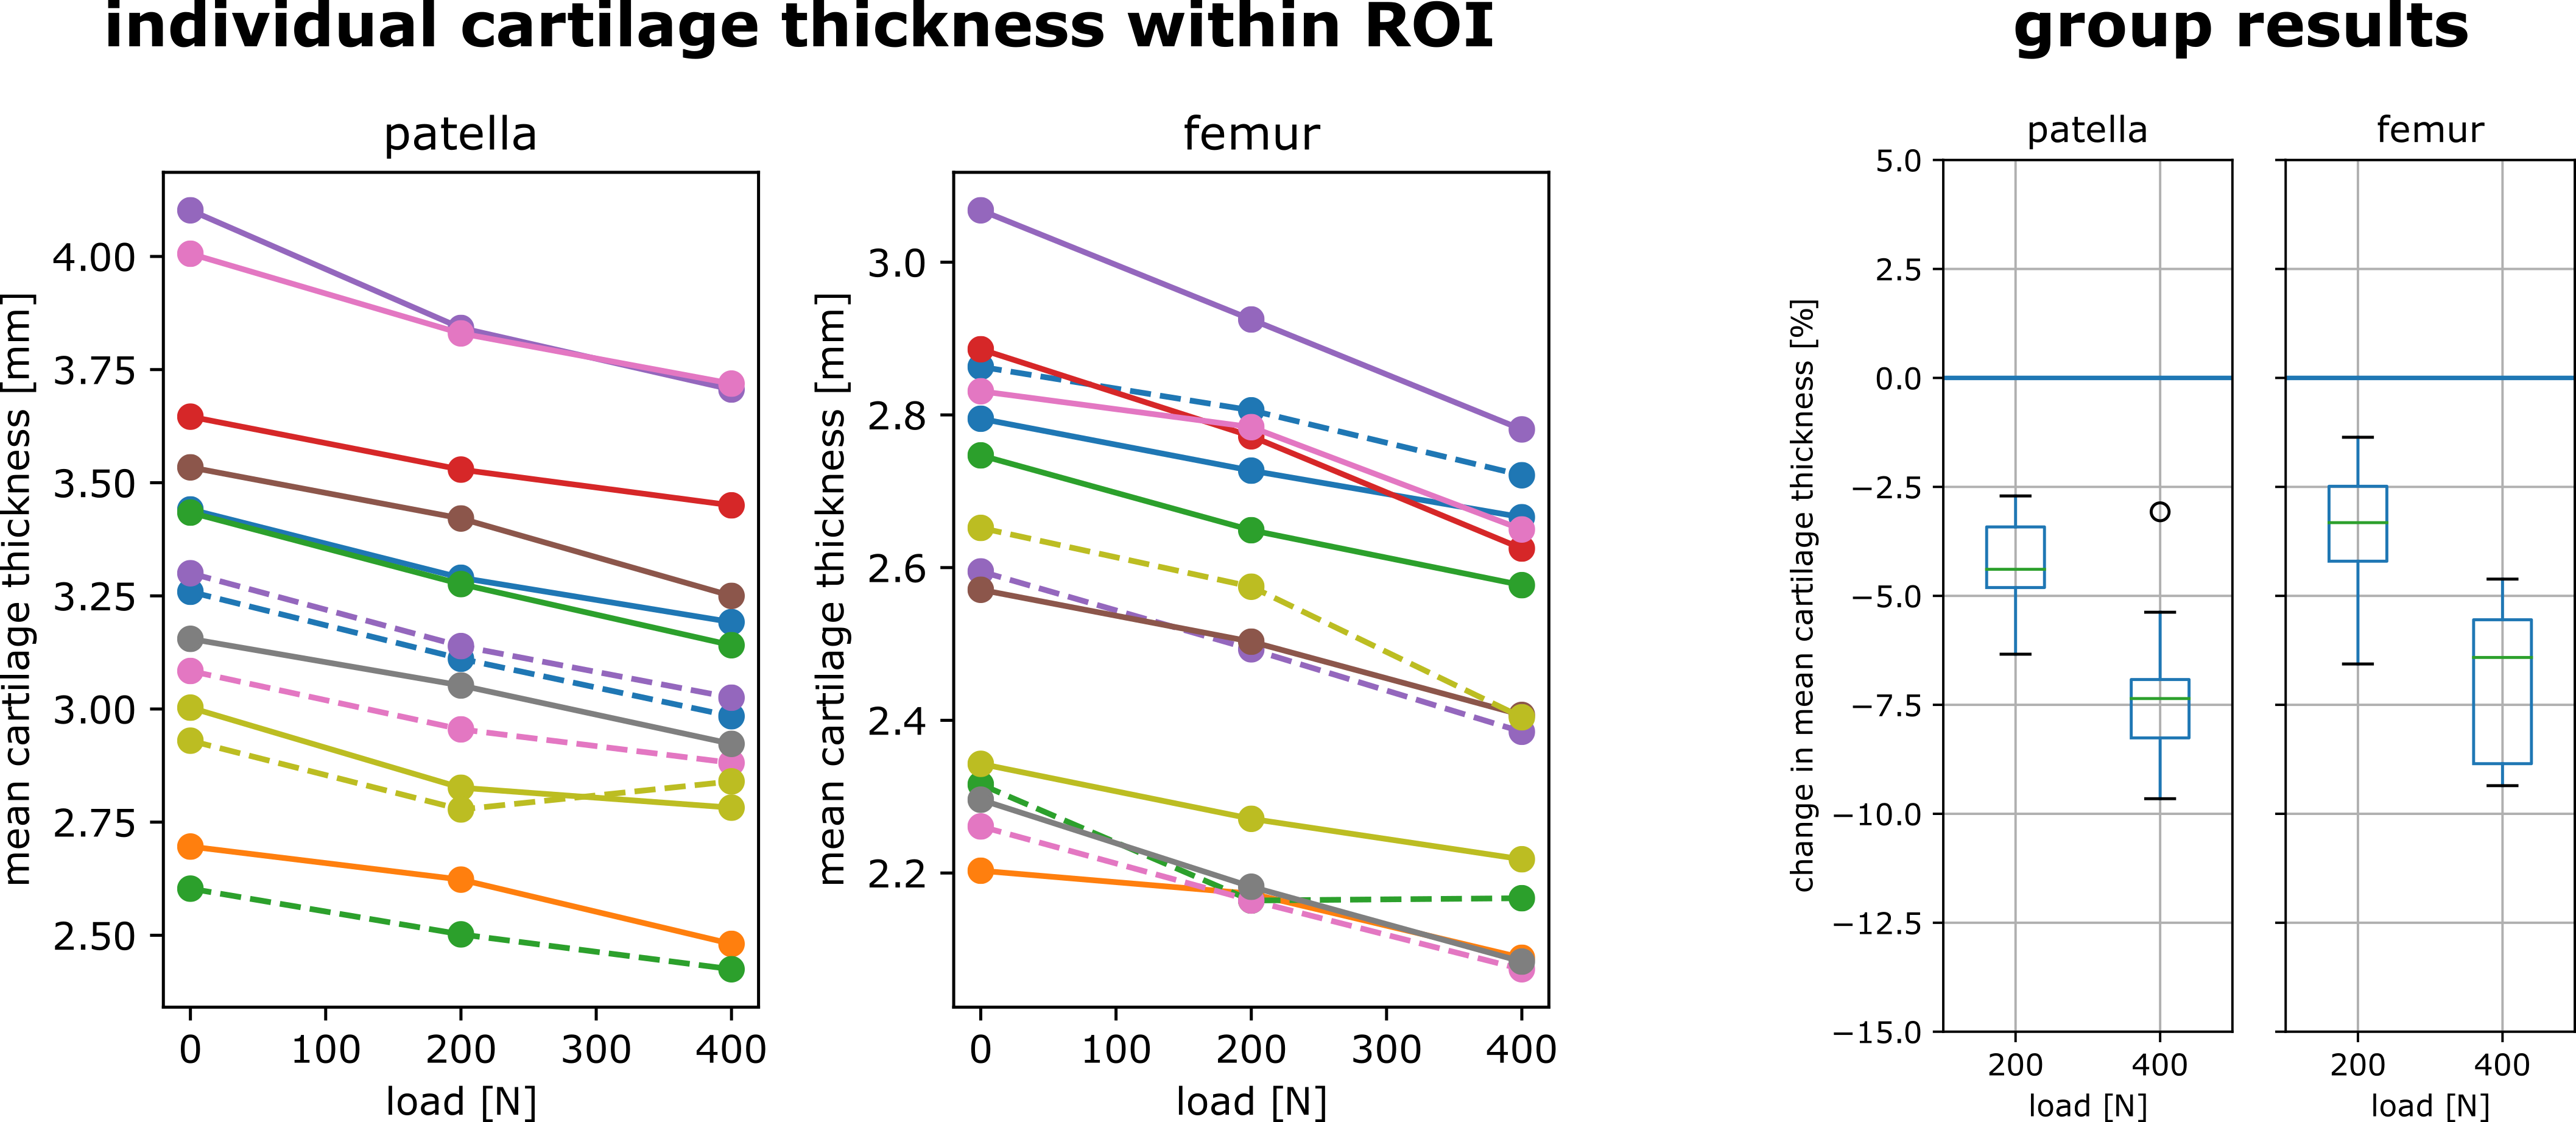
One of the 15 investigated subjects had to be excluded from further analysis due to excessive motion artifacts in the 400 N dataset. For all other 14 investigated volunteers, knee MRI could be performed without major motion artifacts, allowing for robust segmentation of bone and cartilage (Fig. 1). The inter-cartilage distance as well as patellar and femoral cartilage thickness as calculated from the segmentation results are illustrated for one healthy subject in Fig. 2, showing load-induced cartilage compression and CCA increase. While patellar cartilage compression was more pronounced within the distal part of the CCA, femoral cartilage compression could rather be observed within the proximal part of the CCA. Quantification of the repeatability measurements on one subject demonstrated more consistent results with additional CNN processing than with purely manual segmentation (Fig. 3). When results were averaged over all evaluated 14 subjects (Figs 4 and 5), patellofemoral CCA as well as patellar and femoral cartilage thickness turned out to be significantly different (all p < 0.05) for all three loading situations (0/200/400 N). While the measured cartilage thickness showed an almost linear increase with loading (within the measured load range), the observed CCA increase from 200 to 400 N was much smaller than the increase from 0 to 200 N. The CCA increased by 14.5 % and 19.0 % in response to loads of 200 N and 400 N, respectively. The patellar cartilage thickness decreased by 4.4 % and 7.4 % in response to loads of 200 N and 400 N while the femoral cartilage thickness decreased by 3.4 % and 7.1 %, respectively.Discussion
High-resolution 3D MRI with prospective motion correction enables quantitative evaluation of patellofemoral cartilage deformation and contact area changes in response to in situ loading. Segmentation augmented by additional CNN processing proved essential for robust quantification of the subtle load-induced changes. While the change of patellofemoral CCA under loading has previously been investigated in a number of studies8–10, this is the first work quantitatively assessing patellofemoral cartilage compression under in situ loading. Our measured relative cartilage compression approximately agrees with tibiofemoral measurements performed with in situ loading of half the body weight2 and patellofemoral measurements conducted right after several kinds of intense loading (kneeling/squatting/heel sitting/knee bends)11–13. The patellofemoral deformation and contact mechanism under loading might be used for investigation of the knee biomechanics and as a biomarker of early-stage cartilage degeneration.14Acknowledgements
Thomas Günter, Waldemar Schimpf and Gerd Strohmeier are gratefully acknowledged for building the pneumatic loading device. This work was funded in part by NIH grant 2R01DA021146 and in part by the Deutsche Forschungsgemeinschaft (DFG, German Research Foundation, contract grant numbers: LA 3353/4-1, IZ 70/2-1, ME 4202/3-1).References
1. Hosseini A, Van de Velde SK, Kozanek M, et al. In-vivo time-dependent articular cartilage contact behavior of the tibiofemoral joint. Osteoarthritis Cartilage. 2010;18:909–16.
2. Cotofana S, Eckstein F, Wirth W, et al. In vivo measures of cartilage deformation: patterns in healthy and osteoarthritic female knees using 3T MR imaging. Eur. Radiol. 2011;21(6):1127–1135.
3. Subburaj K, Souza RB, Stehling C, et al. Association of MR relaxation and cartilage deformation in knee osteoarthritis. J. Orthop. Res. 2012;30(6):919–926.
4. Zaitsev M, Dold C, Sakas G, et al. Magnetic resonance imaging of freely moving objects: prospective real-time motion correction using an external optical motion tracking system. Neuroimage. 2006;31:1038–50.
5. Lange T, Knowles B, Herbst M, et al. Comparative T2 and T1ρ mapping of patellofemoral cartilage under in situ mechanical loading with prospective motion correction. J. Magn. Reson. Imaging. 2017;46(2):452–460.
6. Maclaren J, Armstrong BSR, Barrows RT, et al. Measurement and Correction of Microscopic Head Motion during Magnetic Resonance Imaging of the Brain. PLoS ONE. 11;7:e48088.
7. Lange T, Maclaren J, Herbst M, et al. Knee cartilage MRI with in situ mechanical loading using prospective motion correction: Knee Cartilage MRI Using Prospective Motion Correction. Magn. Reson. Med. 2014;71(2):516–523.
8. Gold GE, Besier TF, Draper CE, et al. Weight‐bearing MRI of patellofemoral joint cartilage contact area. J. Magn. Reson. Imaging. 2004;20(3):526–530.
9. Besier TF, Draper CE, Gold GE, et al. Patellofemoral joint contact area increases with knee flexion and weight‐bearing. J. Orthop. Res. 2005;23(2):345–350.
10. Shin CS, Carpenter RD, Majumdar S, et al. Three-Dimensional In Vivo Patellofemoral Kinematics and Contact Area of Anterior Cruciate Ligament–Deficient and –Reconstructed Subjects Using Magnetic Resonance Imaging. Arthrosc. J. Arthrosc. Relat. Surg. 2009;25(11):1214–1223.
11. Eckstein F, Lemberger B, Gratzke C, et al. In vivo cartilage deformation after different types of activity and its dependence on physical training status. Ann. Rheum. Dis. 2005;64(2):291–295.
12. Eckstein F, Tieschky M, Faber S, et al. Functional analysis of articular cartilage deformation, recovery, and fluid flow following dynamic exercise in vivo. Anat Embryol Berl. 1999;200:419–24.
13. Horng A, Raya JG, Stockinger M, et al. Topographic deformation patterns of knee cartilage after exercises with high knee flexion: an in vivo 3D MRI study using voxel-based analysis at 3T. Eur. Radiol. 2015;25(6):1731–1741.
14. Farrokhi S, Colletti PM, Powers CM. Differences in patellar cartilage thickness, transverse relaxation time, and deformational behavior: a comparison of young women with and without patellofemoral pain. Am J Sports Med. 2011;39:384–91.
Figures