0302
Cervical spinal cord diffusion MRI and intraspinal space restriction at the occipito-cervical junction in mucopolysacharidoses patients1Department of Pediatrics, University of Minnesota, Minneapolis, MN, United States, 2Center for Magnetic Resonance Research, University of Minnesota, Minneapolis, MN, United States, 3Department of Neurology, Palacky University, Olomouc, Czech Republic, 4Department of Biomedical Engineering, University Hospital Olomouc, Olomouc, Czech Republic, 5Department of Medicine III, Clinical Division of Endocrinology and Metabolism, Medical University of Vienna, Vienna, Austria, 6Institute of Biomedical Engineering, Polytechnique Montreal, Montreal, QC, Canada
Synopsis
The overall goal of this project is to establish novel MRI parameters for reliable detection of cervical spinal cord (CSC) microstructural abnormalities in patients with Mucopolysaccharidosis (MPS) that develop prior to the clinical manifestation of spinal cord damage. Quantitative analysis of diffusion MRI (dMRI) may characterize microstructural alterations of CSC with high sensitivity. In this study measures of CSC microstructure were determined by dMRI using a protocol based on the RESOLVE (REadout Segmentation Of Long Variable Echo trains) sequence. Derived diffusion metrics were then related to the anatomical measures of the cervical spine in patients with MPS.
Introduction
Mucopolysaccharidosis (MPS) is a group of rare hereditary lysosomal disorders with prominent somatic disease affecting multiple systems including the central nervous system1. Cervical spine abnormalities in MPS may result in cervical spinal cord (CSC) compression and irreversible neurological disability2. CSC compression frequently occurs at the occipito-cervical (OC) junction due to the connective tissue hypertrophy caused by MPS pathology. Increased signal intensity on T2-weighted images that is considered an MRI sign of myelopathy does not provide sufficient specificity and sensitivity for estimation of lesion severity and reversibility as it occurs in the presence of advanced stenosis and developed clinical symptoms2. Therefore, novel sensitive MRI methods, allowing quantification of the microstructural substrate of tissue damage, are needed to detect cervical cord impairment in the asymptomatic stage.Methods
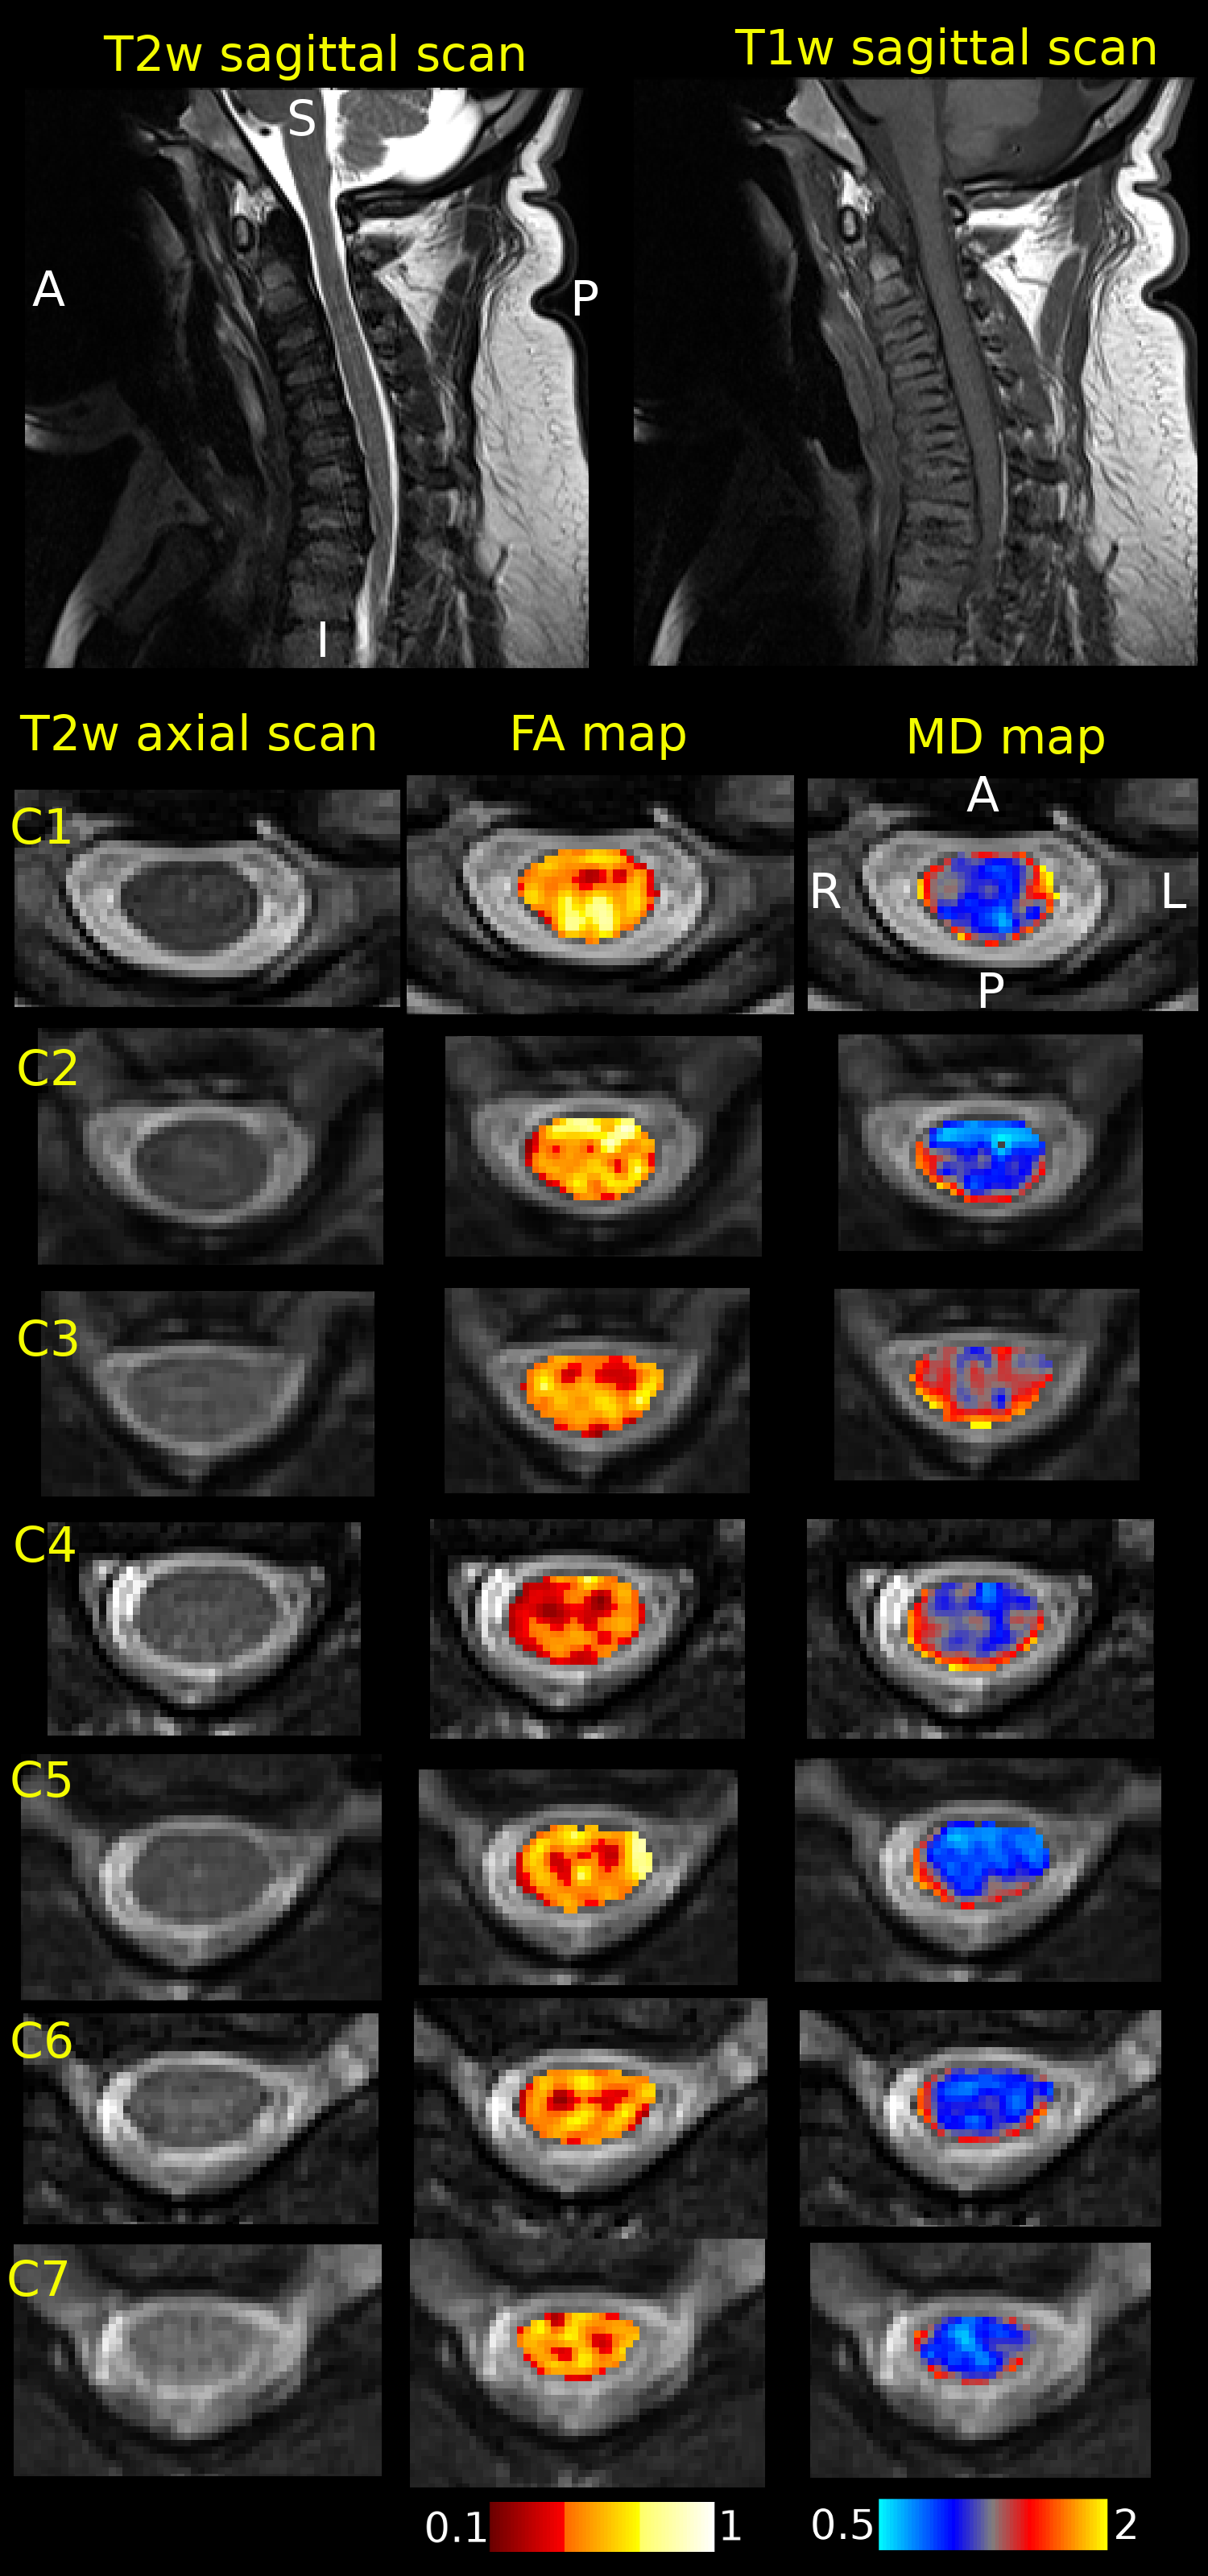
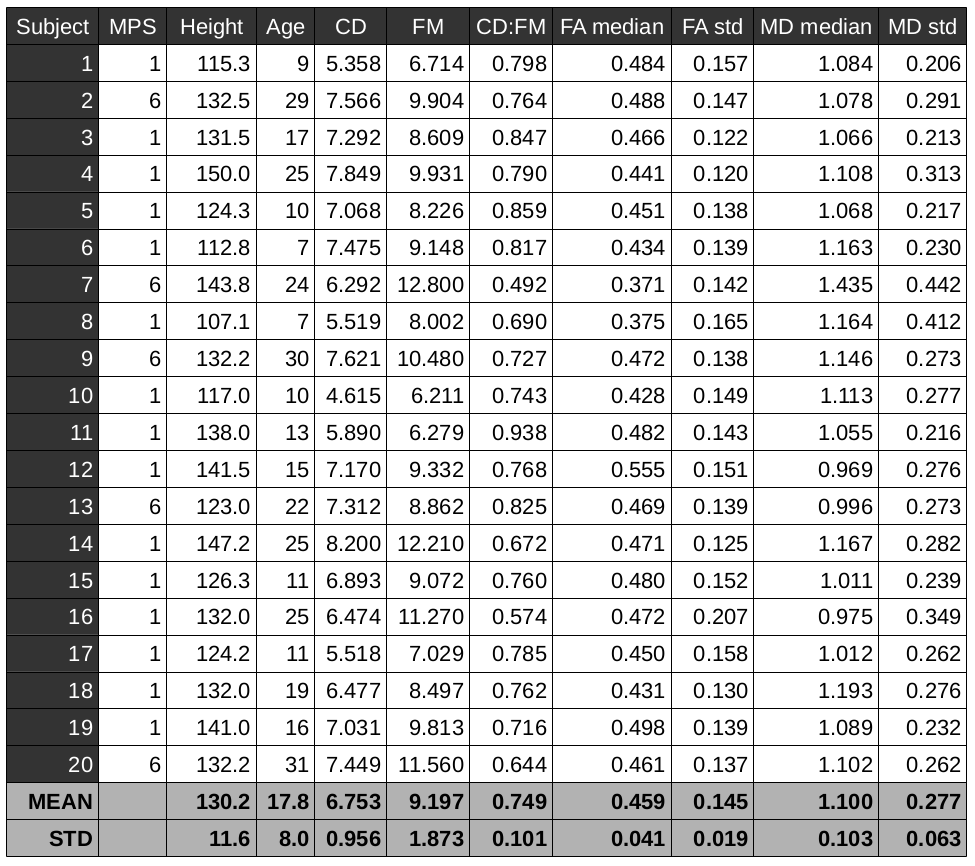
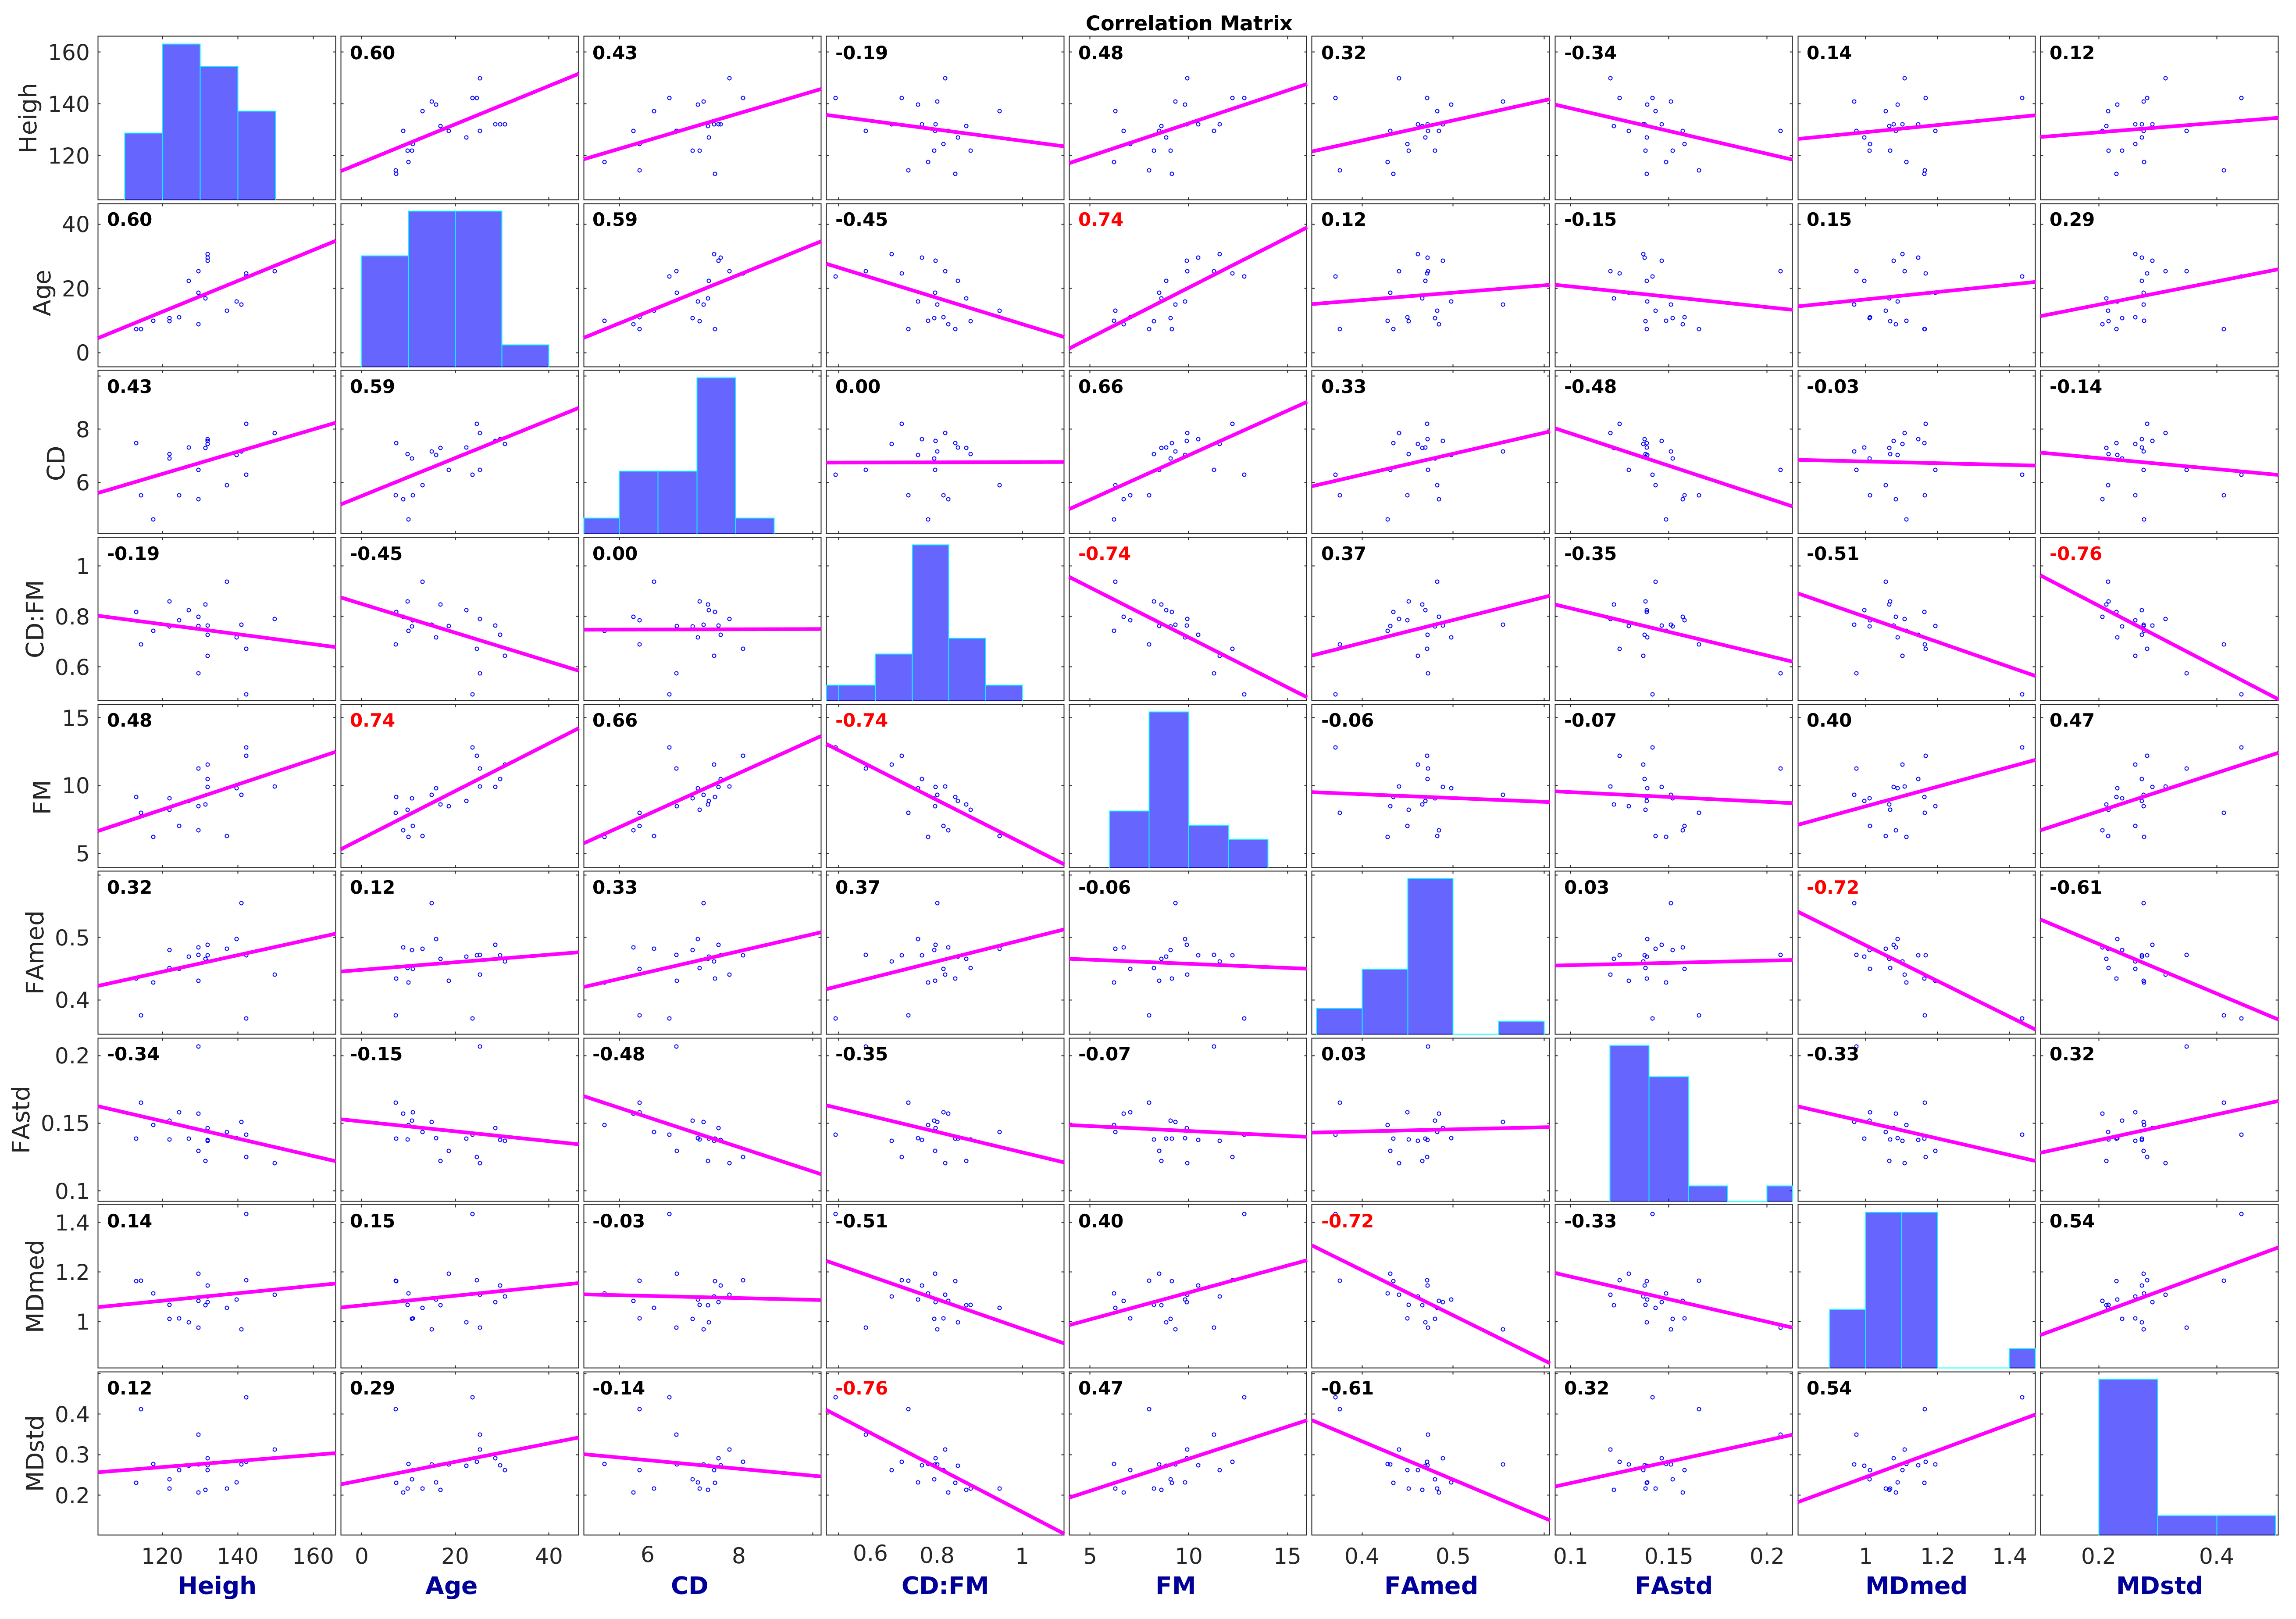
Sagittal T2-weighted (TR/TE 3500/91ms, voxel size 0.7×0.7×3.3mm3), T1-weighted (TR/TE 4000/90ms, 0.7×0.7×3.3mm3) and axial T2-weighted (TR/TE 4000/90ms, 0.56×0.56×3.3mm3) scans followed by diffusion MRI (dMRI) were acquired on 3T Siemens Prisma scanner using a 20-channel head/neck coil. Twenty scans in thirteen MPS (types I and VI) patients (17.7±7.9 years of age, 4 females) were acquired in the IRB approved study. RESOLVE (REadout Segmentation Of Long Variable Echo trains) dMRI protocol consisted of two identical sessions with opposite anterior-posterior and posterior-anterior phase encodings. Each dMRI dataset has 30 diffusion weightings with b=650smm-2 and 6 b0 images covering the C1-C7 levels with 30 contiguous axial slices, TR=4500ms, TE1=52ms, TE2=82ms, voxel size 1.1×1.1×3.3mm3. Data were processed with Spinal Cord Toolbox 3.2.33, Advanced Normalization Tools 2.1.04 and FSL 5.0.105 software libraries wrapped within in-house made shell and MATLAB (MathWorks, USA) scripts. Susceptibility, eddy current and motion artifacts6,7 were corrected in the dMRI data and diffusion tensor imaging (DTI) model8 was fitted. T2-weighted axial scan was co-localized based on T2-weighted sagittal scan. SC segmentation9 were performed in T2-weighted axial space. C1-C7 was labeled manually in T2-weighted axial space (using simultaneous overlay of T2-weighted sagittal image). DTI derived fractional anisotropy (FA) and mean diffusivity (MD) maps were warped into T2-weighted axial space, and single-subject means and standard deviations (std) from C1-C7 area were estimated. Cord diameter (CD) and foramen magnum (FM) diameter were manually measured below the opisthion as a mean from T1-weighted and T2-weighted sagittal scans to yield a CD:FM ratio10. Association matrix utilizing Pearson correlation coefficients (r) were quantified between patient age, height, CD, FM, CD:FM, FA median, FA std, MD median and MD std. Correlations of p<0.001 were considered significant. Eigenvectors of the matrix were rotated into the variable space with Principal Component Analysis (PCA, optimized with singular value decomposition – SVD)11 and with factor analysis12.Results
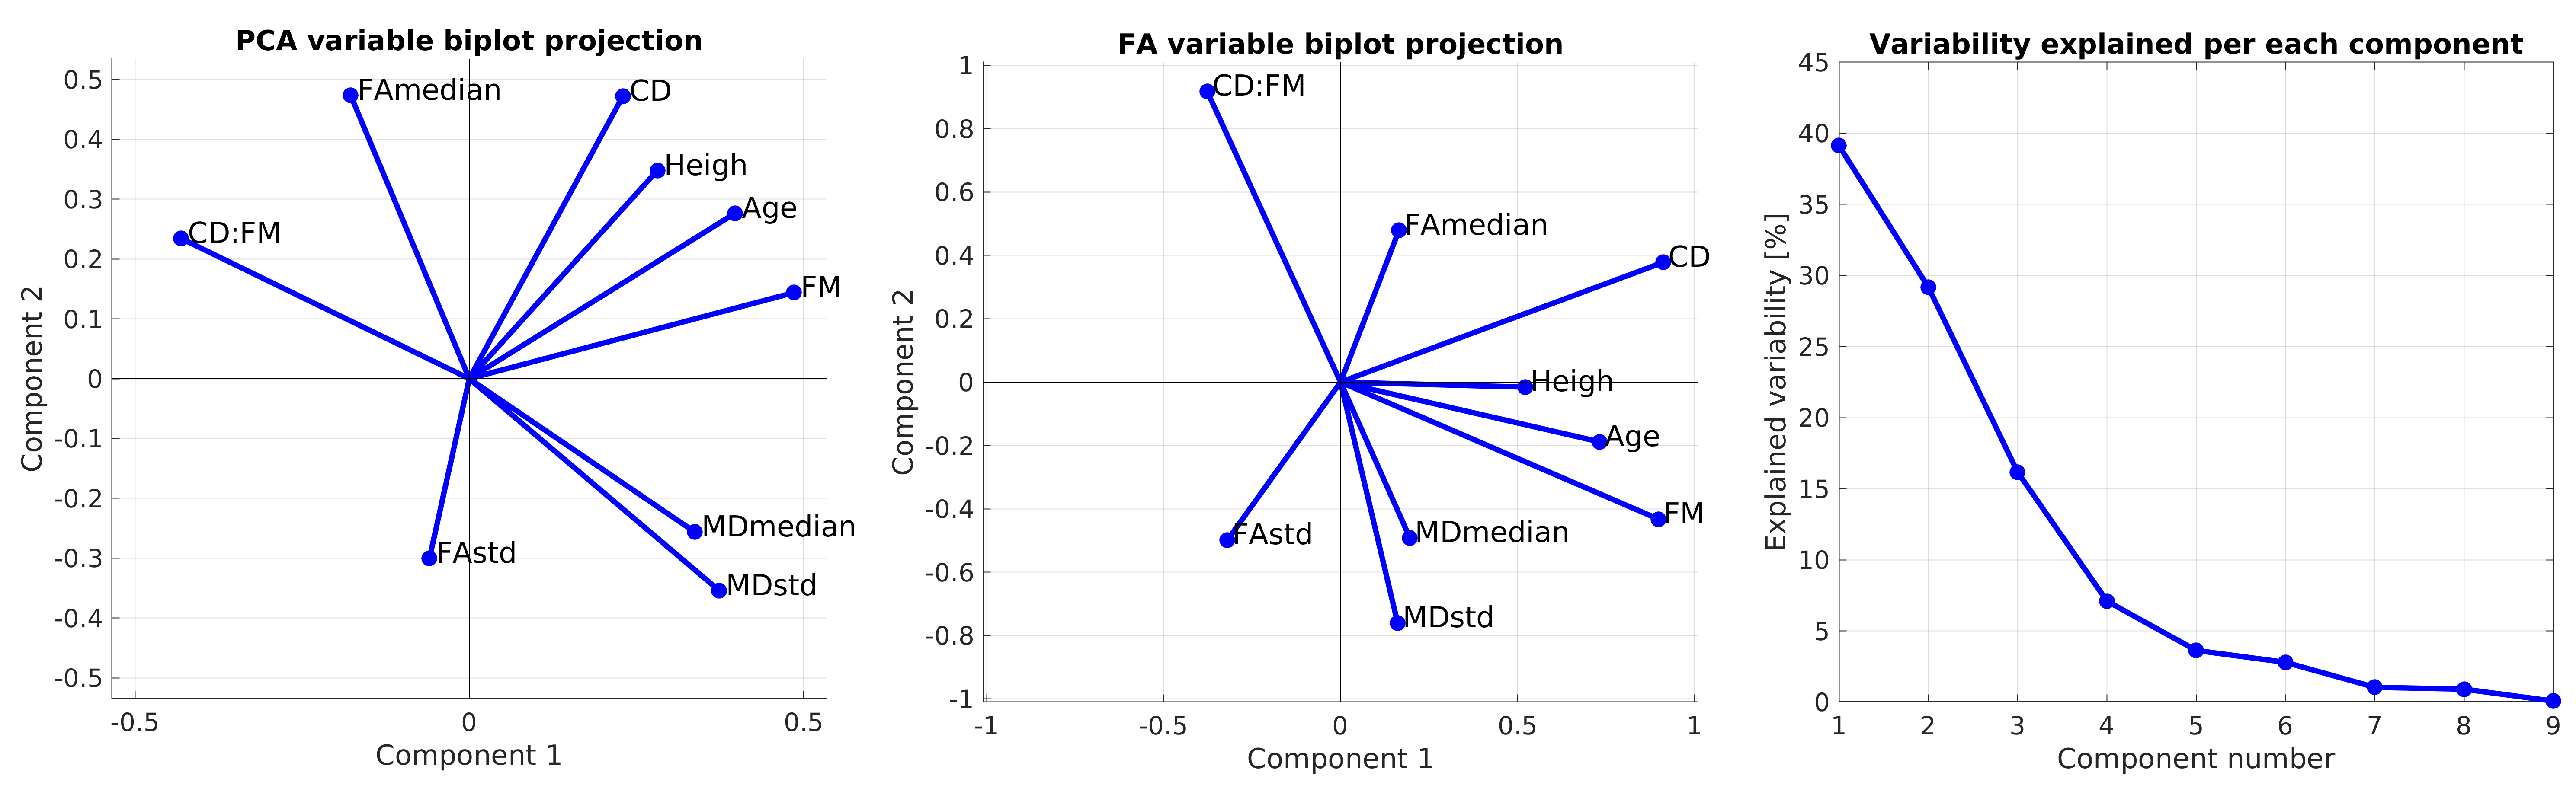
Example of single-subject acquired data and DTI metric maps (i.e. FA and MD) is shown in Fig. 1. Quantitative metrics with group-averaged means and stds for all scans are listed in Table 1. Visualization of association matrix (r) with data distribution projections and simple parameter histograms are shown in Fig. 2 with supra-thresholded coefficients. The matrix presents: FM to be age correlated (p=1.87e-4) and CD:FM anti-correlated (p=2.13e-4); MD median to be FA median anti-correlated (p=3.38e-4) and CD:FM to be MD std anti-correlated (p=1.08e-4). The first two components of a 9-dimensional orthogonal base of the association matrix explained 68.31% data variability (Fig. 3). Both base rotations (i.e. PCA or factor analysis) demonstrated similar properties in a Component1-Component2 biplot projections (Fig. 3). CD:FM demonstrated anti-correlation to MD std and also to the MD median (Fig. 3). FA median was similarly anti-correlated to MD std and MD median, but with lesser effect than CD:FM (Fig. 3). FA median and FA std were partly anti-correlated (Fig. 3).Discussion
A narrower distribution of MD values has been reported in subjects with degenerative cervical spinal cord injury with absent T2 signal hyperintensity when compared to healthy controls13. In the current study, a narrower MD distribution was associated with higher CD:FM ratio in MPS subjects. CD:FM ratio may be considered a restriction measure of an intraspinal space at the OC junction. This finding is suggestive of changes in the spinal cord at the microstructural level in patients with higher ratio of spinal cord/foramen magnum diameters. A comparison to healthy controls is necessary to elucidate these relationships in healthy population as well as an increase in the number of MPS subjects to confirm these preliminary results.Conclusion
Intraspinal anatomical space restriction at the OC junction may predispose MPS patients to a spinal cord injury. Diffusion measures in the cervical spinal cord can detect microstructural changes in the CSC and potentially serve as a predictor of spinal cord injury in MPS patients.Acknowledgements
Supported by: Orphan Disease Center at the University of Pennsylvania MDBR-17-123-MPS; NIH U54NS065768, Lysosomal Disease Network; the Genzyme Sanofi; NIH P41 EB015894, P30 NS076408 and 1S10OD017974-01; Czech Health Research Council NV18-04-00159. AS is funded from the European Union’s Horizon 2020 research and innovation program under the Marie Skłodowska-Curie grant agreement No 794986.References
1. Shapiro EG, Jones SA, Escolar ML. Developmental and behavioral aspects of mucopolysaccharidoses with brain manifestations — Neurological signs and symptoms. Mol. Genet. Metab. 2017;122:1–7 doi: 10.1016/j.ymgme.2017.08.009.
2. Peck SH, Casal ML, Malhotra NR, Ficicioglu C, Smith LJ. Pathogenesis and treatment of spine disease in the mucopolysaccharidoses. Mol. Genet. Metab. 2016;118:232–243 doi: 10.1016/j.ymgme.2016.06.002.
3. De Leener B, Lévy S, Dupont SM, et al. SCT: Spinal Cord Toolbox, an open-source software for processing spinal cord MRI data. Neuroimage 2017;145:24–43 doi: 10.1016/j.neuroimage.2016.10.009.
4. Avants BB, Tustison N, Song G. Advanced Normalization Tools (ANTs). Insight J. 2009;2:1–35 doi: http://hdl.handle.net/10380/3113.
5. Jenkinson M, Beckmann CF, Behrens TEJ, Woolrich MW, Smith SM. Fsl. Neuroimage 2012;62:782–790 doi: 10.1016/j.neuroimage.2011.09.015.
6. Andersson JLR, Skare S, Ashburner J. How to correct susceptibility distortions in spin-echo echo-planar images: Application to diffusion tensor imaging. Neuroimage 2003;20:870–888 doi: 10.1016/S1053-8119(03)00336-7.
7. Andersson JLR, Sotiropoulos SN. An integrated approach to correction for off-resonance effects and subject movement in diffusion MR imaging. Neuroimage 2016;125:1063–1078 doi: 10.1016/j.neuroimage.2015.10.019.
8. Basser PJ, Mattiello J, LeBihan D. MR diffusion tensor spectroscopy and imaging. Biophys. J. 1994;66:259–67 doi: 10.1016/S0006-3495(94)80775-1.
9. Gros C, De Leener B, Badji A, et al. Automatic segmentation of the spinal cord and intramedullary multiple sclerosis lesions with convolutional neural networks. Neuroimage 2018;184:901–915.
10. Solanki GA, Lo WB, Hendriksz CJ. MRI morphometric characterisation of the paediatric cervical spine and spinal cord in children with MPS IVA (Morquio-Brailsford syndrome). J. Inherit. Metab. Dis. 2013;36:329–337 doi: 10.1007/s10545-013-9585-3.
11. Shlens J. A Tutorial on Principal Component Analysis. arXiv Prepr. 2014.
12. Harman HH. Modern factor analysis. University of Chicago press; 1976.
13. Labounek R, Valošek J, Horák T, et al. Novel HARDI-ZOOMit protocol detects changes in spinal cord microstructure in patients with asymptomatic non-myelopathic degenerative cervical spinal cord compression. In: ISMRM 27th Annual Meeting & Exhibition. Montreal; 2019.
Figures