0199
Lymphovascular invasion correlates with elevated tumor pressure as quantified by MR Elastography: initial results from a breast cancer trial1School of Biomedical Engineering & Imaging Sciences, King's College London, London, United Kingdom, 2Guy's and St.Thomas' NHS Foundation Trust, London, United Kingdom, 3Division of Cancer Studies, King's College London, London, United Kingdom, 4Department of Radiology and Nuclear Medicine, Amsterdam UMC, Amsterdam, Netherlands, 5King's College Hospital, London, United Kingdom, 6Biomedical Engineering, University of Michigan, Ann Arbor, MI, United States, 7U1148, INSERM, Paris, France
Synopsis
Gauging metastatic propensity is crucial as it impacts decision making in oncology (e.g. whether a patient should receive surgery immediately or neoadjuvant chemotherapy). Interstitial fluid pressure (IFP) is known to correlate with microvascular invasion, a proxy for metastatic potential. However, no current imaging biomarkers correlate with this. We present a method to noninvasively calculate a total tumor pressure (which IFP contributes to). The method reconstructs pressure via nonlinear biomechanics and MR Elastography and is validated in simulations and phantoms. Elevated pressure values from a cohort of 16 breast cancer patients correlate with lymphovascular invasion possibly providing a much sought-after biomarker.
Introduction
Interstitial fluid pressure (IFP) in tumors is often elevated relative to surrounding tissue because of factors such as vessel leakiness1. High IFP in tumors is known to obstruct therapy and has been shown to decrease with successful treatment2. Elevated IFP corresponds to increased outward flux and so leads to increased invasion and migration2. Hence, it may be a proxy for metastatic propensity. Unfortunately, no current clinical methods allow for the non-invasive quantification of tumor pressure.
Our previous work has demonstrated a proof-of-concept for quantifying a total tumor pressure (which IFP contributes to) via MR Elastography (MRE)3,4. The method uses a classical MRE scan in combination with a nonlinear biomechanical model for tissue to estimate the degree by which a tumor needs to be contracted virtually in order to homogenize the surrounding elasticity distribution in the vicinity of the lesion. In FEM simulations and phantom experiments, the method yields valid results. We show in a cohort of patients with breast lesions (n=16), those that have the highest pressure also have histopathologically proven lymphovascular invasion (LVI).
Methods
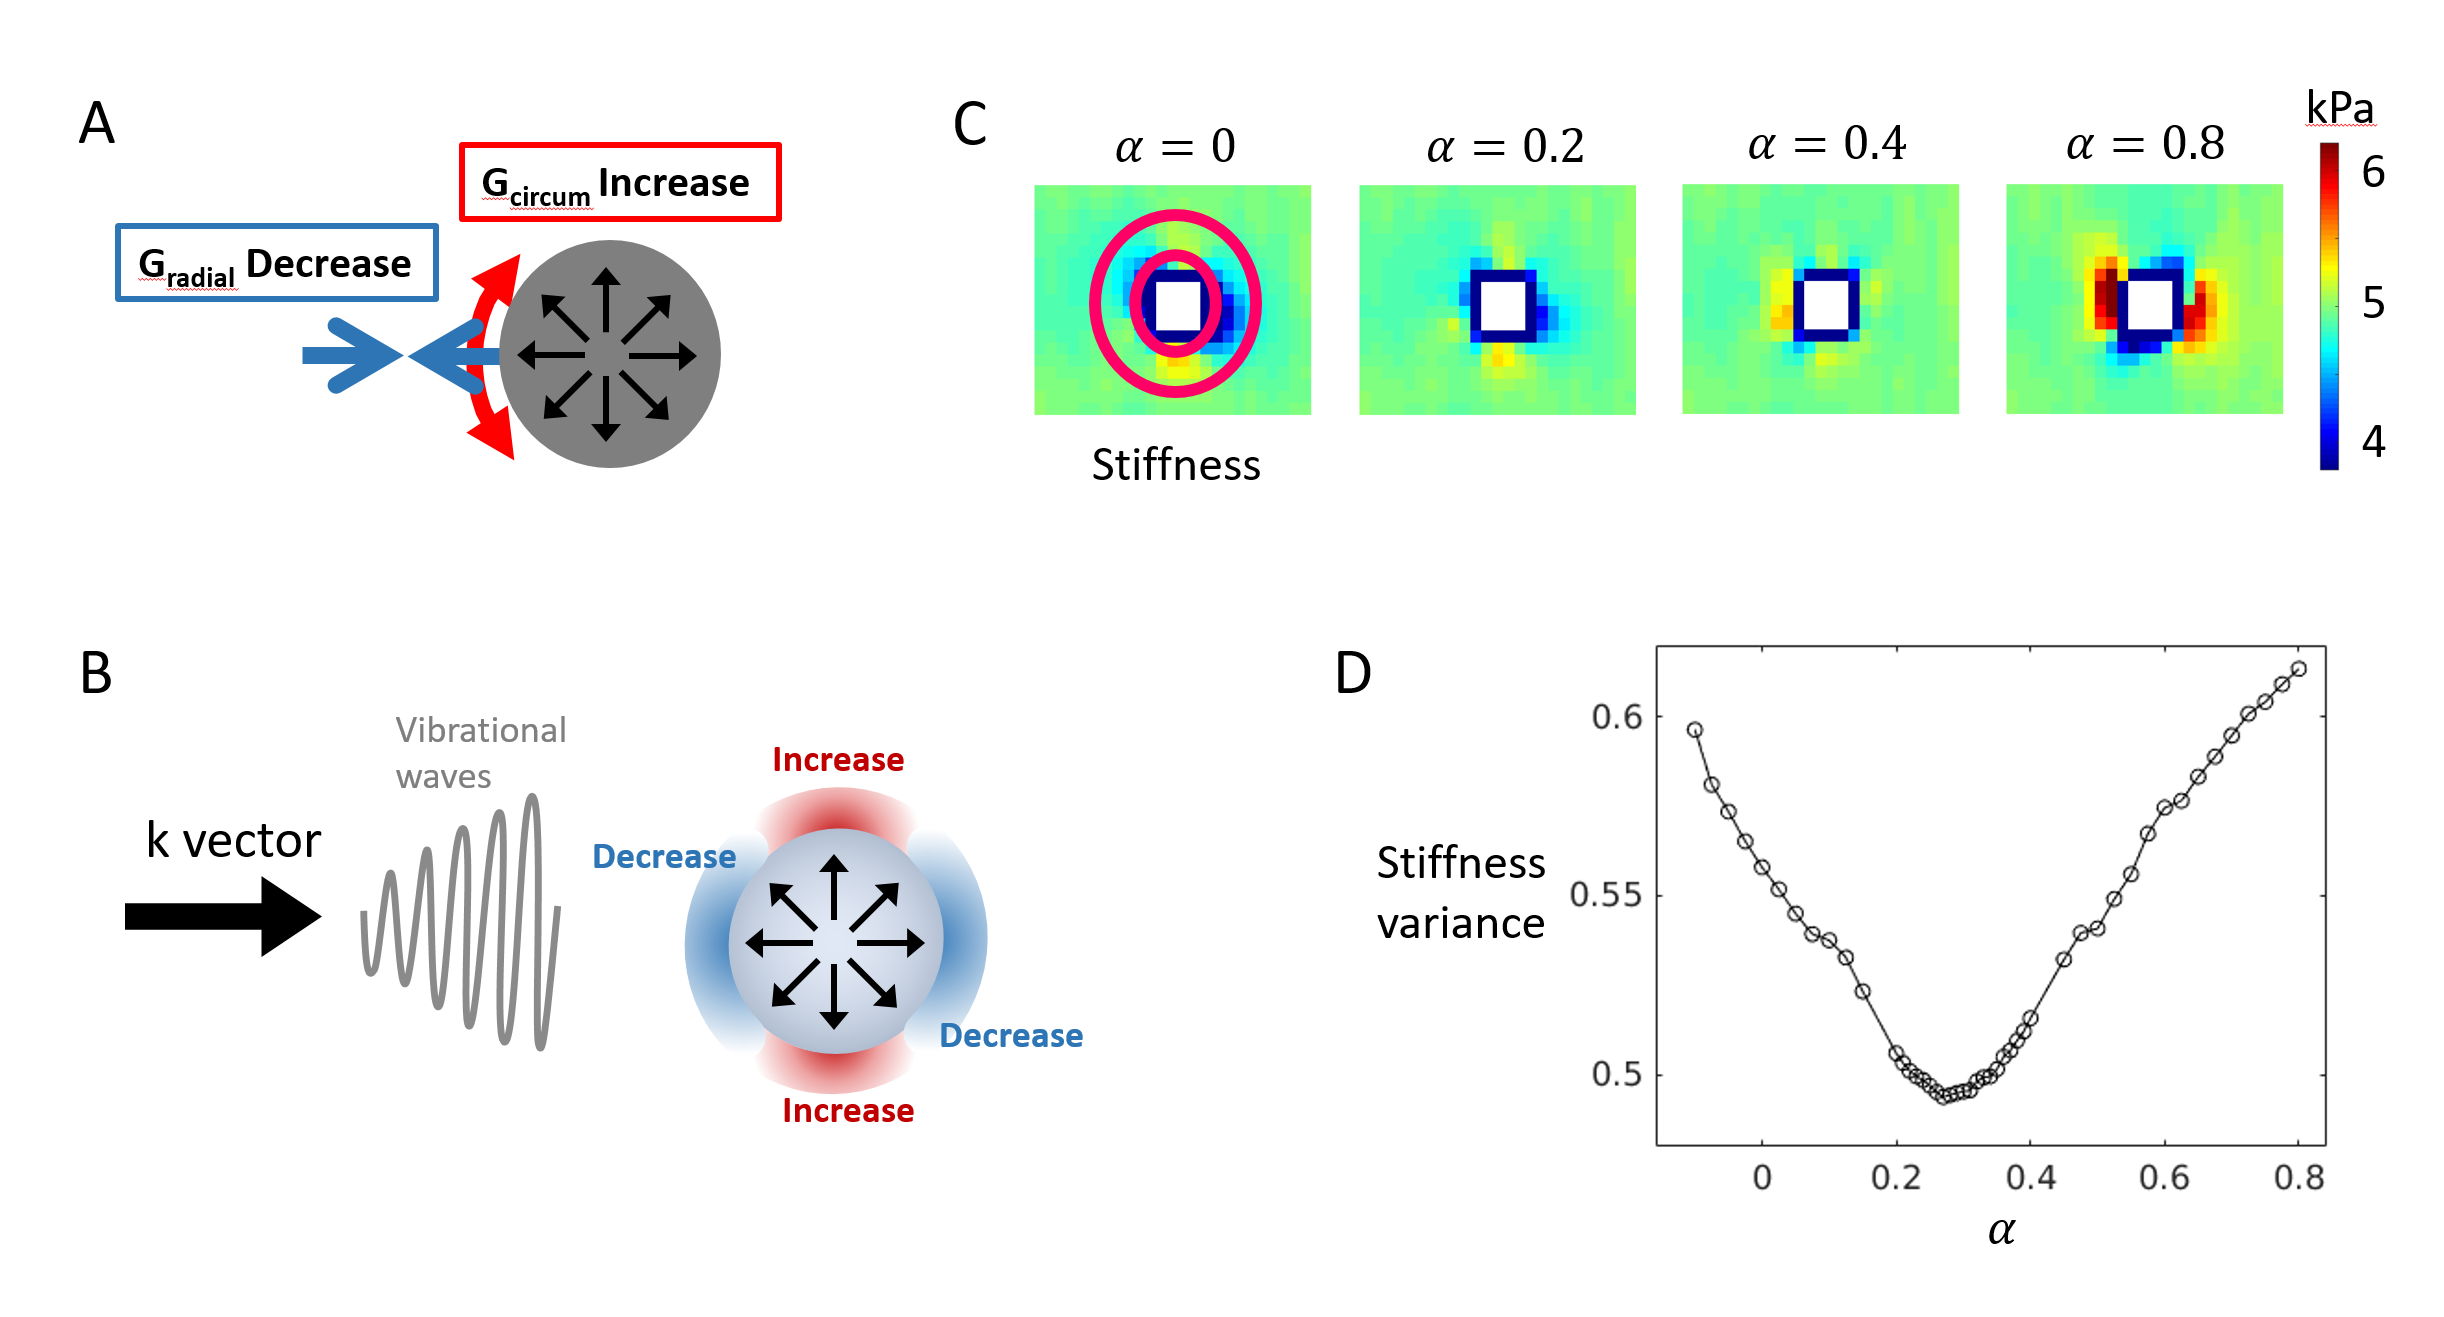
A pressurized tumor deforms nearby tissue. Due to nonlinear mechanical properties of tissue this deformation leads to characteristic changes in stiffness (Figure 1), quantifiable by MRE3. The pressure reconstruction method assumes an incompressible spherical deformation caused by the pressurized tumor. Various scalings of this deformation, defined by a contraction parameter $$$\alpha$$$, are formed, where $$$\alpha=0$$$ corresponds to no inflation (zero pressure) and $$$\alpha=1$$$ corresponds to collapse to a point. A macroscopic deformation field impacts the measured wave field and consequently the reconstructed elasticity distribution5. This is accounted for via a scaling of the strain tensor assuming some non-linear material law6. Different values of $$$\alpha$$$ yield different elasticity distributions, as in the numerical example (Figure 1), where the pattern for $$$\alpha=0.8$$$ even reverses its polarity. This indicates that some $$$\alpha$$$ will give a minimum in elasticity variance. This minimum corresponds to the $$$\alpha$$$ that deflates the object to zero pressure, which can be converted to inflation pressure via an analytic formula assuming a non-linear material law4.
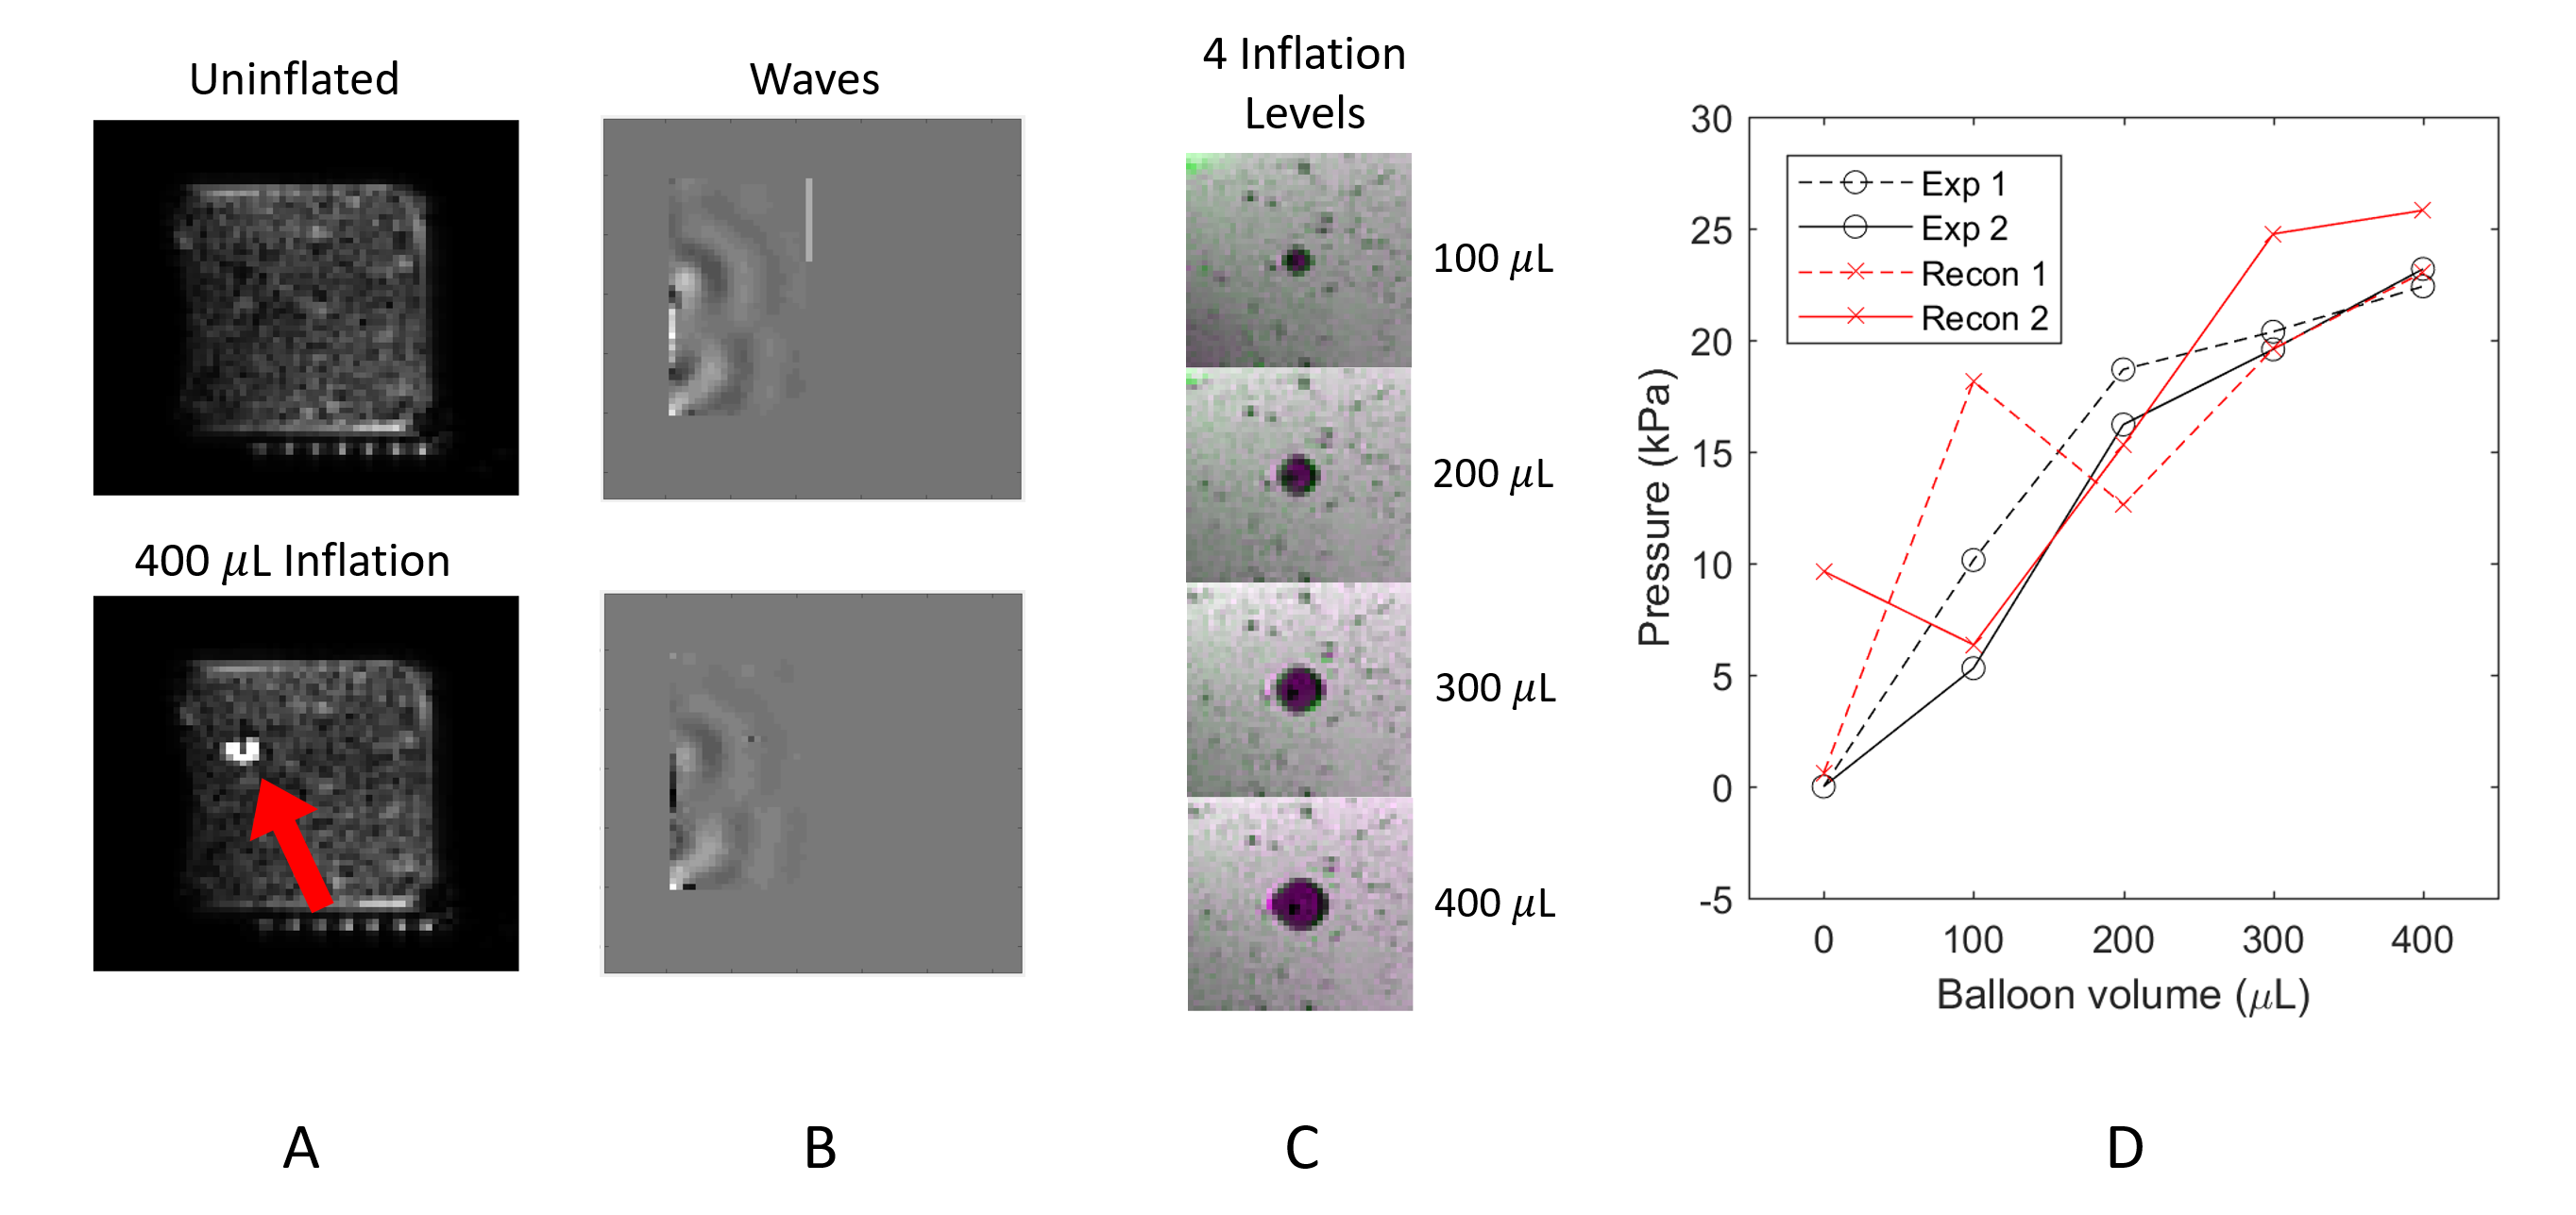
Phantom MRE experiments were performed in which a catheter balloon was inflated with water inside a plastisol block. Pressure values were reconstructed and directly measured for five levels of inflation (including no inflation) in two equivalent experiments with a neo-Hookean material law assumption.
There is evidence that breast tissue is best described by an exponential material law7
$$W=\frac{G}{2\gamma}(\mathrm{exp}(\gamma(I_{\hat{C}}-3))-1)$$
where $$$W$$$ is the strain energy, $$$G$$$ is the linearized background stiffness, $$$\gamma$$$ is the nonlinear material parameter, and $$$I_{\hat{C}}$$$ is the isochoric first invariant. The reconstruction assumes $$$\gamma=3$$$ and solves for $$$G$$$ at every voxel accounting for the spherical deformation via $$$I_{\hat{C}}$$$. For each patient case, the lesion location and size were determined from magnitude and gadolinium-enhanced images. Control points were also selected for each case. Of the 16 cases presented, one is a fibroadenoma and 15 are malignant lesions. From the latter, 5 show LVI from histology.
Results
The numerical example (Figure 1) shows a minimum at $$$\alpha=0.27$$$ which is the correct value and leads to a pressure of 4.5 kPa assuming neo-Hookean material. Reconstructed pressures for the phantom experiments are shown in Figure 2 and for higher inflation levels the average reconstructed pressure from the 2 experiments is within 15% of the measured values.
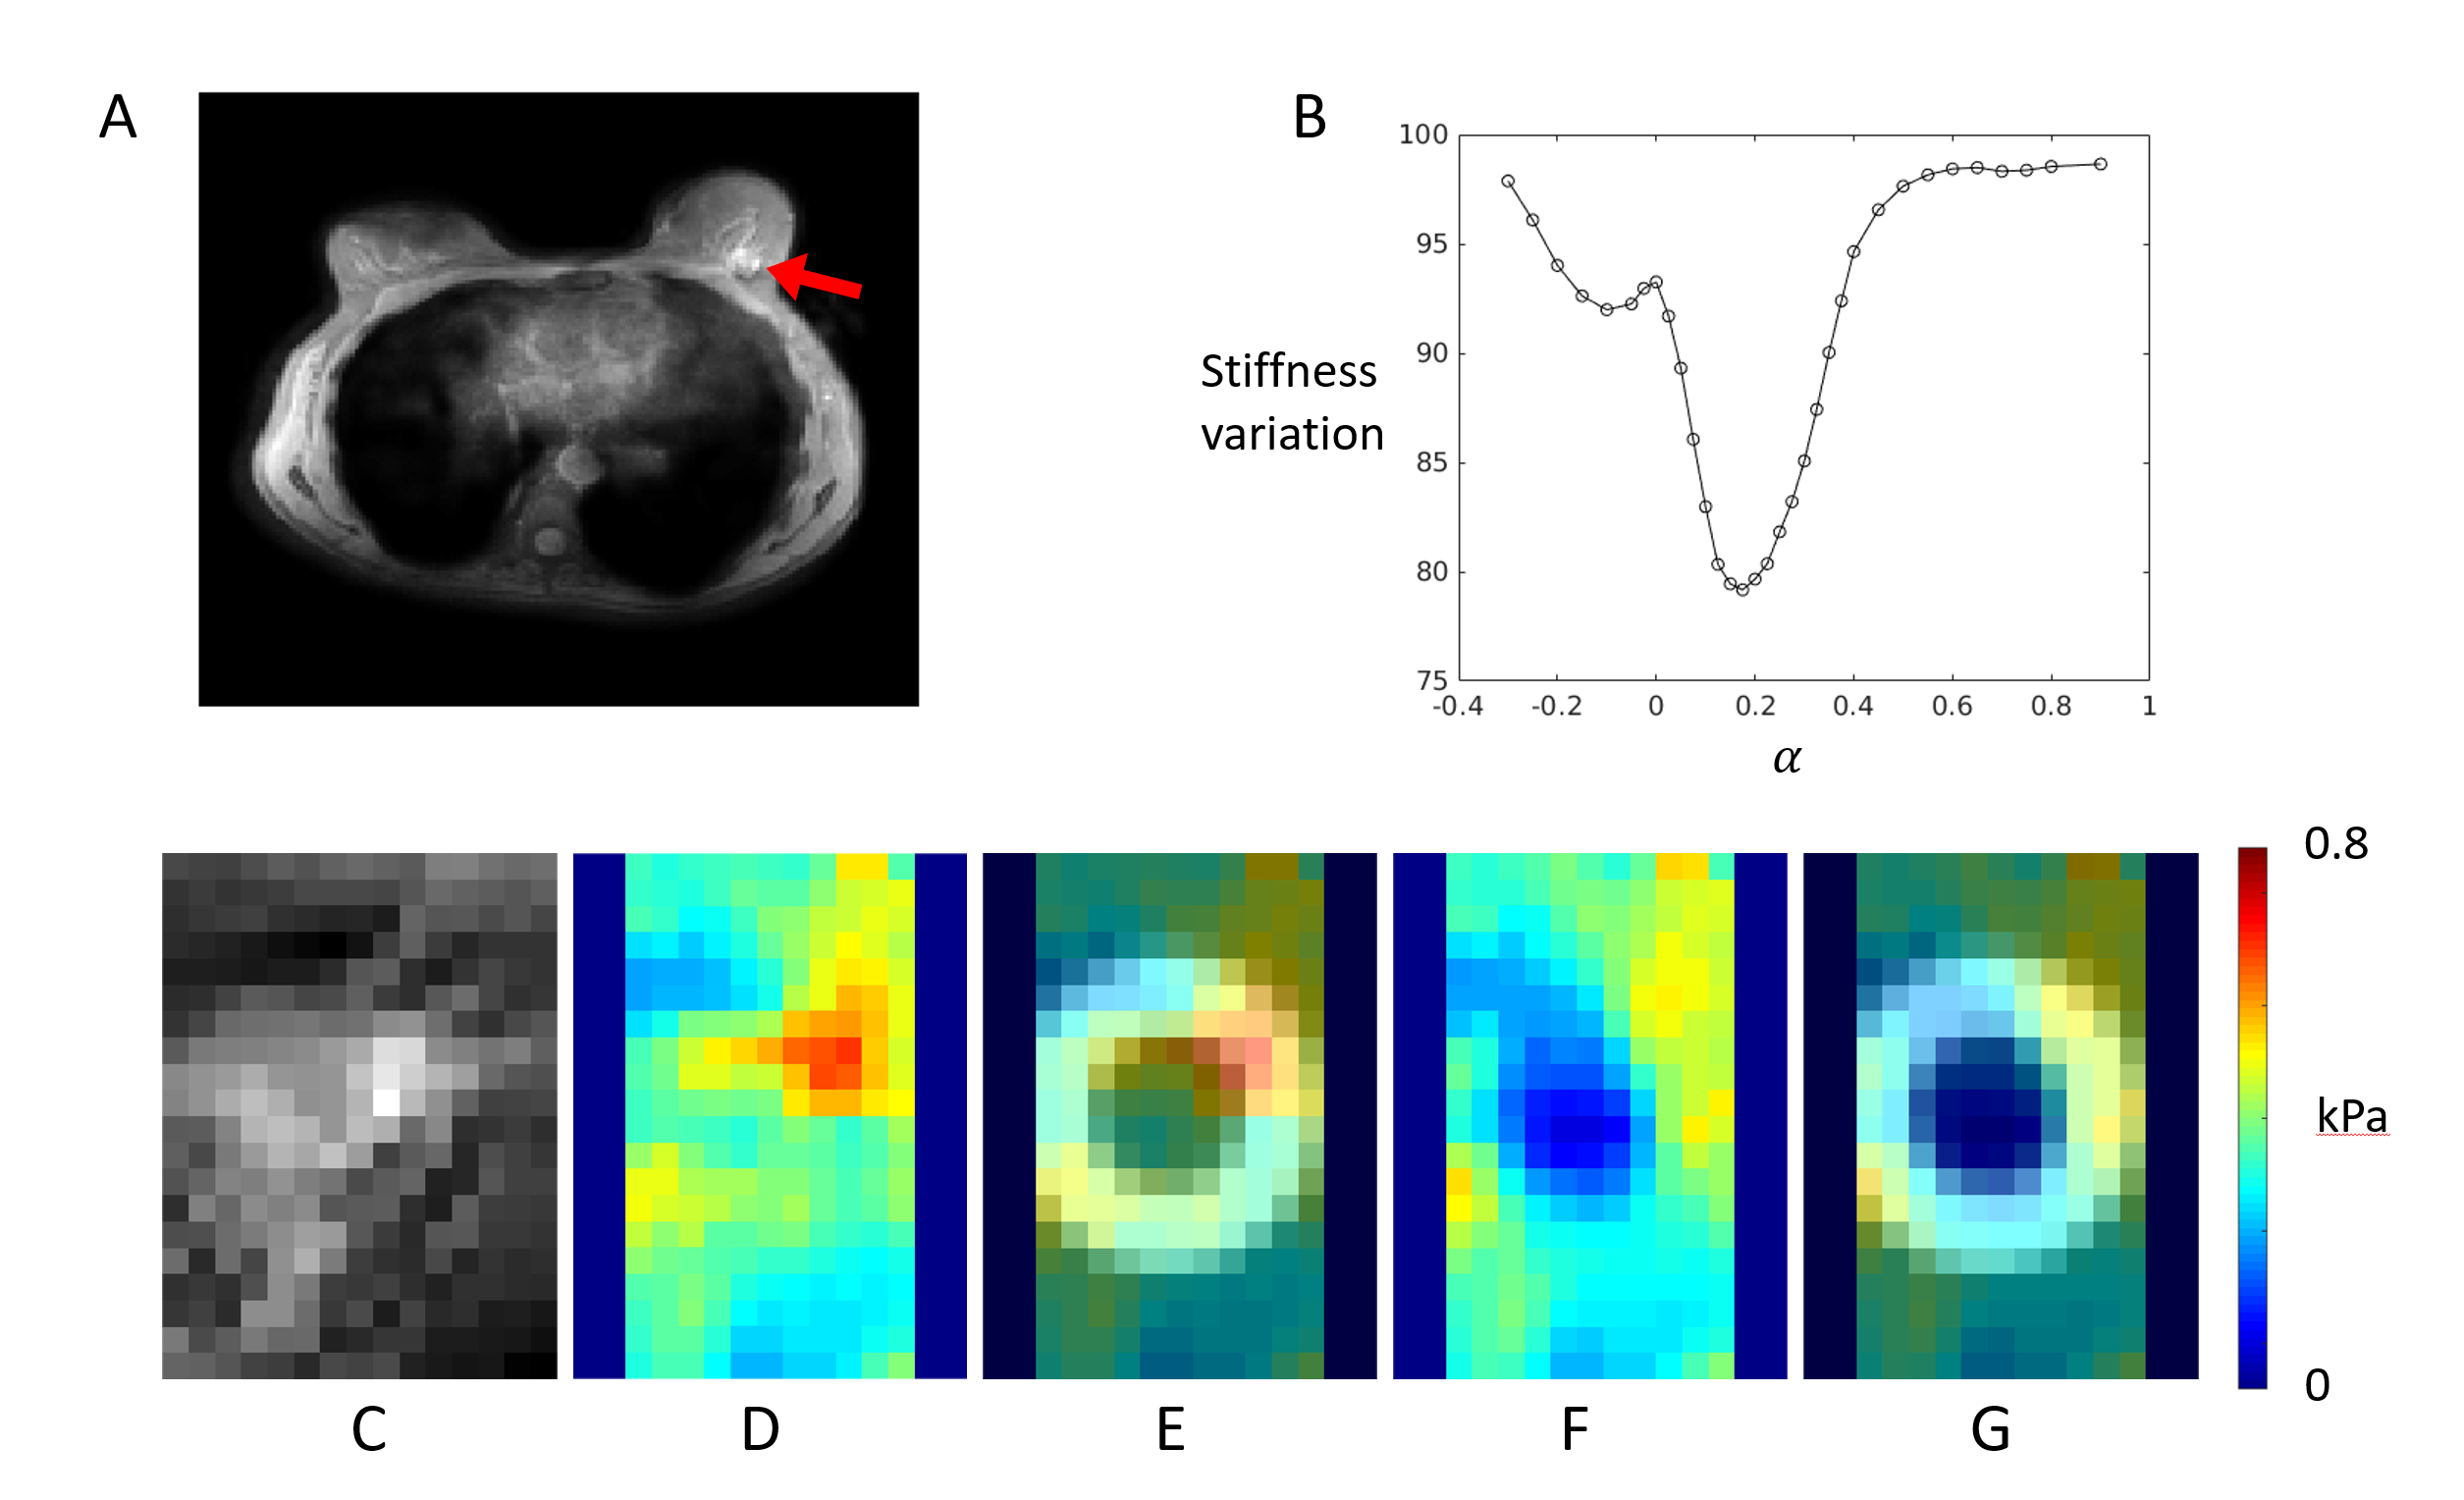
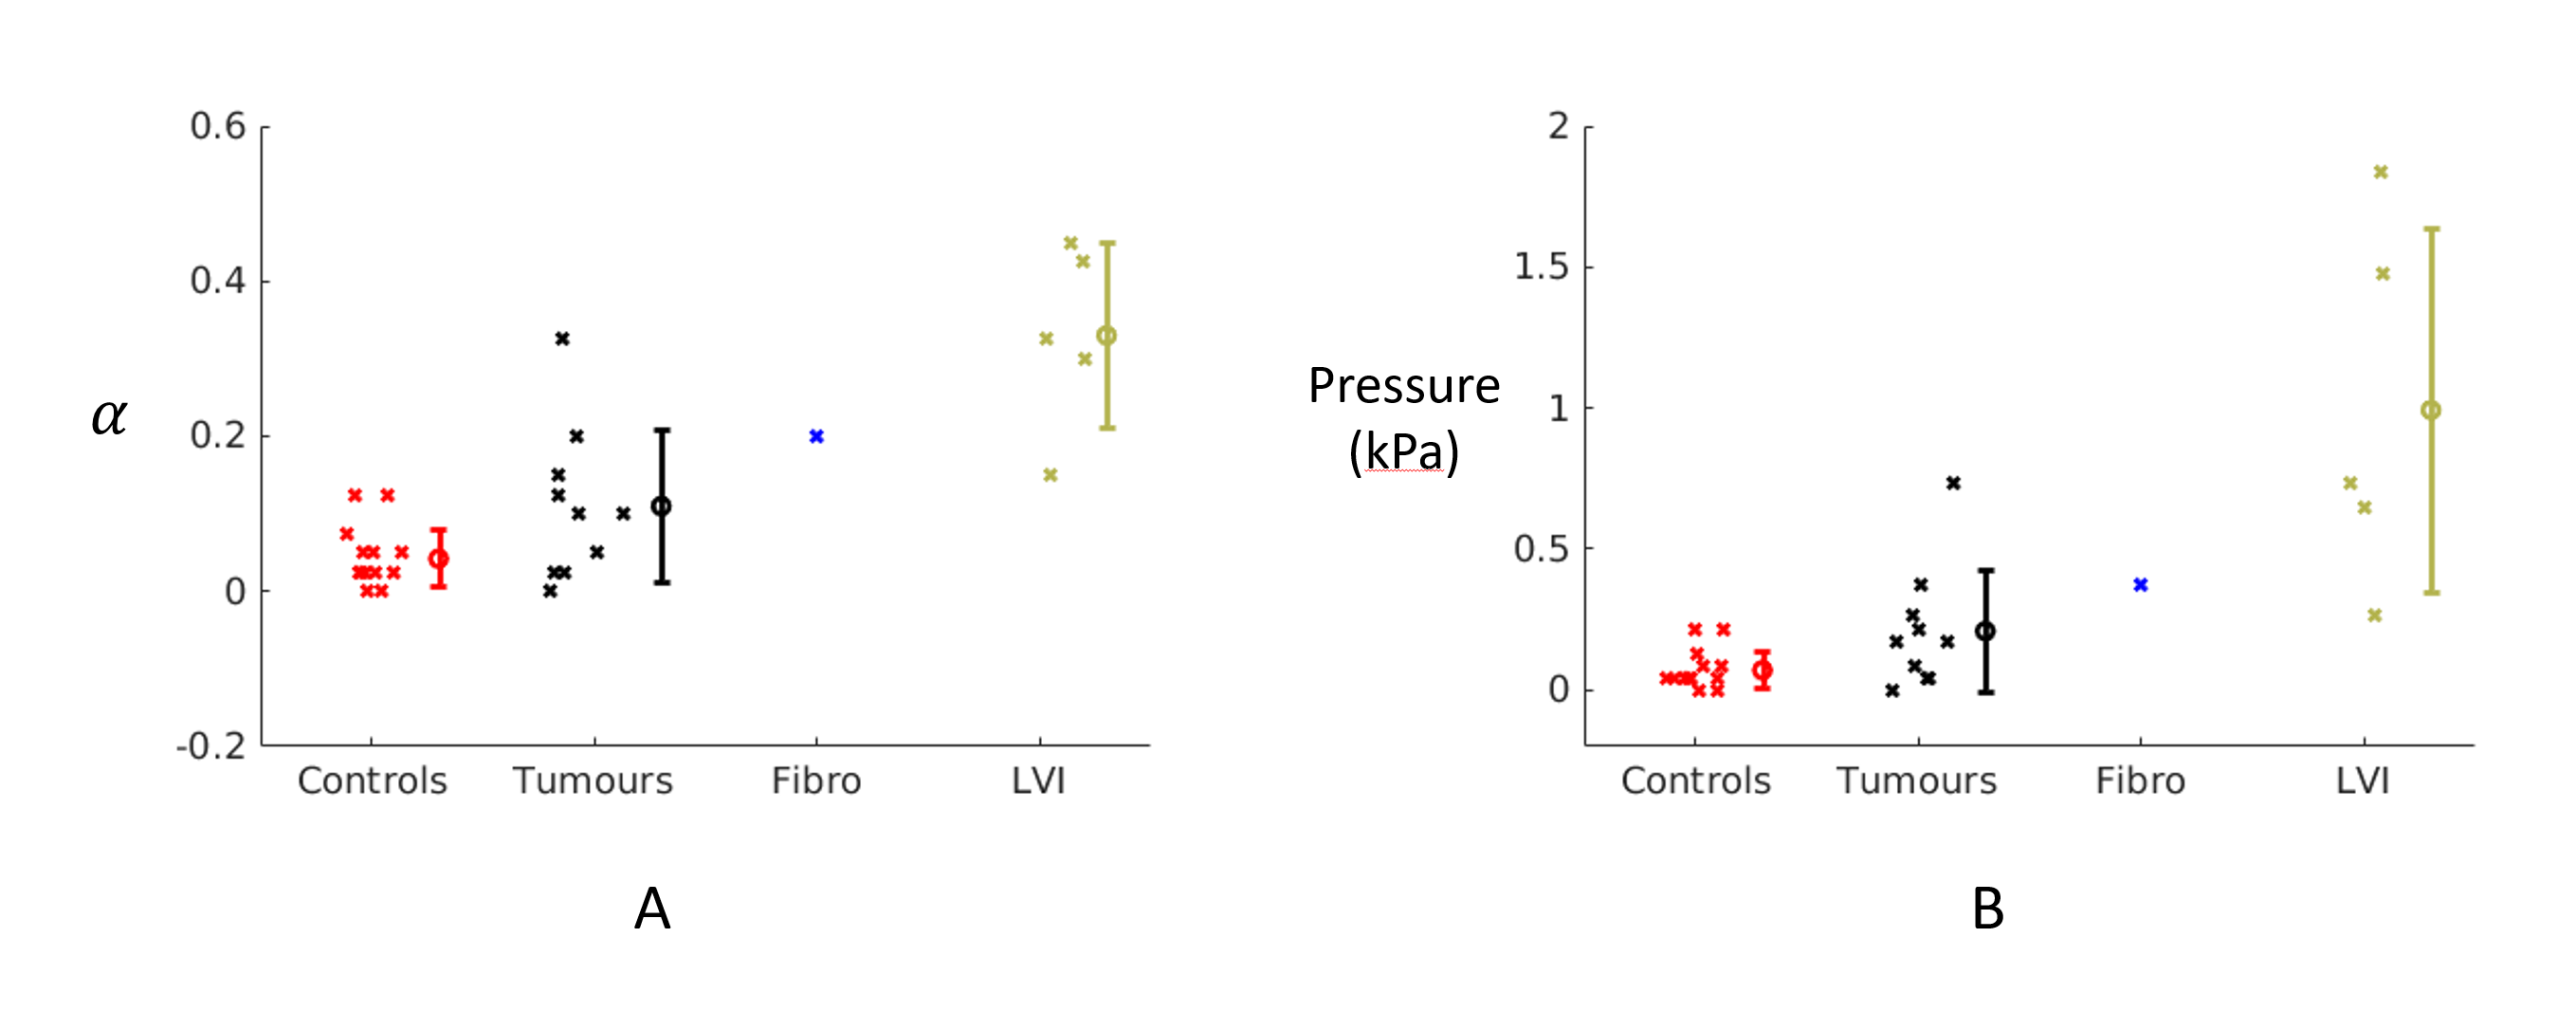
Figure 3 shows one example breast result. Figure 4 shows the reconstructed alpha and pressure values for all breast cancer data. The control points give consistently near-zero pressure (mean = 0.07 kPa). The non-LVI tumor cases show a higher mean (mean = 0.21 kPa) than the control points and more variability. The one fibroadenoma shows a pressure of 0.37 kPa. The 5 LVI show significantly (p<0.05) higher α than the other tumors and a mean pressure of 0.99 kPa.
Discussion & Conclusions
The pressure reconstruction is validated on simulation data and shows good correlation with measured pressure in phantom experiments at various inflations. Non-LVI breast cancer cases show raised mean pressure and more variability than controls but are not well separated statistically. The fibroadenoma pressure is near reported values8. The mean of the LVI cases is lower than reported values8,9 but some cases approach 2 kPa, closer to expected. The LVI cases show the highest pressure and are well separated from the other tumor cases. This indicates that pressure reconstruction via MRE may be an avenue towards gauging metastatic propensity noninvasively. This could have direct and major impacts on patient pathway, i.e. operation or neoadjuvant chemotherapy first.Acknowledgements
This project has received funding from the European Union’s Horizon 2020 research and innovation program under grant agreement No 668039.References
1. Heldin C H, Rubin K, Pietras K, Östman A. High interstitial fluid pressure - an obstacle in cancer therapy. Nature reviews. Cancer 4, 806-813, doi:10.1038/nrc1456 (2004).
2. Munson J M, Shieh A C. Interstitial fluid flow in cancer: implications for disease progression and treatment. Cancer management and research 6, 317-328, doi:10.2147/CMAR.S65444 (2014).
3. Fovargue D, Lee J, Capilnasiu A, Fiorito M, Nordsletten D, Sinkus R. Using non-linear tissue biomechanics to infer static forces within tissue: towards quantifying IFP, ISMRM 2017, #0973
4. Fovargue D, Lee J, Fiorito M, Capilnasiu A, Sethi S, Hoelzl S, Runge J H, de Arcos J, Purushotham A, Satchithananda K, Nordsletten D, Sinkus R. Non-linear Mechanics Allows Non-invasive Quantification of Interstitial Fluid Pressure, ISMRM 2018, #2879
5. Fovargue D, Kozerke S, Sinkus R, Nordsletten D. Robust MR elastography stiffness quantification using a localized divergence free finite element reconstruction. Medical image analysis 44 (2018): 126-142.
6. Capilnasiu A, Hadjicharalambous M, Fovargue D, Patel D, Holub O., Bilston L, Screen H, Sinkus R, Nordsletten D. Magnetic Resonance Elastography in Nonlinear Viscoelastic Materials Under Load. Biomechanics and modeling in mechanobiology (2018): 1-25.
7. Wellman P, Howe R D, Dalton E, Kern K A. Breast tissue stiffness in compression is correlated to histological diagnosis. Harvard BioRobotics Laboratory Technical Report (1999): 1-15.
8. Nathanson S D, Nelson L. Interstitial fluid pressure in breast cancer, benign breast conditions, and breast parenchyma. Annals of surgical oncology (1994): 1(4), 333-338.
9. Less J R, Posner M C, Boucher Y, Borochovitz D, Wolmark N, Jain R K. Interstitial hypertension in human breast and colorectal tumors. Cancer research (1992): 52(22), 6371-6374.
Figures