0192
Model-free denoising of multi b-value diffusion-weighted MR images using principal component analysis: simulations and in vivo results1The Institute of Cancer Research and the Royal Marsden NHS Foundation Trust, London, United Kingdom, 2Cancer Research UK Cancer Imaging Centre, The Institute of Cancer Research and the Royal Marsden NHS Foundation Trust, London, United Kingdom, 3Cancer Center Amsterdam, Amsterdam UMC, University of Amsterdam, Amsterdam, Netherlands
Synopsis
We present a principal component analysis (PCA) toolkit for mode-free denoising of multi b-value diffusion-weighted images for clinical use. In simulations, PCA-denoising suppressed the random noise equally well (up to 55%) as synthetic MRI. Contrary to synthetic MRI (systematic error up to 29% of total signal intensity), PCA-denoising did not introduce any systematic errors (<2%). In volunteer and patient image data, PCA-denoising resulted in sharper and less noisy images than synthetic MRI, which resulted in sharper and clearer tumour boundaries. In conclusion, our PCA-denoising toolkit is promising for denoising b-value images for clinical use.
Introduction
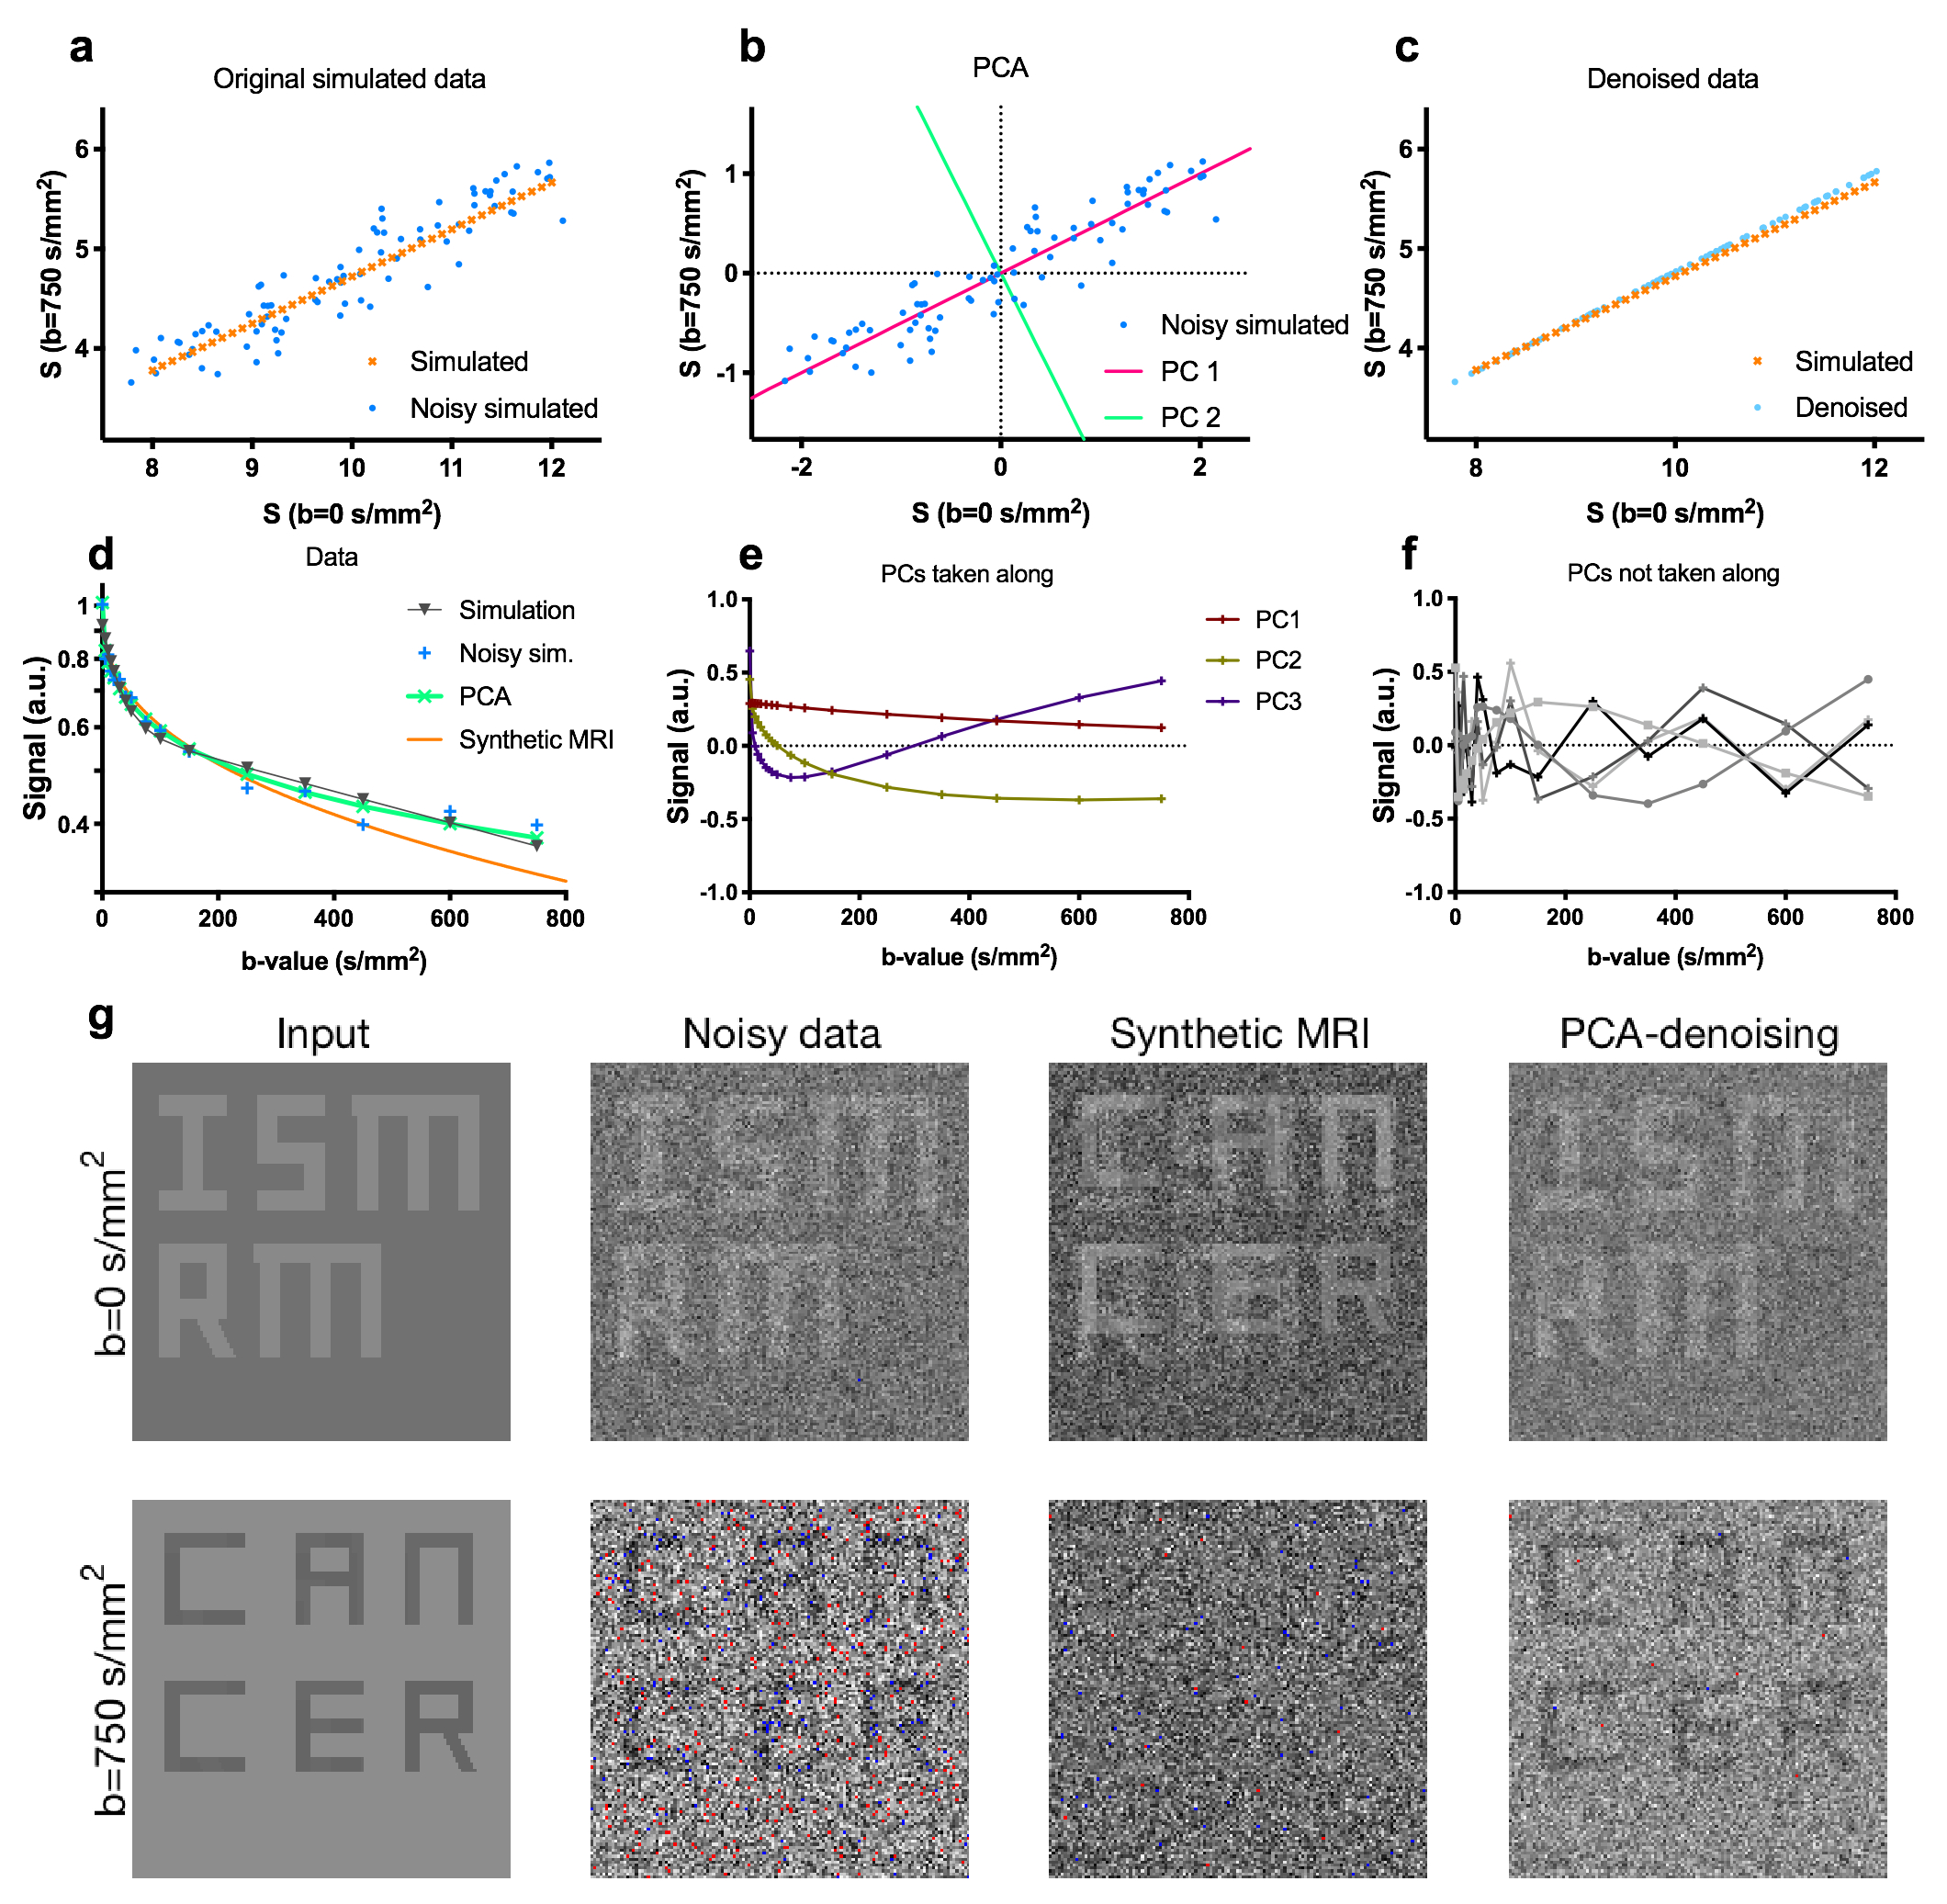
Multi b-value diffusion-weighted MRI (DWI), such as intravoxel incoherent motion imaging, is often used for quantifying tissue properties relevant to lesion characterisation and treatment response monitoring1–6. However, for many clinical tasks, such as delineating tumours, images acquired at the highest b-value are preferred for their high tumour to background contrast. These high b-value images suffer from poor SNR3 and would benefit from denoising. One way of denoising these images is using synthetic MRI. In synthetic MRI, a diffusion model is fitted for each voxel and a denoised image at a given b-value is generated from the model fit. However, this approach is model-dependent and can cause systematic errors that obscure relevant lesions (Fig.1g). Here, we present a principal component analysis (PCA) approach that uses data sharing across all acquired b-values for model-free denoising.Methods
PCA converts potentially correlated observations, into linearly uncorrelated orthogonal vectors, called principal components (PCs), and their corresponding weights7. The first PC is aligned with the axis of most variation, and each subsequent PC along the axis of largest remaining variation. For our implementation of PCA-denoising, signal intensities at different b-values and from repeated measures are treated as the observations. PCA then returns a set of dataset-specific PCs (equal to the number of b-values/repeats), and the weights per PC for each voxel required to reconstruct the original signal. As DWI-related signal-decay occurs similar throughout the images, whereas noise is random, diffusion-related effects are described by the initial PCs. Hence, DW-images were denoised model-free by using only the initial PCs and weights (Fig.1).
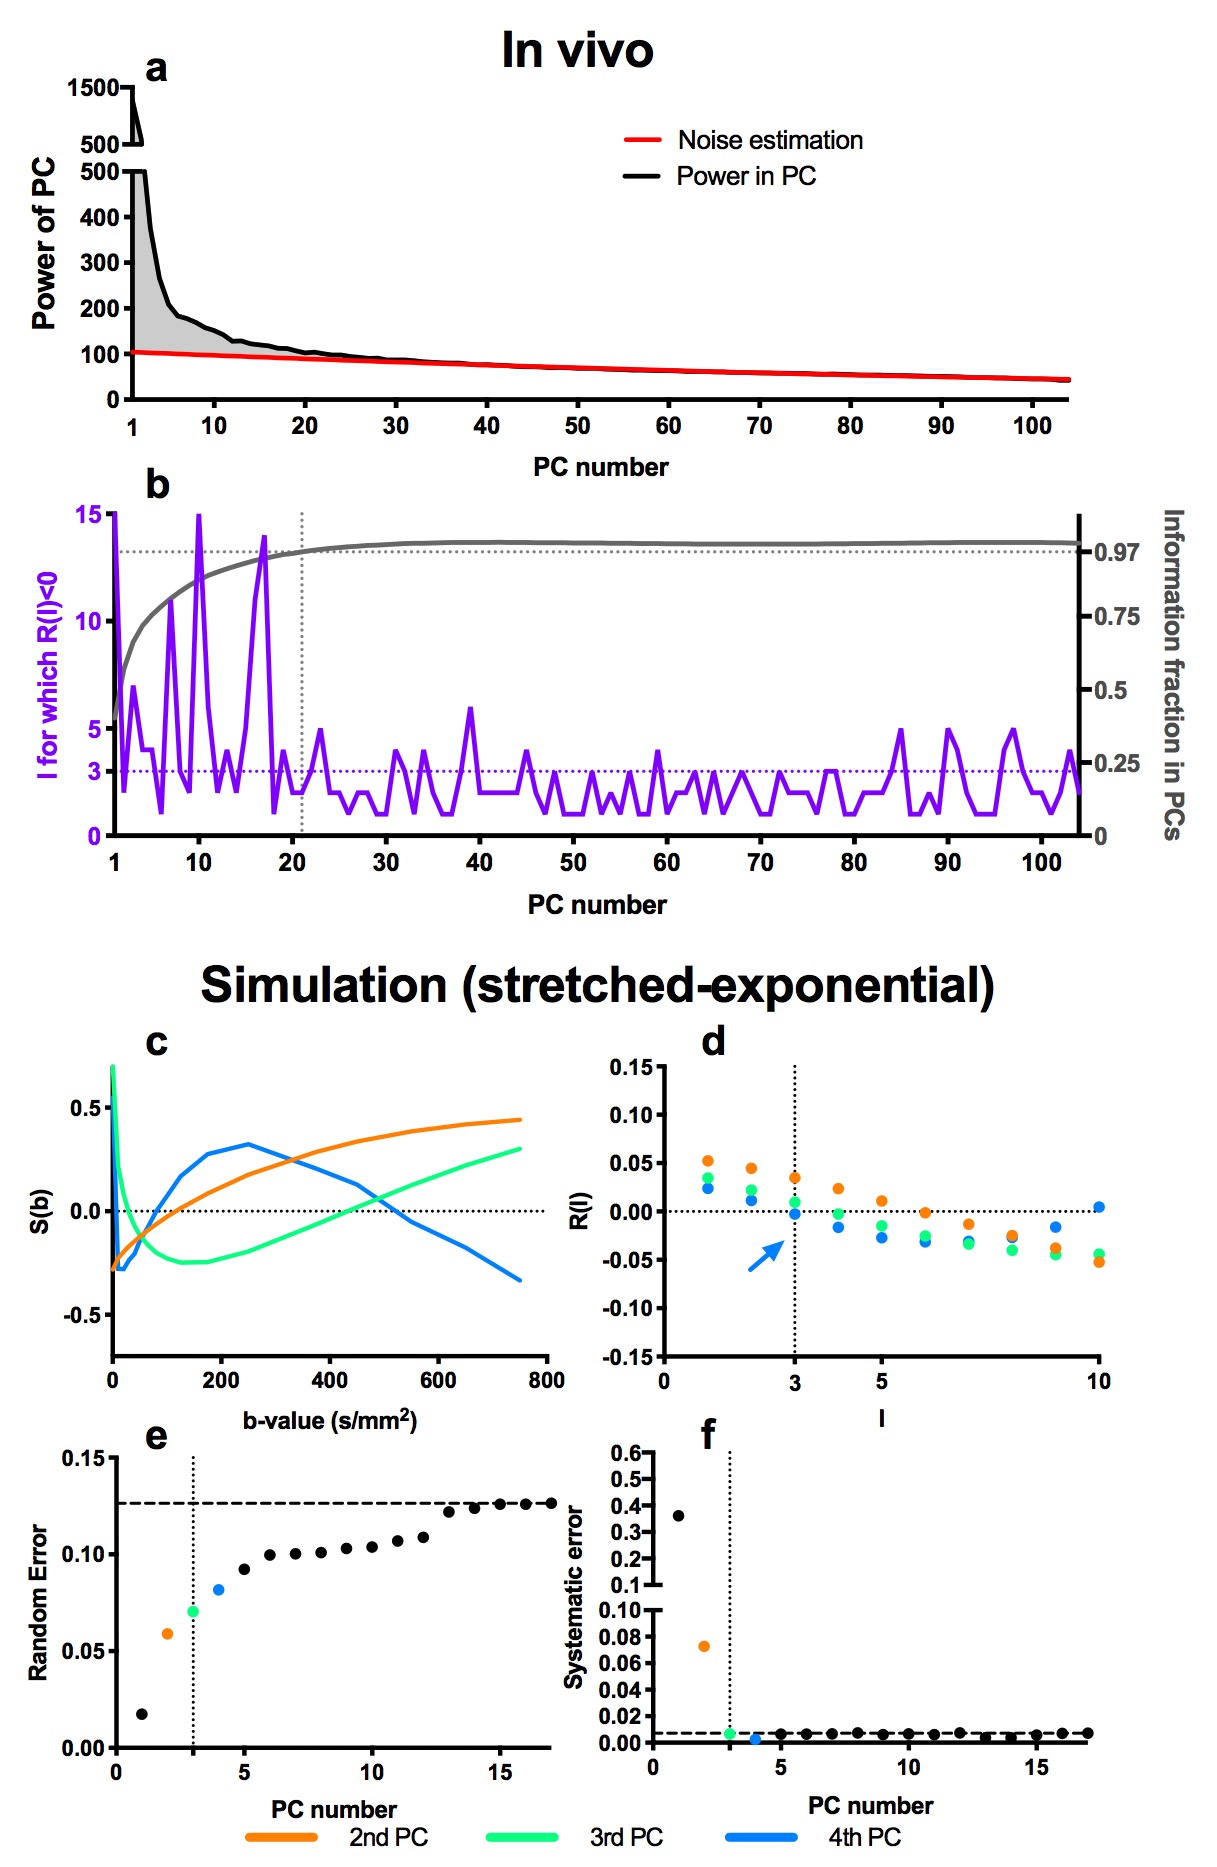
To achieve denoising, the informative PCs need to be separated from the PCs containing noise. First, we aimed at including >97% of the diffusion information into the reconstruction (Fig.2a,b). The mean of the absolute of the PC weights (the PC's power) was plotted per PC (Fig.2a). As later PCs only contain noise, the noise contribution from all PCs was estimated by fitting a 2nd order polynomial to the power of the highest 2/3 PCs (red curve) and subtracted from the power. The remaining curve, representing the informative signal, was integrated and normalized (Fig 2b, grey curve). The PCs up to which this curve reached 97% of all information were included.
After including 97% information, we assess the autocorrelation function of the remaining PCs. Signal decay as function of b-values is a smooth process and hence PCs with at least a positive autocorrelation function up to a delay of three were considered informative. Hence, after selecting 97% information, PCs up to the first PC that did not his constraint were included. Figs 2c,d show that for the simulated case, in which we know the resulting error (Fig 2e,f), our selection procedure resulted in minimizing the systematic error, with acceptable random error.
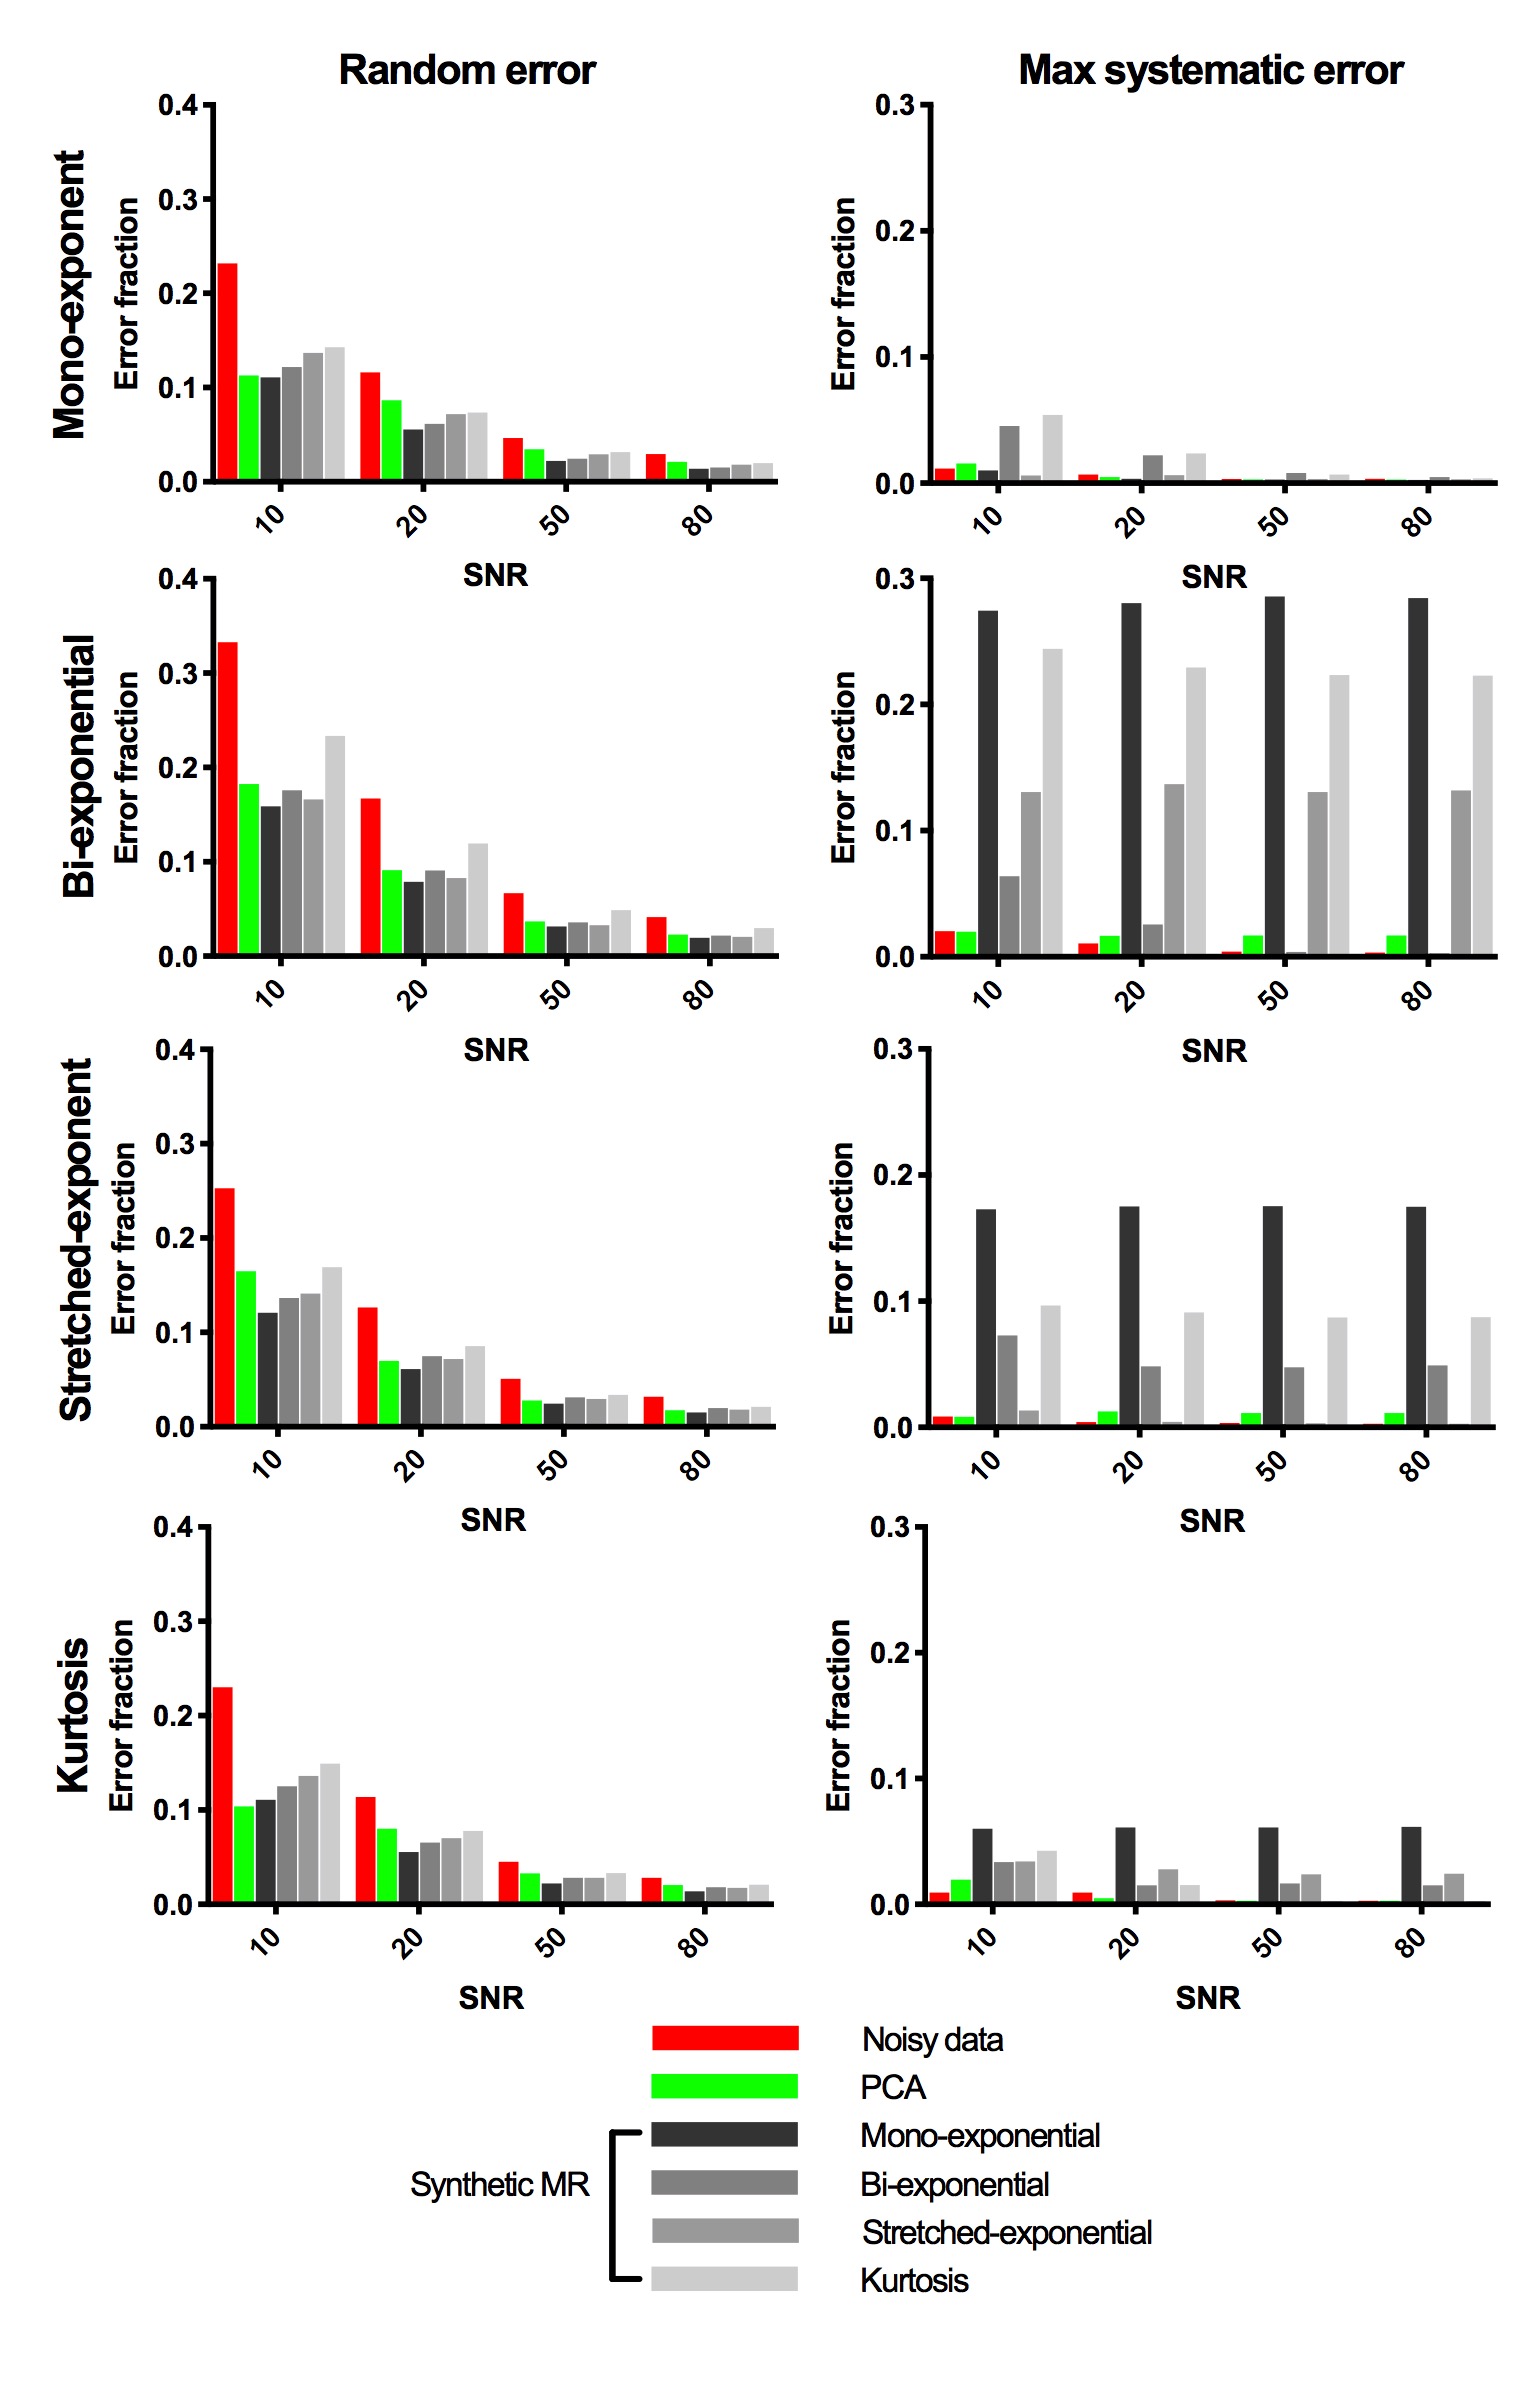
PCA-denoising was compared to several synthetic MRI approaches (mono-exponential, bi-exponential8, stretched-exponential9 and kurtosis10 models). Both approaches were compared in several simulated datasets (same four models; four SNR levels: 10, 20, 50 and 80), in which nine regions with distinct diffusion parameters were simulated and denoised11. This allowed for quantifying systematic and random errors. The performance of PCA-denoising and synthetic MRI was also compared in six healthy volunteers and three pancreatic cancer patients.
Results
In simulations, PCA-denoising reduced the random error substantial, by up to 55%, without adding any systematic error (<2%), as shown in Fig.3. Synthetic MRI had similar amount of reduction in random error (up to 53%), but this came at the expense of potentially introducing systematic errors (up to 29% of the signal intensity).
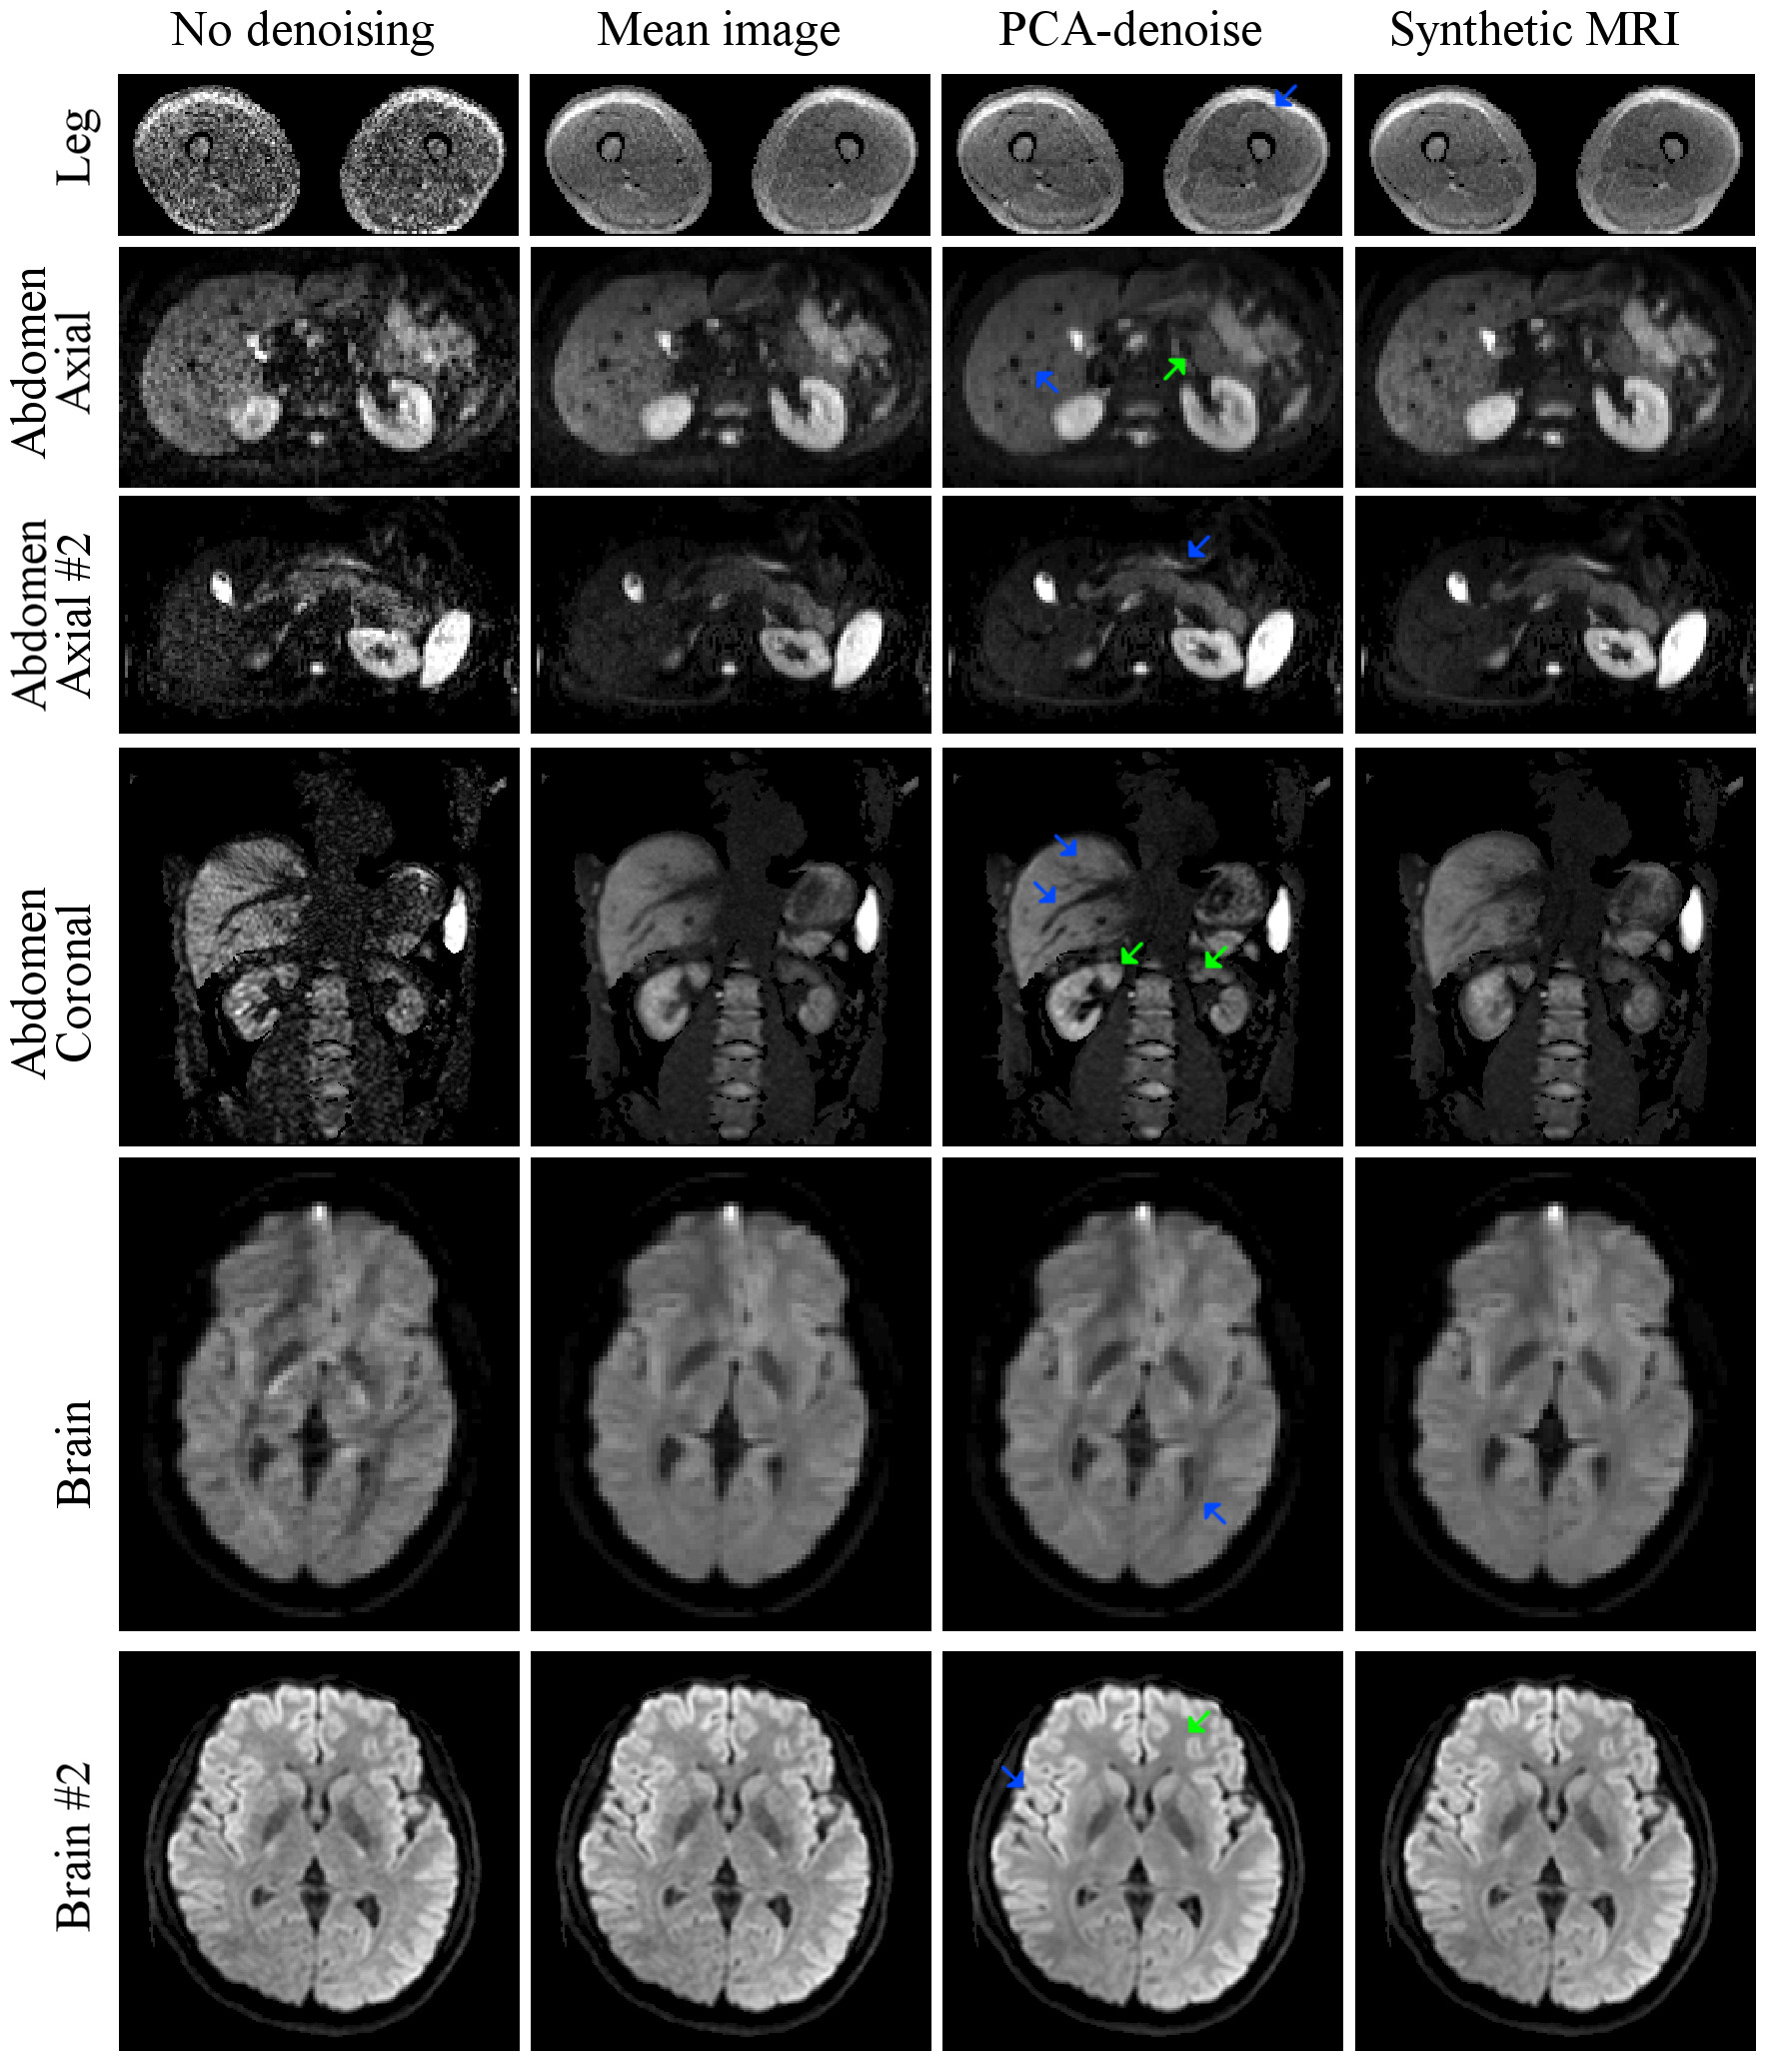
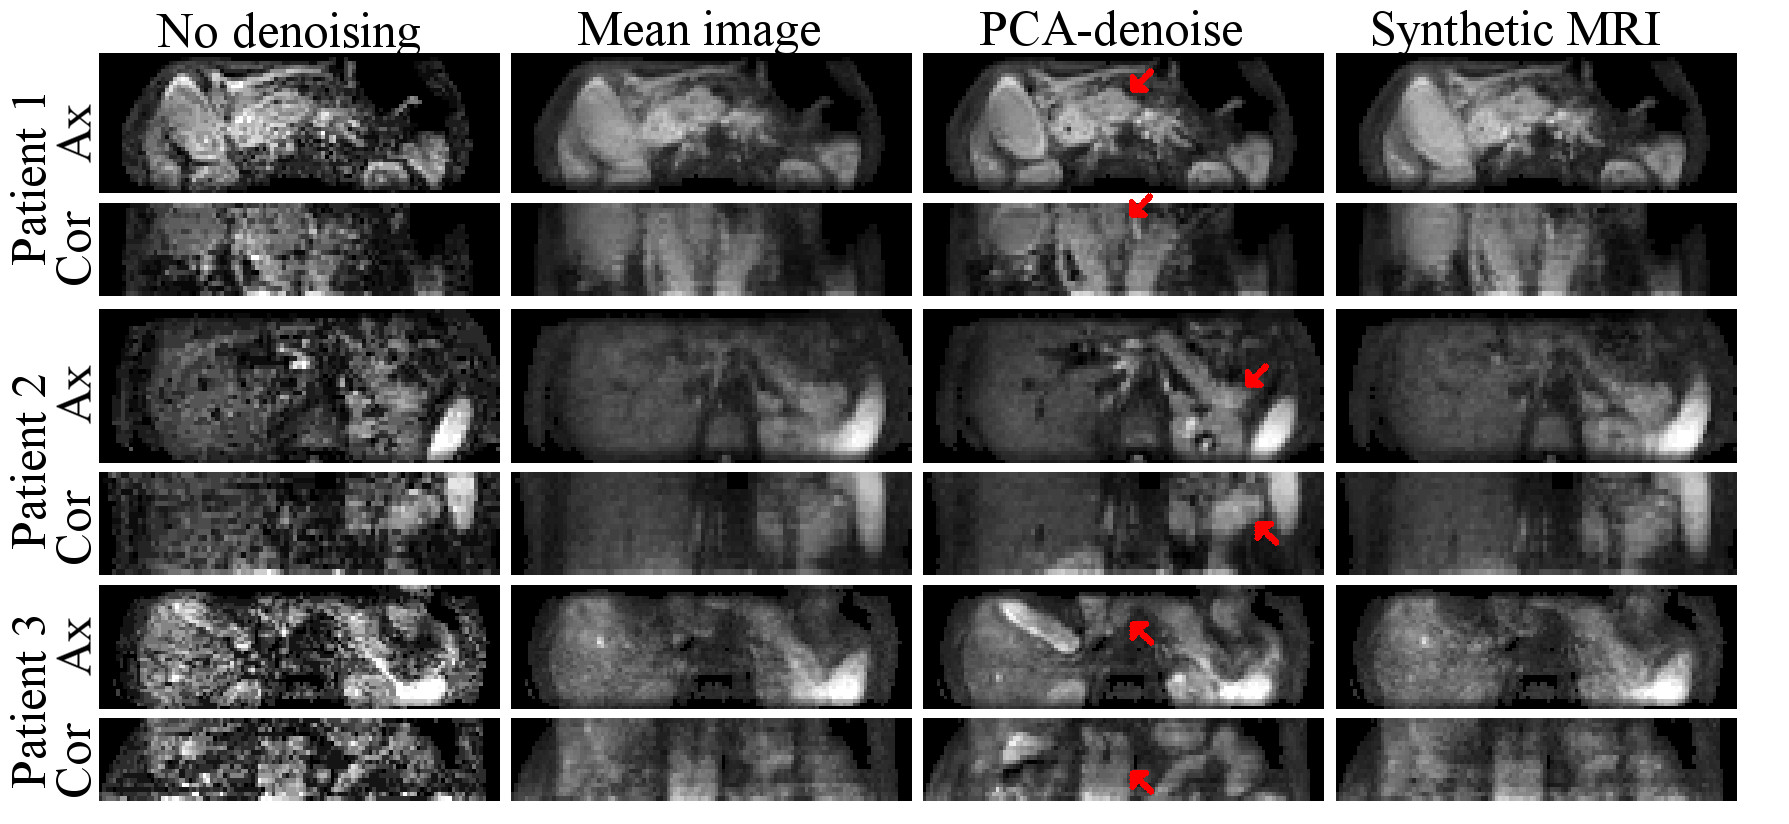
In vivo PCA-denoising resulted in sharper and less noisy images than synthetic MRI (Fig.4). This resulted in sharper and clearer tumour boundaries (Fig.5). Interestingly, contrary to synthetic MRI, PCA-denoising did not cause image blurring in the presence of motion.
Discussion
In contrast to literature12–15, we tailored PCA-denoising with the intention of improving image quality for diagnostic purposes, and evaluated its performance accordingly. PCA-denoising was able to denoise images as least as well as synthetic MRI, without assuming any model and without adding systematic error. Synthetic MRI added substantial systematic errors, particularly when the model was different from the model used for simulating the data. This reflects in vivo data for which the underlying model is unknown. Furthermore, in the presence of motion, PCA-denoising resulted in sharp images, suggesting PCA models some motion too.
Conclusion
PCA-denoising allows for model-free denoising of multi b-value DWI data. PCA-denoising reduces noise to a level similar to synthetic MRI, but without introducing systematic errors and without blurring the image in the presence of motion.Acknowledgements
This work was supported by Cancer Research UK Programme Grants C33589/A19727 and C7224/A23275 and the Dutch Cancer Society (UVA2013-5932). CRUK and EPSRC support to the Cancer Imaging Centre at ICR and RMH in association with MRC and Department of Health C1060/A10334, C1060/A16464 and NHS funding to the National Institute for Health Research (NIHR) Biomedical Research Centre and the Clinical Research Facility in Imaging. This report represents independent research funded partially by the NIHR Biomedical Research Centre at the Royal Marsden NHS Foundation Trust and the Institute of Cancer Research. The views expressed in this publication are those of the author(s) and not necessarily those of the NHS, the National Institute for Health Research or the Department of Health.References
1. Koh D-M, Collins DJ, Orton MR. Intravoxel incoherent motion in body diffusion-weighted MRI: reality and challenges. AJR. Am. J. Roentgenol. 2011;196(6):1351–1361.
2. Gaing B, Sigmund EE, Huang WC, et al. Subtype differentiation of renal tumors using voxel-based histogram analysis of intravoxel incoherent motion parameters. Invest. Radiol. 2015;50(3):144–152.
3. Koh D-M, Collins DJ. Diffusion-weighted MRI in the body: Applications and challenges in oncology. Am. J. Roentgenol. 2007;188(6):1622–1635.
4. Barral M, Taouli B, Guiu B, et al. Diffusion-weighted MR imaging of the pancreas: Current status and recommendations. Radiology. 2015;274(1):45–63.
5. Klaassen R, Gurney-Champion OJ, Engelbrecht MRW, et al. Evaluation of Six Diffusion-weighted MRI Models for Assessing Effects of Neoadjuvant Chemoradiation in Pancreatic Cancer Patients. Int. J. Radiat. Oncol. Biol. Phys. 2018; Epub ahead of print: https://doi.org/10.1016/j.ijrobp.2018.04.064.
6. Park JJ, Kim CK, Park SY, et al. Assessment of early response to concurrent chemoradiotherapy in cervical cancer: Value of diffusion-weighted and dynamic contrast-enhanced MR imaging. Magn. Reson. Imaging. 2014;32(8):993–1000.
7. Hotelling H. Analysis of a complex of statistical variables into principal components. J. Educ. Psychol. 1933;24(6):417–441.
8. Le Bihan D. Intravoxel incoherent motion imaging using steady-state free precession. Magn. Reson. Med. 1988;7(3):346–351.
9. Bennett KM, Schmainda KM, Bennett RT, et al. Characterization of continuously distributed cortical water diffusion rates with a stretched-exponential model. Magn. Reson. Med. 2003;50(4):727–734.
10. Jensen JH, Helpern JA, Ramani A, et al. Diffusional kurtosis imaging: the quantification of non-gaussian water diffusion by means of magnetic resonance imaging. Magn. Reson. Med. 2005;53(6):1432–1440.
11. While PT. A comparative simulation study of bayesian fitting approaches to intravoxel incoherent motion modeling in diffusion-weighted MRI. Magn. Reson. Med. 2017;78(6):2373–2387.
12. Pai VM, Rapacchi S, Kellman P, et al. PCATMIP: Enhancing signal intensity in diffusion-weighted magnetic resonance imaging. Magn. Reson. Med. 2011;65(6):1611–1619.
13. Chen N kuei, Chang HC, Bilgin A, et al. A diffusion-matched principal component analysis (DM-PCA) based two-channel denoising procedure for high-resolution diffusion-weighted MRI. PLoS One. 2018;13(4):1–19.
14. Spinner GR, Federau C, Schmidt JFM, et al. Enhancing intravoxel incoherent motion parameter mapping in the brain using k-b PCA. NMR Biomed. 2018; Epub ahead of print: https://doi.org/10.1002/nbm.4008.
15. Manjón J V, Coupé P, Concha L, et al. Diffusion Weighted Image Denoising Using Overcomplete Local PCA. PLoS One. 2013;8(9):1–12.
Figures