0095
Simultaneous Measurement of Myocardial and Blood Flow Velocities using a Dual Echo Dual Velocity Encoding (DEDV) Phase-Contrast MRI (PC-MRI) Approach for Evaluating Left Ventricular (LV) Diastolic Function1Department of Physics, University of Houston [Main Campus], Houston, TX, United States, 2Department of Diagnostic and Interventional Radiology, Baylor St. Luke's Medical Center, Houston, TX, United States, 3Philips Healthcare, Gainesville, FL, United States, 4Physics and Texas Center for Superconductivity, University of Houston [Main Campus], Houston, TX, United States
Synopsis
PC-MRI based Left ventricular (LV) diastolic indices such as E/Em ratio are conventionally estimated from two separate PC acquisitions: One sensitive to myocardium and the other to blood velocities. This ensures optimal velocity to noise ratio and zero velocity aliasing. A rapid single acquisition (dual echo dual VENC PC-MRI method) sensitive to both low and high velocities was developed. Preliminary result on 7 healthy subjects demonstrated a high agreement of LV diastolic indices obtained from the proposed and conventional method.
Introduction
A key parameter in the evaluation of LV diastolic function is the ratio of peak blood flow velocity (E) to peak myocardial velocity (Em) during diastole. Em is several fold lower than E. The traditional approach of setting the velocity sensitivity or VENC value of PC-MRI slightly above the maximum velocity likely to be encountered across the FOV to avoid aliasing, for example E in this instance, diminishes the velocity to noise ratio (VNR) for estimating Em 1.Until now, E and Em are measured in two acquisitions (or at best two TRs) with differing velocity sensitivities at the cost of doubling acquisition time - an approach we call single-echo dual velocity sensitivity (SEDV) technique.Purpose
The aim of this work is (1) To demonstrate the feasibility of a rapid dual echo approach with dual velocity sensitivity (DEDV) method2 that can simultaneously measure E and Em without compromising VNR in asymptomatic normal subjects, and (2) To compare the diastolic function metrics (E/Em and the deceleration time, DT) estimated from the SEDV and DEDV approaches.Materials and Methods
Subjects: 7 subjects (5 males, 2 females age: 51±13 yrs) were imaged on a commercial 3T MR imager (Ingenia, Philips Healthcare) with VCG gating, and a phased array coil for signal reception. All subjects provided written informed consent.
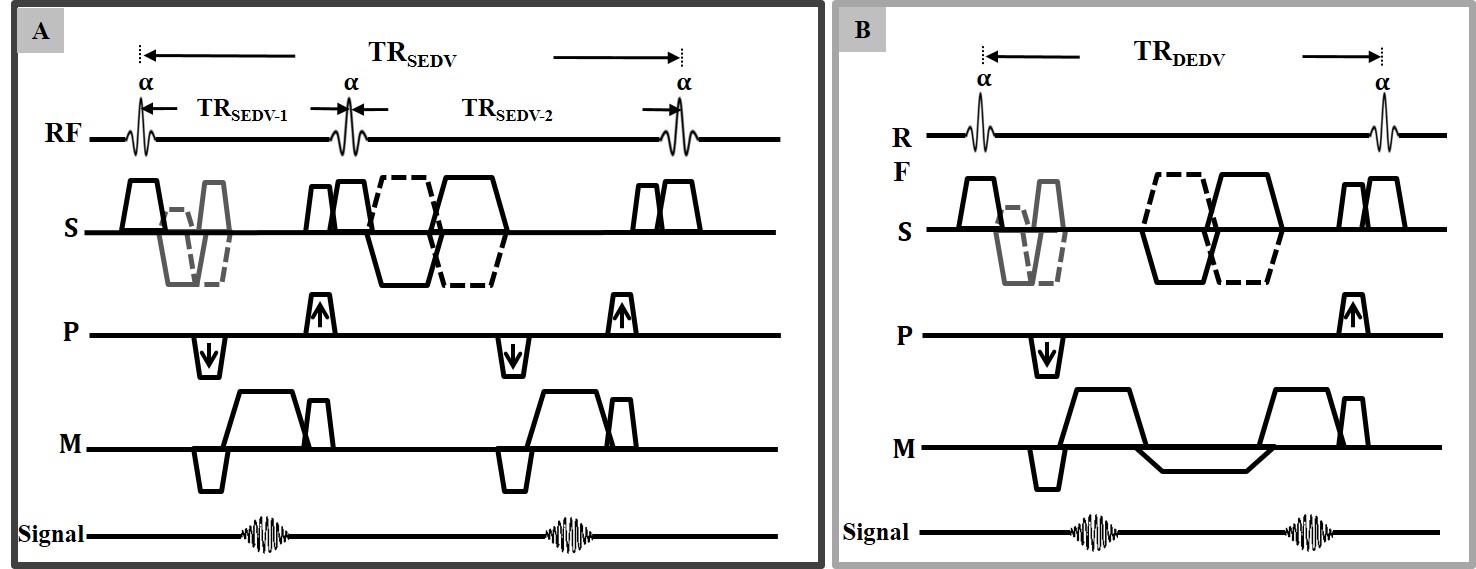
MRI acquisition: A custom software patch that allowed the prescription of different VENC values for a dual echo scan was created (Fig. 1) for a free-breathing segmented k-space PC-MRI sequence, and used in the study. PC-MRI of the short axis slice positioned below and parallel to the mitral valve plane was acquired with the DEDV pulse sequence with velocity sensitivity for the first and the second echoes set at: 150 cm/s and 20 cm/s; acquired voxel size: 2 x 2 x 8 mm3; temporal resolution: 20 ms. The same slice was acquired with conventional SEDV technique with VENC values set at 150 cm/s and 20 cm/s in two successive repetition times, while maintaining identical FOV, and spatial resolution as that of DEDV.
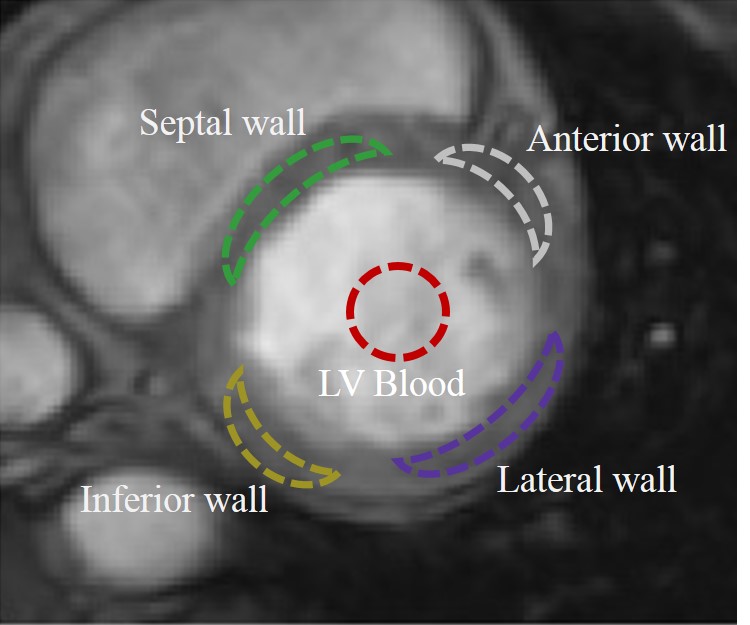
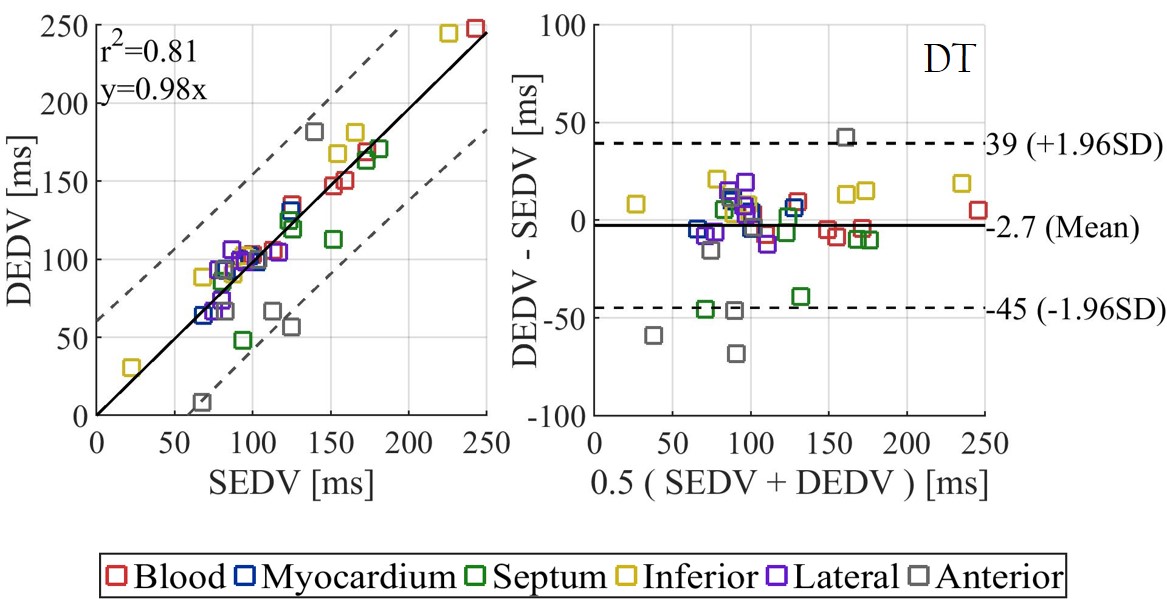
Data Analysis: Mean blood and myocardial tissue velocities were estimated from regions of interest (ROIs) circumscribing LV blood and myocardium, from PC-MRI acquired with high and low velocity sensitivities respectively. Myocardial region was further subdivided into segments to extract Em of septal, inferior, lateral, and anterior walls. E/Em and DT were calculated for each segment using both techniques. The positive axis of velocity was defined as tissue motion towards the apex of the heart. Linear regression and Bland-Altman plots used to compare the E/Em ratio and DT for the SEDV and DEDV methods.
Results
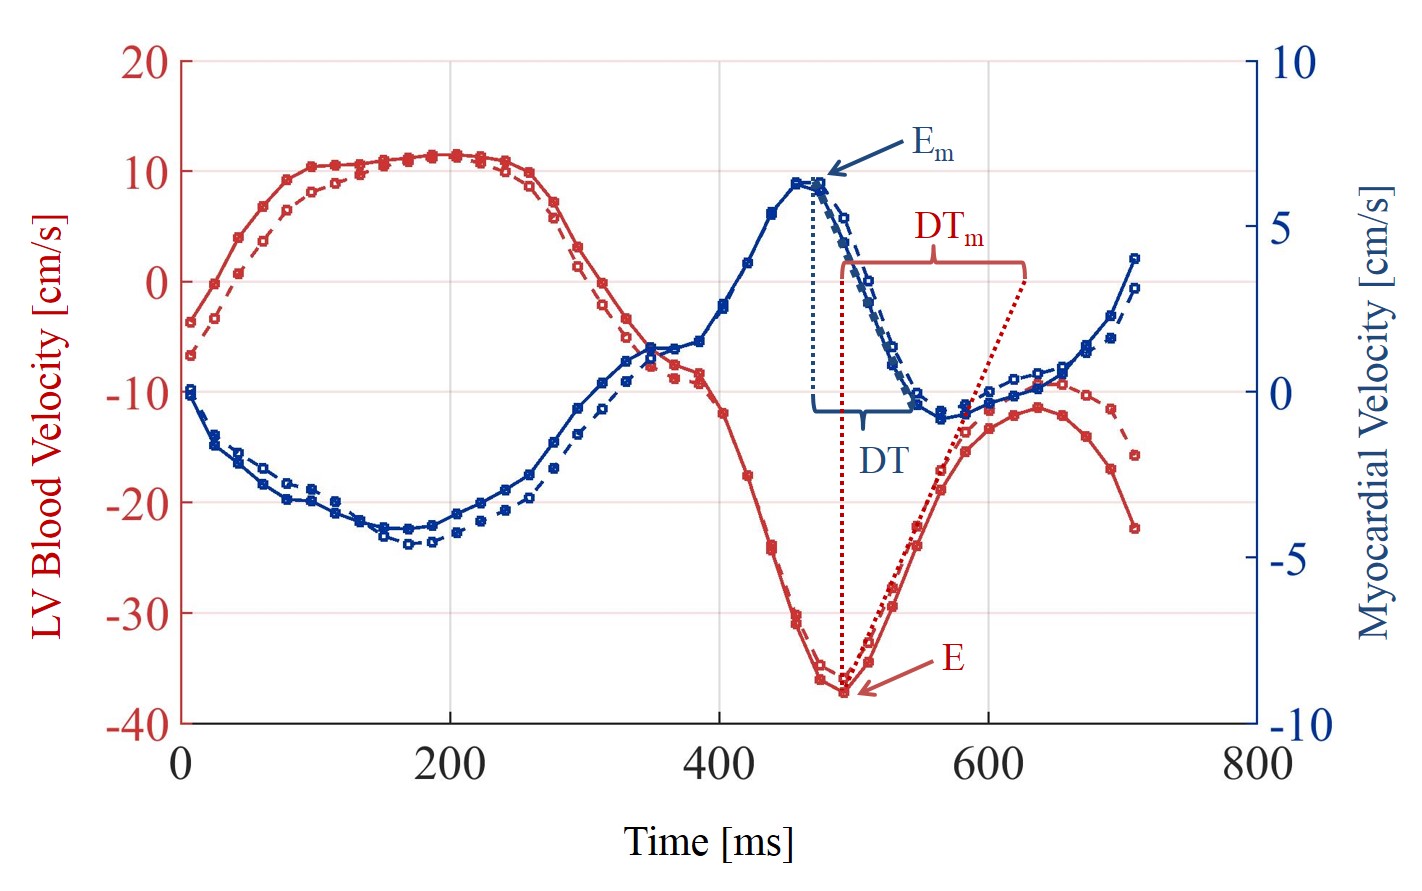
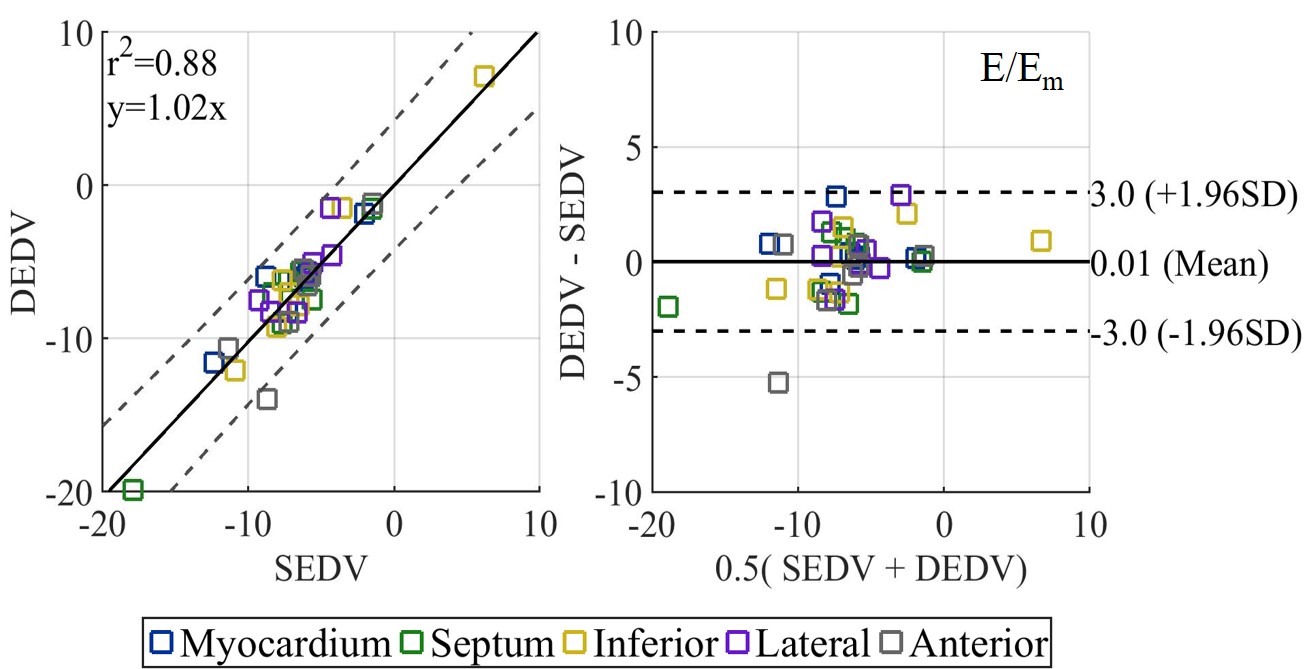
Myocardial and blood flow velocity curves throughout the cardiac cycle extracted from the high and low VENC acquisitions for the SEDV and DEDV acquisitions were similar (Fig. 3). E/Em between SEDV and DEDV techniques was well-correlated (r2 = 0.88), and had negligible bias: 0.01 (CI: -3 to 3) (Fig. 4). DT between the two techniques was well correlated (r2 = 0.81) and Bland Altman analysis showed a bias of -2.7 ms (CI: -45 ms to 39 ms). The mean scan time for SEDV and DEDV techniques was: 7.2 ± 2.4 min versus 4.5± 2.3 min, respectively.Discussion
The results from this study show that E and Em values obtained from the DEDV method compares well with the conventional SEDV method, and the calculated indices lie in the range reported for healthy, asymptomatic volunteers3. It is important to note that the scan time reduction with DEDV does not impose any constraints in spatial, and/or velocity resolution. Furthermore, this approach can be integrated with recently described spatio-temporal undersampling methods such as k-t BLAST, or compressed sensing4. It will be possible to quantify the late diastolic peak velocity (another important diastolic index) if the entire cardiac cycle is covered using a retrospective phase reconstruction.Conclusion
In this work, we demonstrated the feasibility of a rapid PC-MRI method that is capable of yielding diastolic functional metrics such as E/Em ratio and DT that are comparable to those obtained using conventional SEDV approaches.Acknowledgements
No acknowledgement found.References
[1] N. J. Pelc, R. J. Herfkens, A. Shimakawa, and D. R. Enzmann, “Phase contrast cine magnetic resonance imaging,” Magn. Reson. Q., vol. 7, no. 4, pp. 229–254, 1991.
[2] A. Ajala, J. Zhang, B. Cheong, P.-H. Hor, and R. Muthupillai, “A Dual Echo Dual VENC (DEDV) phase contrast method for simultaneous measurement of myocardial and blood flow velocities,” in Joint ISMRM–ESMRMB, 2018, p. 0011.
[3] J. G. Delfino et al., “Comparison of myocardial velocities obtained with magnetic resonance phase velocity mapping and tissue doppler imaging in normal subjects and patients with left ventricular dyssynchrony,” J. Magn. Reson. Imaging, vol. 24, no. 2, pp. 304–311, Aug. 2006.
[4] C. Baltes, S. Kozerke, M. S. Hansen, K. P. Pruessmann, J. Tsao, and P. Boesiger, “Accelerating cine phase-contrast flow measurements using k-t BLAST and k-t SENSE,” Magn. Reson. Med., vol. 54, no. 6, pp. 1430–1438, Dec. 2005.
Figures