0057
MRS Extended by Oscillating Diffusion Gradients as a Probe for Investigation of Human Brain Tissue Microstructure1Depts. Radiology and Biomedical Research, Bern, Switzerland
Synopsis
Pulsed diffusion and oscillating diffusion gradients implemented in a semi-Laser sequence for measuring at long and short diffusion times were tested in a phantom and applied in vivo. Metabolite diffusion constants measured in human gray matter in 6 healthy volunteers at short diffusion times were significantly higher than those determined at long diffusion times, suggesting an enhanced sensitivity to diffusion on the cellular and subcellular level.
Introduction
Diffusion-weighted spectroscopy (DW-MRS) provides information on metabolite diffusion. Unlike water, metabolites probe intracellular space only and are partially specific to neuronal (e.g. Glu, NAA)1 or glial (e.g. Ins, Cho)1 cells. Hence, metabolite-specific diffusion is a tailored probe for cellular tissue microstructure. Depending on diffusion time (TD), apparent diffusion coefficients (ADCs) are affected by different dimensions and mechanisms of cellular barriers2. Pulsed gradient spin-echo (PGSE) sequences, commonly used, measure at long diffusion times (TD) (>50ms) where ADCs represent diffusion mostly along tissue fibers3,4. Use of oscillating gradient spin-echo (OGSE) sequences sensitive to short TD (<10ms) promises ADCs more specific to cellular and subcellular properties (e.g. tissue diameter, size, tortuosity)2,5. This work aims to demonstrate that OGSE can be combined with DW-MRS on clinical MR systems to study human brain at short TD to provide ADCs sensitive to a different cellular length scale than PGSE.Methods
A semi-Laser6 localization sequence (cf. Fig.1) was extended to include diffusion-weighting by OGSE7,8 and PGSE9 elements, sensitive to TDs <10ms and >50ms, respectively. To counteract limited diffusion-weighting for OGSE a stretching exponent α was included to increase the gradient area10. The effective TD for OGSE is calculated from the gradient modulation spectrum (Fourier transform of total diffusion gradient shape G(t)) by10
$$\omega_{eff}^{OGSE}=\frac{\int_{0}^{\infty}\omega|F(\omega)|^2 d\omega}{\int_{0}^{\infty}|F(\omega)|^2 d\omega} \qquad TD_{eff}^{OGSE}=\frac{1}{4\,\omega_{eff}^{OGSE}}$$
The diffusion-weighting b was calculated by integration of G(t)
$$ b = \int_{0}^{T}dt \left[ \gamma \int_{0}^{t}G(t') dt' \right]^2$$
The parameter space in terms of b-value and TD as accessible on a clinical scanner is shown in Fig.2 as function of echo time (TE) and number of oscillation-periods N. As example, |F(ω)|² is provided for the {TD[ms],b[s/mm²],N} combinations of {5.7,1560,1}, {8.3,4660,1} and {4.5,1560,4} at α=8. For our diffusion measurements, TEs 150 and 200ms were chosen (N=1). At equal TE, PGSE was applied with effective TDs of 107 and 155ms and maximal b-values of 1716 and 4140s/mm². Background diffusion-weighting arising from crusher and slice-selecting gradients for a typical VoI of 30x30x30mm³ was estimated to be merely 55s/mm². Adiabatic metabolite-cycling and selective inversion-recovery pulses were added before localization to acquire water and metabolites simultaneously and suppress CSF (TI=1200ms)11. The inherent water reference was applied for frequency, phase, eddy-current correction and motion-compensation12. The sLaser sequence with PGSE and OGSE at 8 different b-values was tested in a “braino” phantom (TE=150ms) filled with an aqueous solution of typical brain metabolites and applied in vivo (TE=200ms) in gray matter of six healthy volunteers (age: 45.0±13.1yrs). Measurements were performed on a 3T Siemens PRISMA scanner using a 20-channel headcoil. Spectra were fitted with FiTAID13, first independently to probe mono-exponentiality of the decay and second simultaneously imposing a mono-exponential DW signal decay together with spectral linear-combination-model fitting14. The metabolite basis sets were simulated for sLaser with VESPA using real pulse shapes15.
Results and Discussion
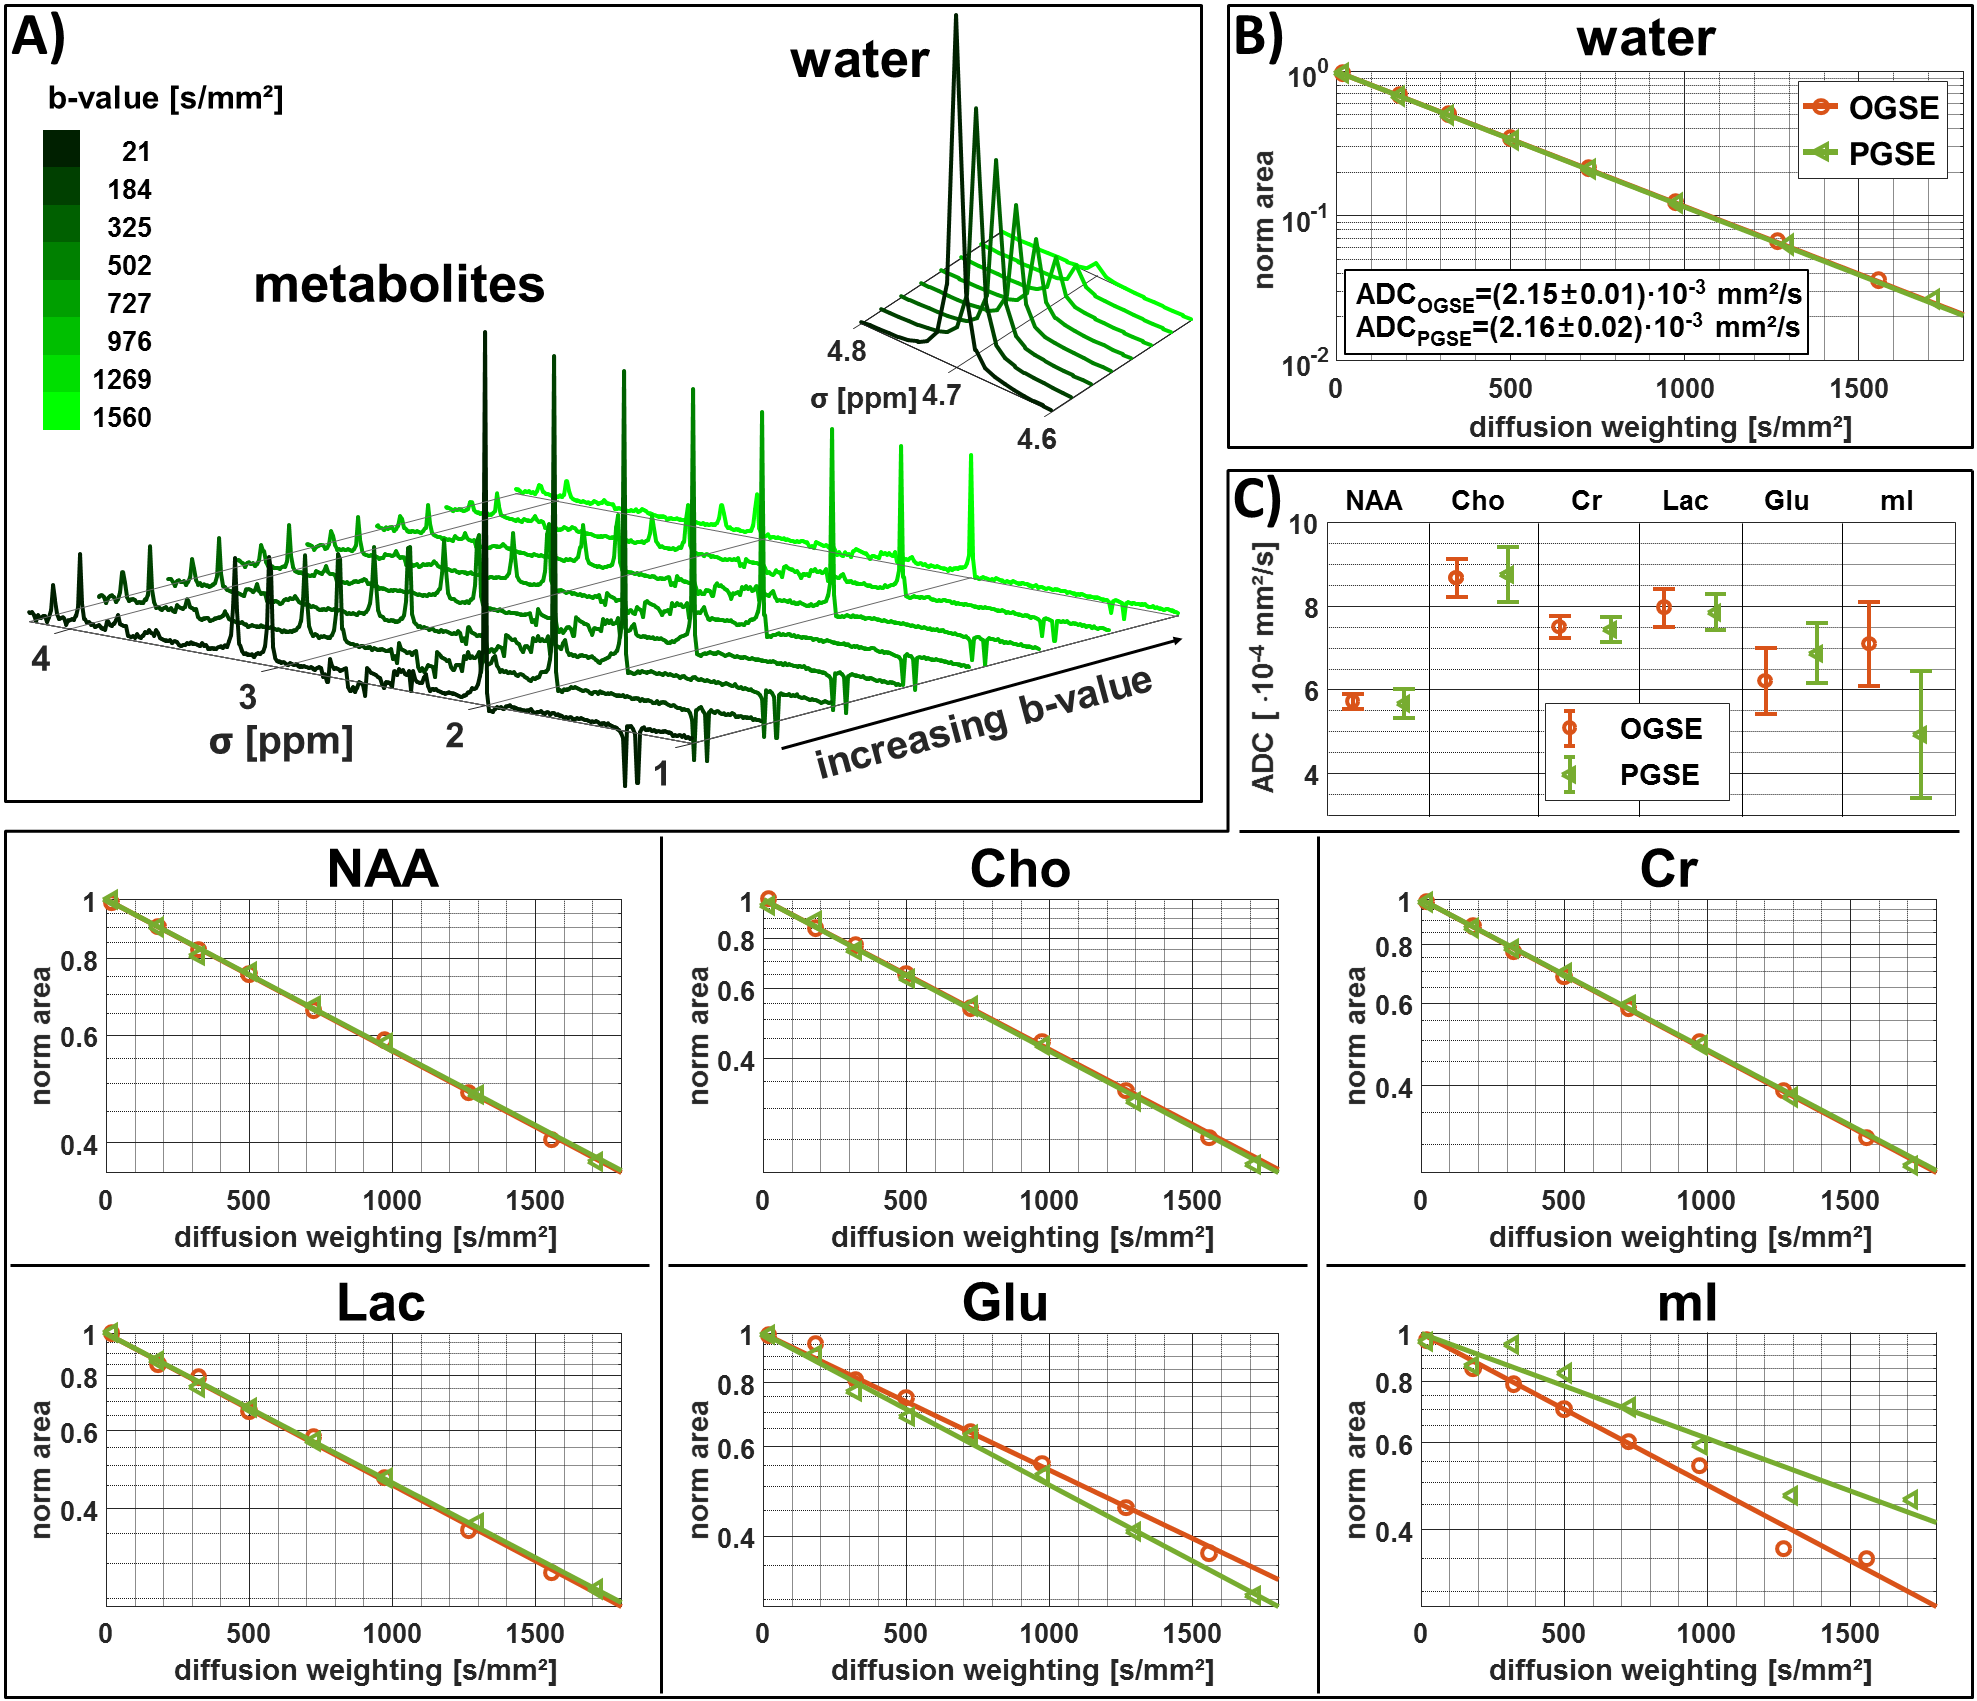
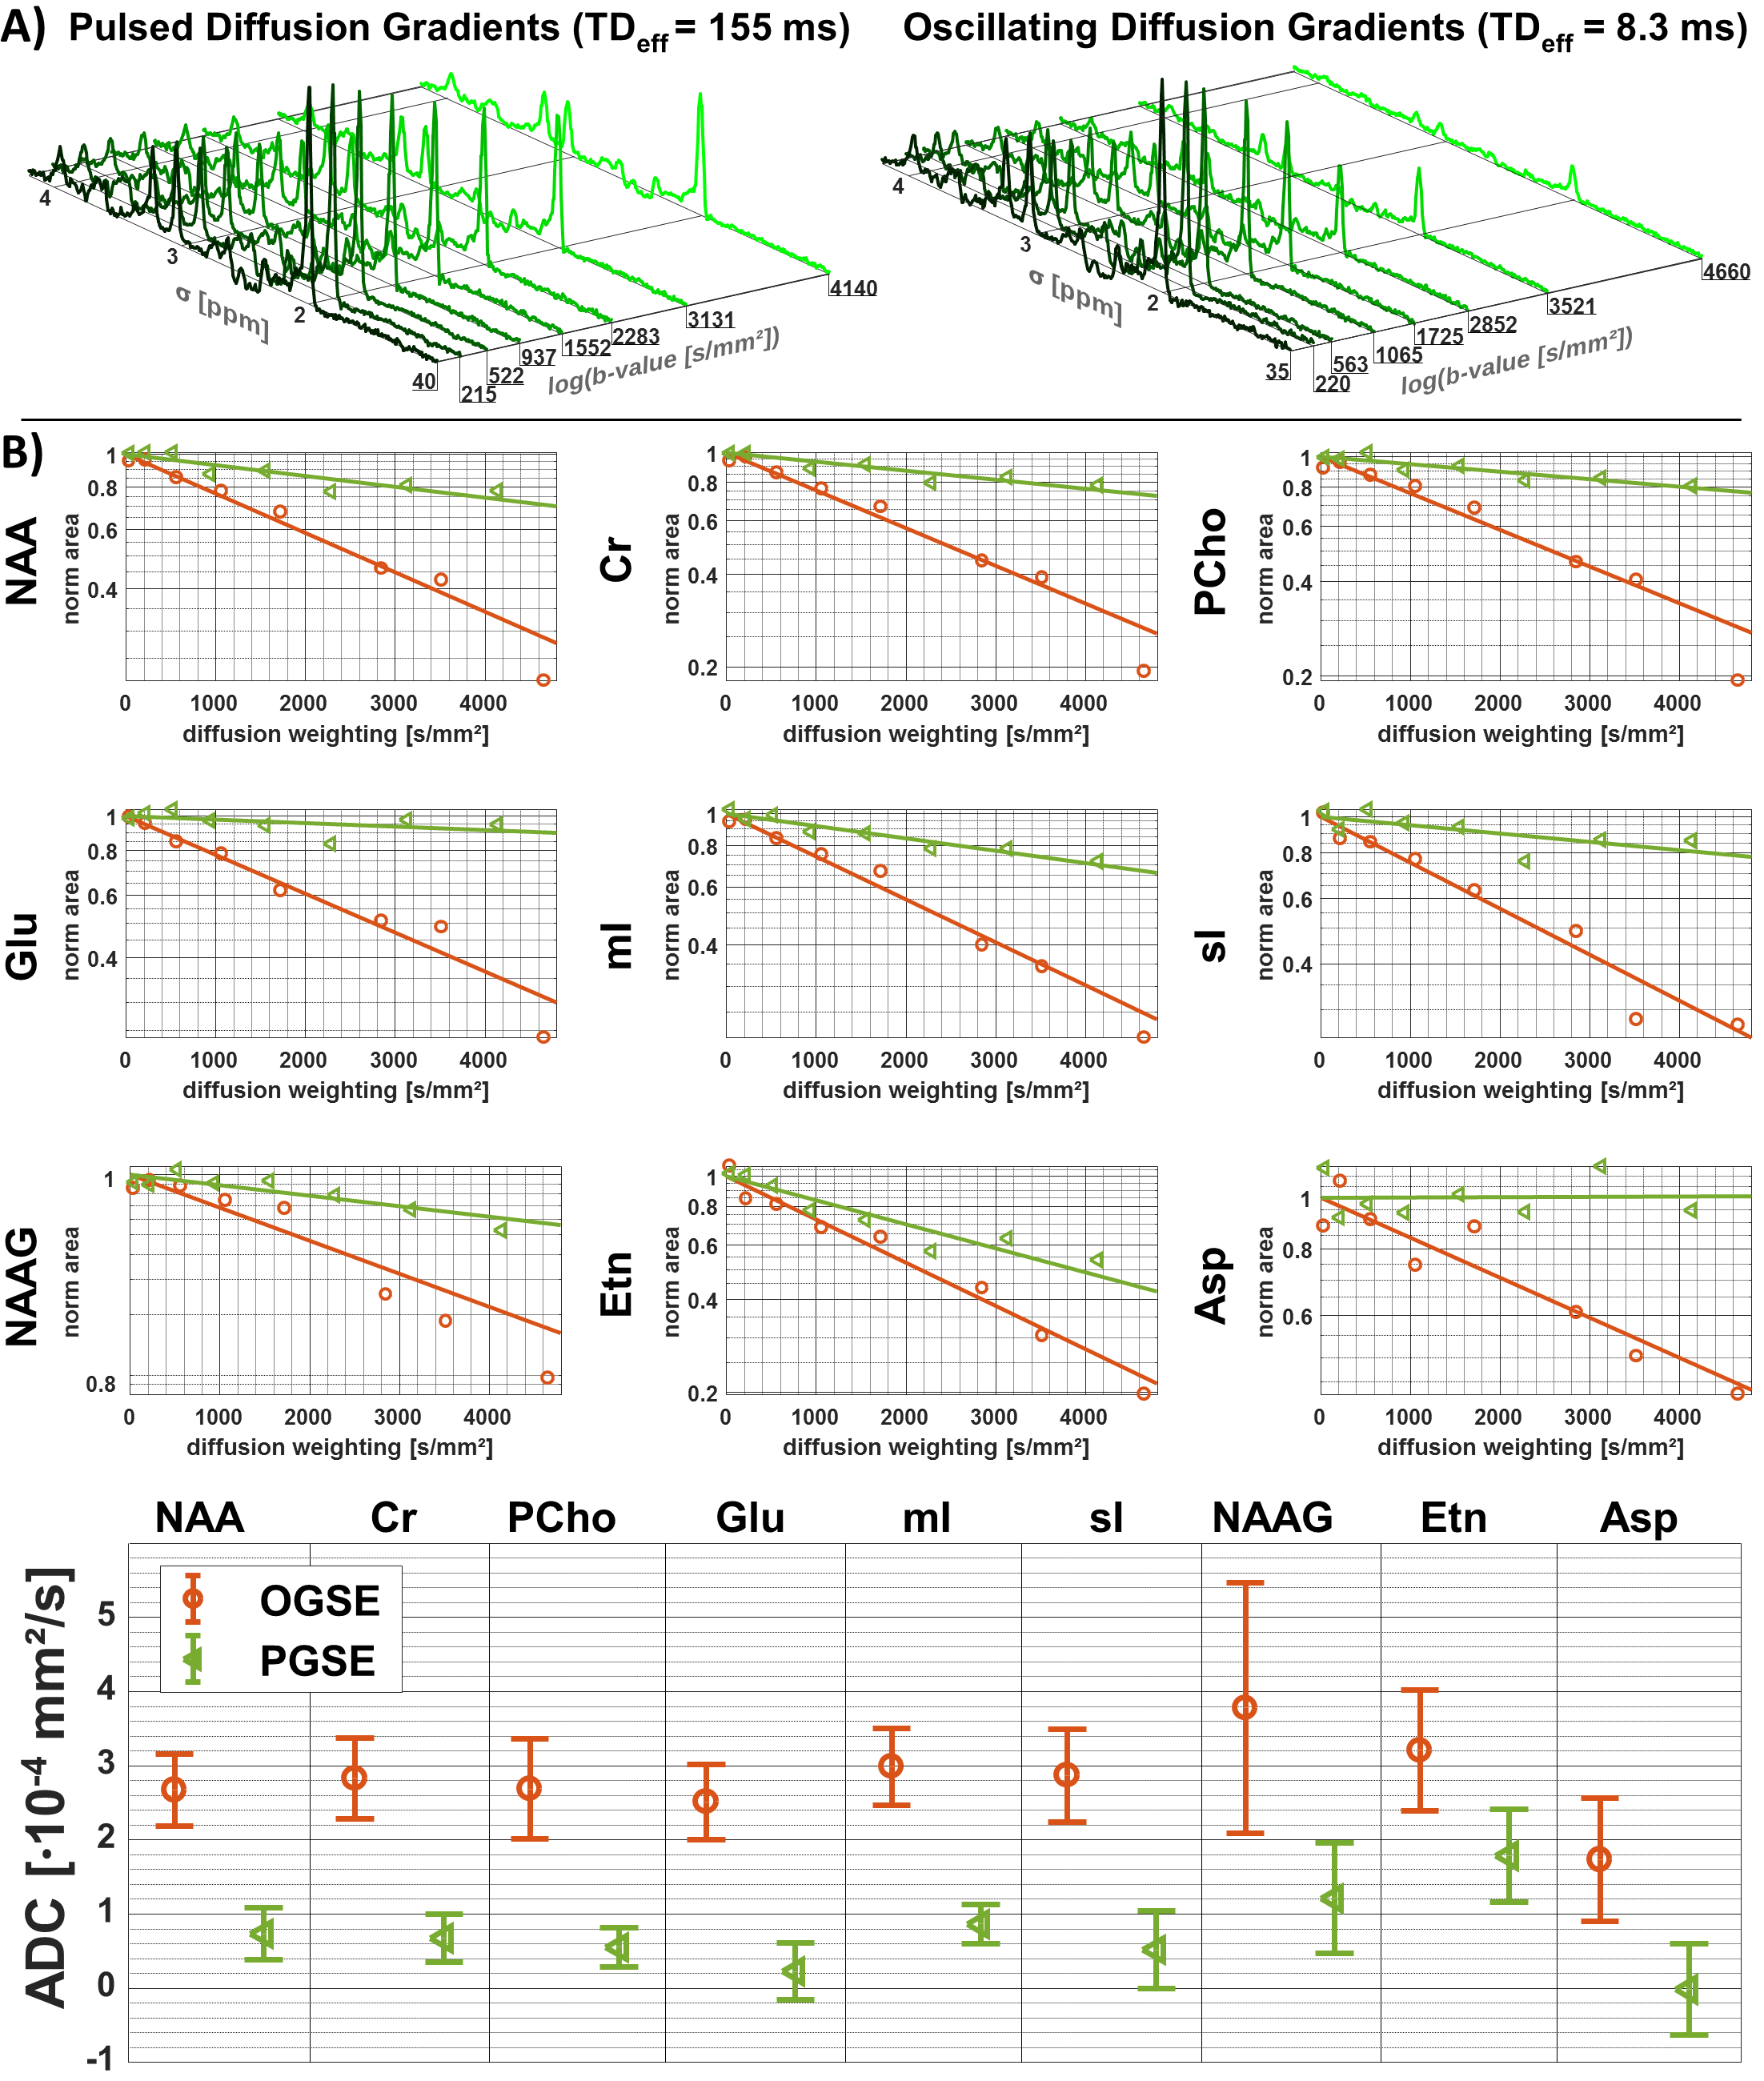
Fig.3A shows water and metabolite spectra acquired simultaneously in the phantom with OGSE at different diffusion-weighting. The signal attenuation (Fig.3B & 3C) is mono-exponential for both PGSE and OGSE, and yields almost identical ADCs compatible with free diffusion. The possible parameter space for application of OGSE in vivo is limited by available gradient strength, TE, TD and physiological safety restrictions (cf. Fig.2), where a tradeoff to reach adequate b-values (4660s/mm²) has to be taken with prolonged TD (8.3ms) and TE (200ms). Fig.4A shows exemplary metabolite spectra acquired with PGSE and OGSE in a single subject. The slower signal attenuation in case of PGSE is directly visible from spectral inspection. Increased ADCs are found for all metabolites using OGSE at short TD (cf. Fig.4B). The signal attenuation for individual metabolites is mono-exponential within the error estimates. The cohort ADCs derived from 2D simultaneous fitting are presented in Fig.5. A paired t-test reveals highly significant and significantly faster diffusion of Cr, PCho, NAA, mI, Gln, Glu, NAAG, sI and Tau for OGSE than PGSE. These results suggest that even for moderate TDs (5-10ms) the ADC sensitivity for the cellular compartment changes to smaller structures where not only diffusion along fibers, but also subcellular diffusion, contributes.Conclusion
A sLaser diffusion sequence with PGSE and OGSE was developed and successfully tested in vitro and applied in vivo. It is demonstrated in human brain that application of OGSE reveal significantly increased metabolite ADCs compared to PGSE, indicating an increased sensitivity to diffusion on the cellular and subcellular level at short TD. ADCs representing diffusion on this level (at short and ultra-short TD) are assumed to be more sensitive to cellular and subcellular changes in disease. We hope that later studies will confirm a higher sensitivity for patho-physiological ADC changes at short TD.Acknowledgements
This work is supported by the Swiss National Science Foundation (SNSF #320030‐175984).References
[1] Choi J, Dedeoglu A, and Jenkins B. Application of MRS to mouse models of neurodegenerative illness. NMR Biomed 2007; 20:216–237.
[2] Valette J, Ligneul C, Marchadour C, Najac C, and Palombo M. Brain Metabolite Diffusion from Ultra-Short to Ultra-Long Time Scales: What Do We Learn, Where Should We Go?. Front Neurosci 2018; 12:1–6.
[3] Najac C, Branzoli F, Ronen I, and Valette J. Brain intracellular metabolites are freely diffusing along cell fibers in grey and white matter, as measured by diffusion-weighted MR spectroscopy in the human brain at 7 T. Brain Struct Funct 2016; 221:1245–1254.
[4] Kroenke CD, Ackerman J, and Yablonskiy D. On the nature of the NAA diffusion attenuated MR signal in the central nervous system. Magn Reson Med 2004; 52:1052–1059.
[5] Ligneul J, Palombo C, Flament M, and Valette J. Approaching free intracellular diffusion by diffusion-weighted MRS at ultra-short time scales: initial results in the rodent brain using a 1.5 T/m gradient. Proc Intl Soc Mag Reson Med 2017; 25:1082.
[6] Öz G and Tkáč I. Short-echo, single-shot, full-intensity proton magnetic resonance spectroscopy for neurochemical profiling at 4 T: Validation in the cerebellum and brainstem. Magn Reson Med 2011; 65:901–910.
[7] Gross R and Kosfeld B. Anwendung der Spin-Echo‐Methode bei der Messung der Selbstdiffusion. Messtechnik 1969; 77:171–177.
[8] Does M, Parsons E, and GoreJ. Oscillating gradient measurements of water diffusion in normal and globally ischemic rat brain. Magn Reson Med 2003; 49:206–215.
[9] Stejskal E and Tanner J. Spin Diffusion Measurements: Spin Echoes in the Presence of a Time‐Dependent Field Gradient. J Chem Phys 1965; 42:288–292.
[10] Ligneul C and Valette J. Probing metabolite diffusion at ultra-short time scales in the mouse brain using optimized oscillating gradients and ‘short’-echo-time diffusion-weighted MRS. NMR Biomed 2017; 30:e3671.
[11] Hajnal J, Oatridge A, Herlihy A, and Bydder G. Reduction of CSF artifacts on FLAIR images by using adiabatic inversion pulses. Am J Neuroradiol 2001; 22:317–322.
[12] Döring A, Adalid V, Boesch C, and Kreis R. Diffusion-weighted magnetic resonance spectroscopy boosted by simultaneously acquired water reference signals. Magn Reson Med 2018; 80:2326–2338.
[13] Chong D, Kreis R, Bolliger C, Boesch C, and Slotboom J. Two-dimensional linear-combination model fitting of magnetic resonance spectra to define the macromolecule baseline using FiTAID, a Fitting Tool for Arrays of Interrelated Datasets. MAGMA 2011; 24:147–164.
[14] Adalid V, Döring A, Kyathanahally S, Bolliger C, Boesch C, and Kreis R. Fitting interrelated datasets: metabolite diffusion and general lineshapes. MAGMA 2017; 30:429–448.
[15] Soher B, Semanchuk P, Todd D, and Young K. Vespa: Versatile Simulation, Pulses and Analysis for MR Spectroscopy. 2017; Available: http://scion.duhs.duke.edu/vespa/.
Figures