0050
Self-adapting Multi-peak Water-fat Separation for Removing Lipid Artifacts in Breast Chemical Exchange Saturation Transfer (CEST) Imaging1Shanghai Key Laboratory of Magnetic Resonance, Shanghai, China
Synopsis
Chemical exchange saturation transfer (CEST) MRI show potential for breast lesion characterization. However, artifacts caused by strong lipid signals hinder its widespread application. To remove the artifacts, water-fat separation based on multipoint Dixon acquisition is used to obtain water-only images. Considering that RF pulses with various frequency offset in CEST preparation saturate each fat peak at different level, relative amplitudes of fat peaks are updated for building fat signal model by the numerical simulation. Based on this self-adapting multi-peak model (SMPM), a method combining nonlinear least-squares fitting and R2 *-IDEAL is used to perform the water-fat reconstruction. Phantom and in vivo breast experiments demonstrate that the proposed method successfully removes lipid artifacts.
Purpose:
This study aims to develop an accurate water-fat separation method for CEST based on the multipoint Dixon acquisition to remove lipid artifacts (1), and assess its reliability in phantom study and application in the breast.Theory
In this study, fat signal is modeled by multiple fat peaks. However, RF pulses with various frequency offset in CEST preparation saturate each fat peak at different level, which change the relative amplitudes of fat peaks. With the established scheme of CEST preparation, relative amplitudes of fat peaks after the CEST preparation in each voxel are determined by the frequency offset of saturation RF pulse and local parameters including R2*, B0 inhomogeneity and B1 inhomogeneity. The relative amplitudes of fat peaks are updated by numerical simulation based on the related Bloch equations, which is called self-adapting multi-peak model (SMPM). The water-fat reconstruction is based on the two-step approach as illustrated in Figure 1. In the first step, only the source data from the reference scans without CEST preparation are processed with the raw relative amplitudes of fat peaks. Nonlinear least-squares fitting is performed to obtain water, fat, R2* and ∆B0 maps. To avoid local minimums in the nonlinear fitting, initial guesses are provided by R2 *-IDEAL method (2). At the beginning of the second step, R2* and maps from the first step are combined with the B1 map from additional measurement to conduct the SMPM based updating for each voxel of CEST-scan images. With the updated relative amplitudes of fat peaks, the source data from CEST scans are processed using the same method as the first step.Method
The experiments on the agar-based fat-water phantom and human breast were performed to evaluate the accuracy and feasibility of the proposed method. The phantom included ε-Poly-L-lysine (5% w/w) and olive oil (40%w/w). All experiments were conducted on a 3T MR imaging system (Magnetom Prisma Fit, Siemens Healthcare, Erlangen, Germany) using the combination of an 11-cm-diameter circle surface coil and the spine matrix coil.
Phantom Study: The CEST preparation consisted of 8 Gaussian-shaped pulses, each 200ms long, and the average B1 =1.5μT. A total of 61 frequency offsets were acquired in the Z-spectrum from -6 ppm to 6 ppm, and one reference image without CEST preparation was acquired. The single-slice CEST images were acquired using 5-point Dixon sequence (repetition time/first echo time/echo spacing = 11/2.3/1.5ms, flip angle= 10°). The B1 map was obtained using the reported method (3). The CEST-PRESS sequence was used to generate fat-free Z-spectrum using the same saturation scheme as CEST imaging.
In Vivo Study: Scanning parameters for in vivo breast CEST imaging were same as the phantom experiment except for 32 offsets from -6 to 6 ppm. The B1 map was also acquired. The total scan time is 7 minutes.
Data Processing: The water-only CEST images for the phantom and in vivo breast were generated using the 3-point single-peak Dixon method (4), the fixed multi-peak model (FMPM) based method and the SMPM based method. In phantom study, the ROI-averaged Z-spectrum and MTRasym were calculated to compare the accuracy of three methods.
Results
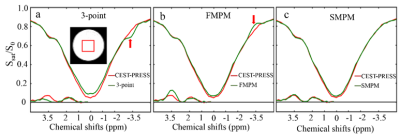
Figure 2 shows the ROI-averaged Z-spectrum and MTRasym of the phantom with the Z-spectrum from CEST-PRESS as a ground truth. A dip and a rise appeared at -3.5 ppm in the Z-spectrum obtained from the 3-point method (Fig. 2a) and the FMPM based method (Fig. 2b), respectively. The lipid artifacts were removed by the SMPM based method (Fig. 2c).
Figure 3 shows the results from the breast of a healthy volunteer. In the fibroglandular region with high fat-fractions, there was no lipid artifact in the Z-spectrum from the SMPM based method(Fig. 3h) while a dip (Fig. 3f) and a rise (Fig. 3g) appeared at -3.5 ppm was observed in the Z-spectrum from the 3-point method and the FMPM based method, respectively. Compared with the normal contrast in the CEST map from the SMPM based method, the abnormal low CEST contrasts in the amide CEST map from the 3-point method (Fig.3b) and abnormal high CEST contrasts in the amide CEST map from the FMPM based method (Fig. 3c) were demonstrated in the fibroglandular region with high fat-fractions (outlined by black curve).
Discussion & Conclusion:
The phantom and in vivo breast experiments demonstrated that the proposed SMPFM based water-fat separation method could remove lipid artifacts and significantly improve accuracy for CEST image, especially at high fat-fractions. This study suggests that it is possible to use this more accurate method to increase sensitivity and specificity in the study of breast diseases.Acknowledgements
No acknowledgement found.References
(1) Zhang S et al. Magnetic Resonance in Medicine, 2017, 79(5):2731-2737.
(2) Yu H et al. Magnetic Resonance in Medicine, 2010, 60(5):1122-1134.
(3) Stollberger R et al. Magnetic Resonance in Medicine, 2010, 35(2):246-251.
(4) Zhang S et al. Magnetic Resonance in Medicine, 2018, 80(3):895-903.
Figures


