Multi-Modality Imaging in an MRI Scanner: Making the Systems Compatible
1University Medical Center Utrecht, Netherlands
Synopsis
Focused ultrasound (FUS) is increasingly used for therapy. It can be guided by MRI, ultrasound imaging, or both. Here, three examples are elaborated how MRI and ultrasound imaging can be used simultaneously and beneficially for guiding FUS: 1) Tracking of beampath obstructions (ribs); 2) Motion evaluation; 3) Monitoring of cavitation during drug delivery with microbubbles.
Focused Ultrasound Therapy
The goal of FUS thermal ablation therapy is to deliver a sufficient thermal dose to the cancerous tissue to induce thermal necrosis (1). The delivered thermal dose is calculated using the concept of Cumulative Equivalent Minutes at 43oC (CEM43). Pe-clinical studies have reported thermal dose requirements ranging from 50 to 240 CEM43 (2). Therefore, 240 CEM43 is currently often considered to be the lethal thermal dose threshold. Clinical trials have demonstrated the safety and feasibility of FUS thermal ablation of liver tumors (2, 3) and pancreatic tumors (4,5). Shrinkage of the ablated tumor, pain palliation, and general improvements in quality of life of the patients have been reported. However, complications during and after treatment were also reported, such as necrosis of the ribs in the ultrasonic beam path (3). This indicates that there are still challenges that need to be overcome before FUS thermal ablation therapy can gain widespread clinical adoption (5,6). Apart from thermal effects, focused ultrasound can induce mechanical effects in biological tissue such as cavitation. At threshold pressure levels, oscillating ultrasonic pressure waves can cause cavities. The formation of such cavities is a stochastic process, dependent on the nucleation sites (7). After formation, these cavities are rapidly filled with liquid vapor as well as any other gases dissolved in the medium, forming a vapor-filled bubble. Two types of cavitation are distinguished: non-inertial and inertial cavitation. These two types of cavitation are separated by a threshold pressure level (8, 9). The presence of cavitation can be exploited to enhance heating, as multiple reflections of the ultrasonic waves between the bubbles can increase absorption locally (10, 11). In addition, it has been shown that at resonance size, bubbles extract substantially more energy from the ultrasonic field (12). Such methods are referred to as cavitation-enhanced heating, (13,14). Another method that exploits the occurrence of cavitation is cavitation-cloud histotripsy (15). By applying sufficient acoustic pressure levels, typically 15 - 25 MPa rarefactional pressure and > 80 MPa compressional pressure (16), a bubble cloud can be created in the focal area. Once the bubble cloud has been initiated, consecutive ultrasonic pulses are applied to sustain and grow the bubble cloud and mechanically ablate the tissue in the focal area. These pulses are typically 3 – 20 μs long and spaced 1 - 10 ms apart (16). An advantage of this method is that the cavitation cloud is in principle confined to the focal area, as it requires threshold pressures to be induced and sustained. Feasibility of cavitation-cloud histotripsy has been demonstrated in the in vivo porcine liver (17, 18). Cavitation is also used for boiling histotripsy (19). In contrast to cavitation-cloud histotripsy, boiling histotripsy uses longer pulses of 2 - 20 ms, spaced 1 - 2 s apart, at pressure levels typically around p_ of 10 - 15 MPa and p+ > 40 MPa. These pulses form acoustic shock waves in the focal point, inducing a boiling bubble in milliseconds. The process is highly predictable and always occurs in the focal area. Boiling histotripsy is therefore reproducible. Feasibility of boiling histotripsy has been demonstrated in the in vivo porcine liver (20).Ultrasound imaging for guidance of Focused Ultrasound therapy
Ultrasound imaging allows for real-time monitoring of the intervention (21) and for the identification of cavitation bubble clouds on B-mode images (22), or through spectral analysis of signals (23). Treatment efficacy can be evaluated on B-mode (21), but also by changes in attenuation (24), stiffness of the tissue (25), or by assessing non-perfused areas through use of a contrast agent (26). However, reliable temperature mapping is currently not available (27).MRI for guidance of Focused Ultrasound therapy
MRI allows for temperature mapping during the intervention (28, 29) based on the proton resonance frequency shift (PRFS, 30, 31). MRI is more expensive and more complex. In addition, the fact that MRI generally provides a lower temporal resolution compared to ultrasound imaging makes it more susceptible to motion artefacts, and makes cavitation- and histotripsy-based treatment modalities more difficult to monitor.Combining ultrasound and MRI for guidance of FUS therapy
MRI and ultrasound imaging can be combined since i) frequencies of both modalities are very different; ii) ultrasound transducer are usually made from non-ferromagnetic materials; iii) thin MRI receivers can be used that do not block ultrasound wave propagation. Below, three applications above will be discussed.
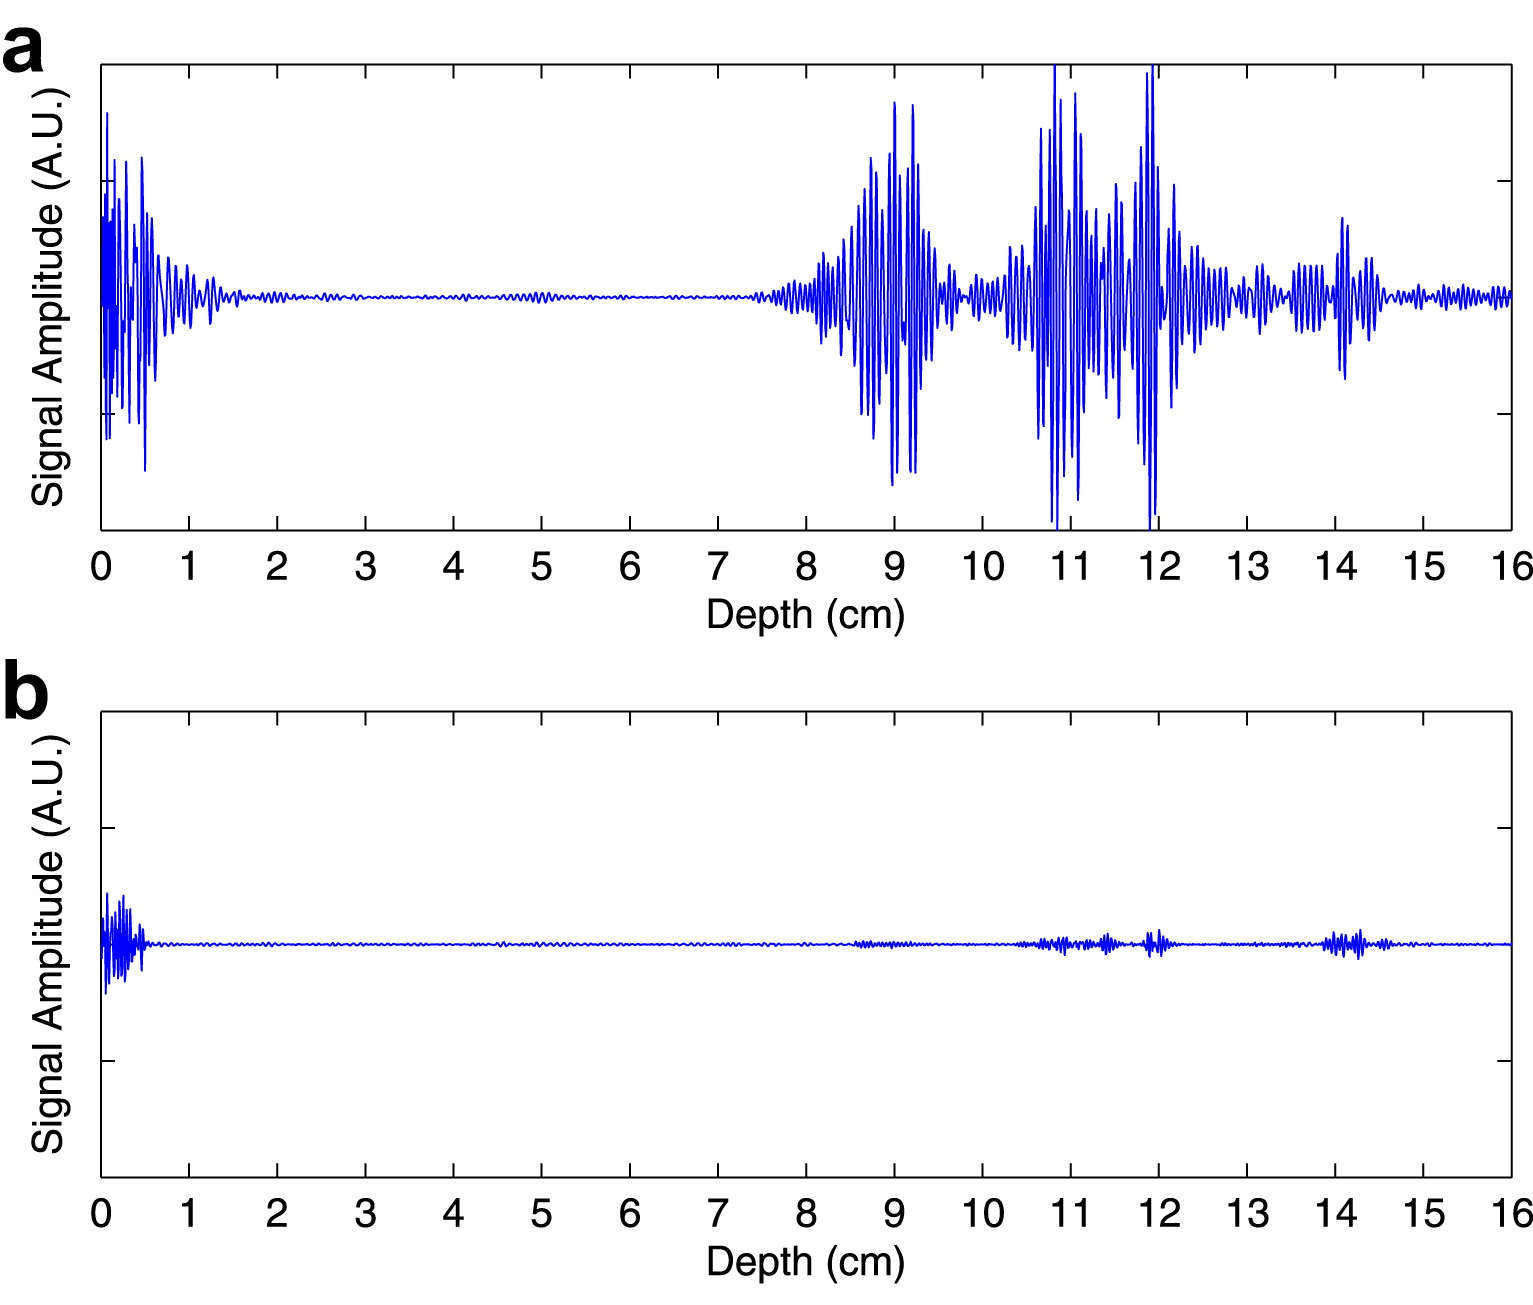
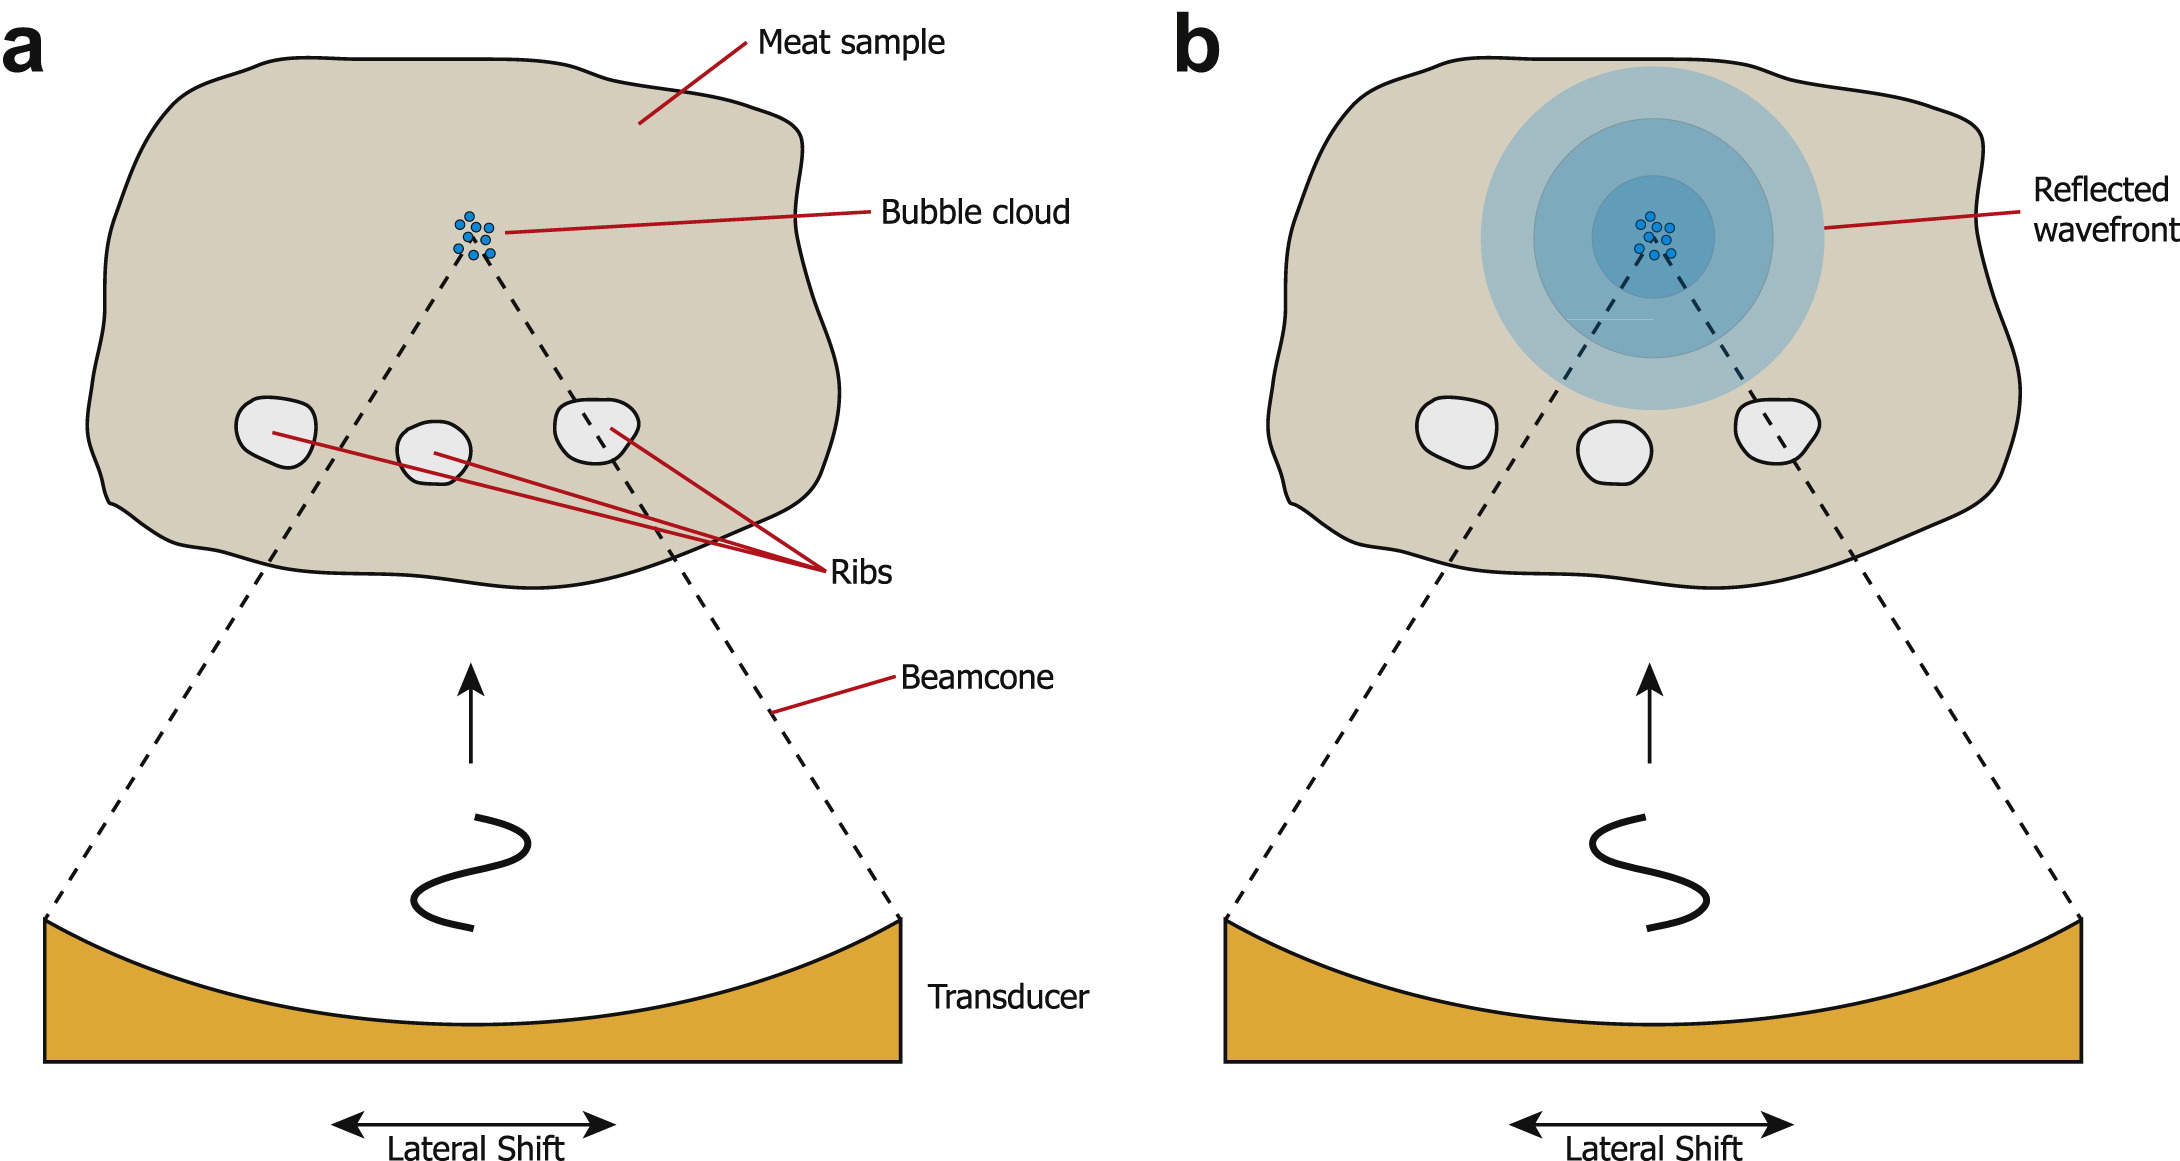
Tracking of beampath obstructions (ribs): Obstruction of the ultrasonic beam by the thoracic cage can lead to undesired overheating of the ribs, due to the high absorption coefficient of the bone (32). In addition, the thoracic cage acts as an aberrator of the ultrasonic beam, effectively decreasing its focusing quality (33, 34). When using a multi-element phased array transducer, applying an apodization to the transducer elements, allows effectively switching off elements whose emitted energy is blocked by ribs. The limitations set by the local energy density in the prefocal zone have been shown to severely limit the available ablation rate (35), and therefore the feasibility of intercostal FUS therapy. For FUS interventions in the upper abdomen, the thoracic cage obstructs and aberrates the ultrasonic beam. When using a phased array therapeutic transducer, such complications are minimized by applying an apodization law based on analysis of beam path obstructions. In recent work, a rib detection method based on cavitation enhanced ultrasonic reflections is introduced and validated ex vivo on a porcine tissue sample containing ribs, and in vivo on an anesthetized pig under controlled breathing.
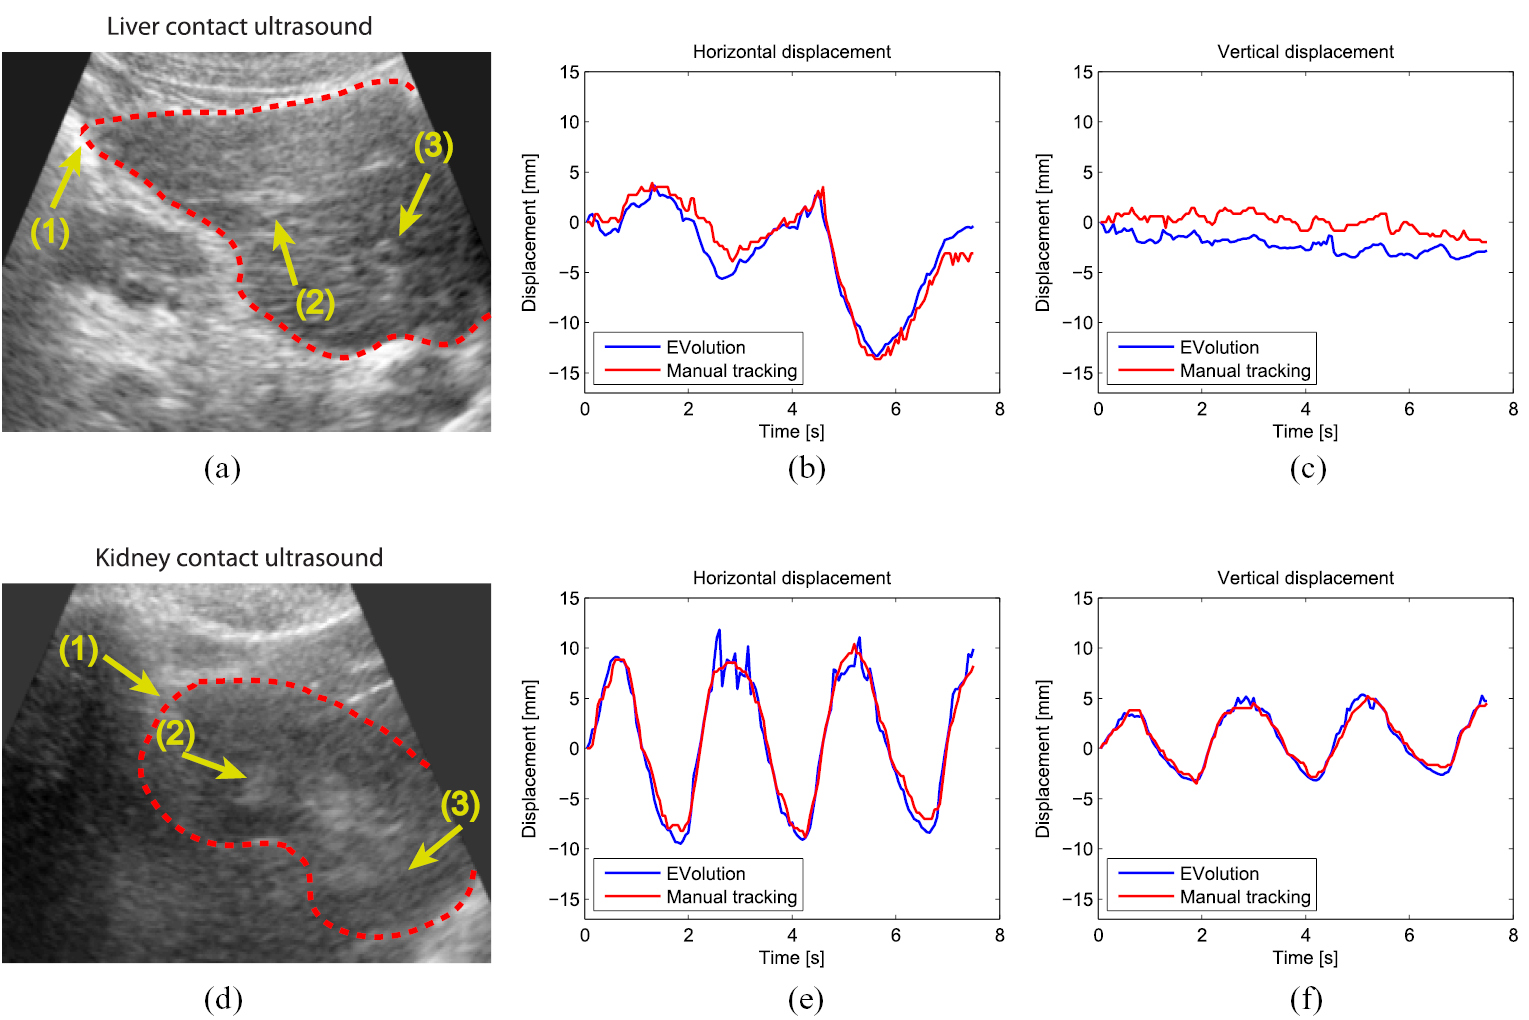
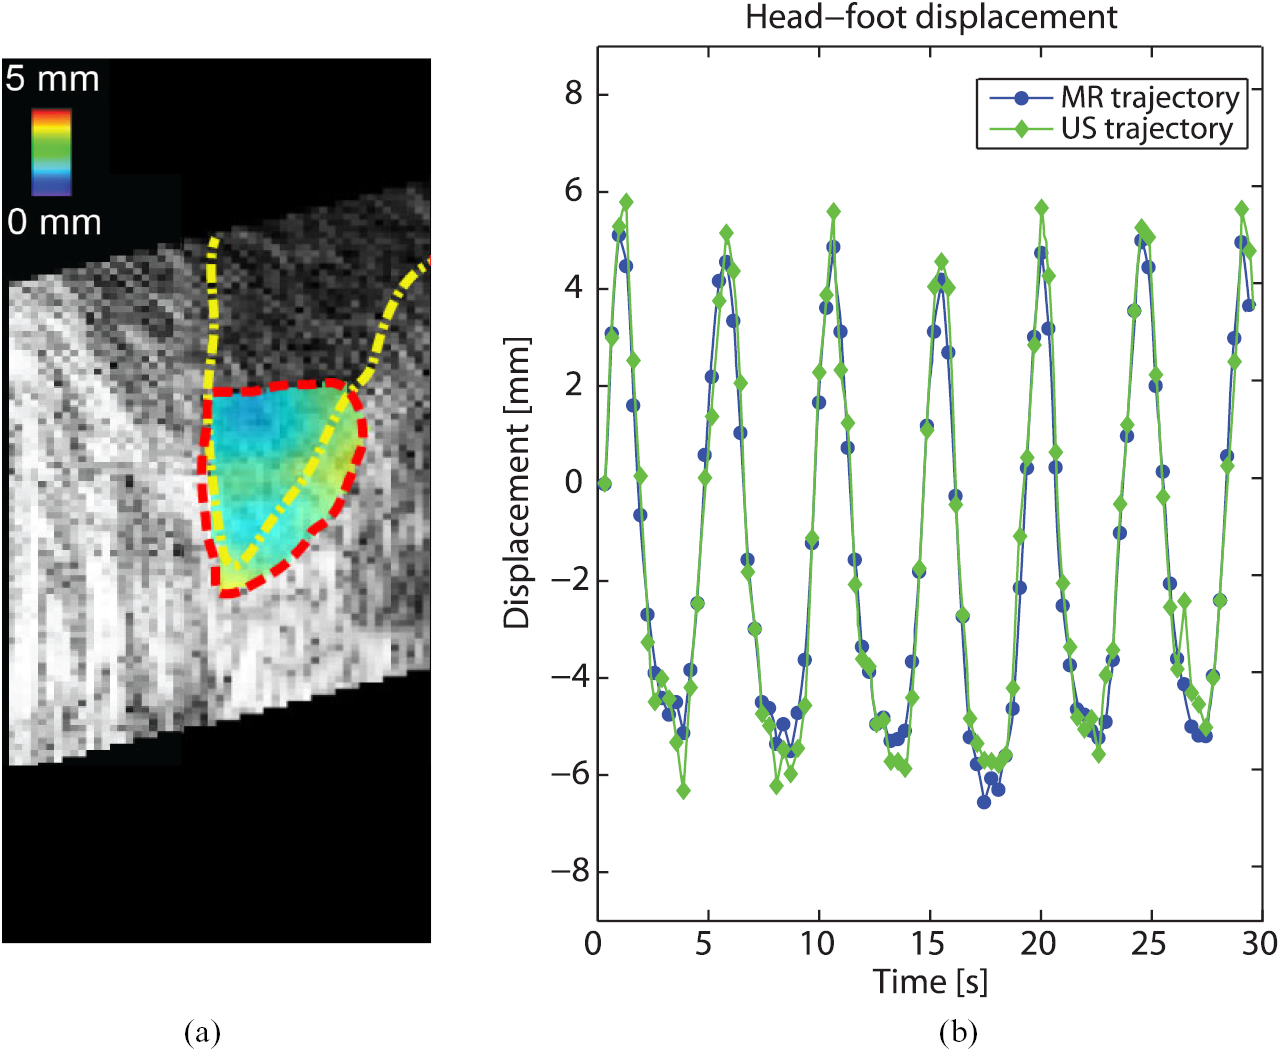
Motion evaluation: Respiratory-induced organ motion can affect the precision of FUS energy deposition, as the target tumor moves continuously. Another way to compensate for respiratory motion is by making use of real time target tracking , in which the ultrasonic beam is locked onto the target during the entire motion cycle. Such methods have been shown to be feasible for both ultrasound imaging and MRI (36-38).
Monitoring of cavitation during drug delivery with microbubbles: Cavitation-facilitated FUS therapy is a promising method of drug delivery across the blood–brain barrier (BBB). Contrast-enhanced MRI is used for BBBD detection and damage evaluation. However, imaging occurs after sonication and is time-consuming. Recent studies (40) showed that passive cavitation detection (PCD) with ultrasound is a feasible approach for treatment control.
Acknowledgements
The HIFU team of the UMC utrecht is acknowledged, in particular Pascal Ramaekers and Cornel Zachiu whose thesis has formed the basis of this presentation.References
1. Sapareto, S. A. & Dewey, W. C. International Journal of Radiation Oncology* Biology* Physics 10, 787–800 (1984). 2. McDannold, N. J., King, R. L., Jolesz, F. A. & Hynynen, K. H. Radiology 216, 517–523 (2000). 3. Illing, R. O. et al. British journal of cancer 93, 890–895 (2005). 4. Jung, S. E., Cho, S. H., Jang, J. H. & Han, J.-Y. Abdominal imaging 36, 185– 195 (2011). 5. Wang, X. & Sun, J. Chinese medical journal 115, 1332–1335 (2002). 6. Wijlemans, J. W. et al. Cancer Imaging 12, 387–394 (2012). 7. Jang, H. J., Lee, J.-Y., Lee, D.-H., Kim,W.-H. & Hwang, J. H. Gut Liver 4, S57–S61 (2010). 8. Leighton, T. 1994. ISBN: 0-12-44190-8 (1994). 9. Blake, F. Acoustics Research Laboratory, Harvard University, Cambridge, MA (1949). 11. Apfel, R. in Cavitation and inhomogeneities in underwater acoustics 79–83 (Springer, 1980). 12. Hynynen, K. UMB 17, 157–169 (1991). 13. Clarke, R. L. & Ter Haar, G. R. UMB 23, 299–306 (1997). 14. Wu, J. & Nyborg,W. L. ADDR 60, 1103–1116 (2008). 15. Elbes, D. et al. UMB 39, 1388–1397 (2013). 16. Zhao, L.-Y., Liu, S., Chen, Z.-G., Zou, J.-Z. & Wu, F. International Journal of Hyperthermia, 1–11 (2016). 17. Parsons, J. E., Cain, C. A., Abrams, G. D. & Fowlkes, J. B. UMB 32, 115–129 (2006). 18. Maxwell, A. et al. Acoustics Today 8, 24–37 (2012). 19. Vlaisavljevich, E. et al. UMB 39, 1398–1409 (2013). 20. Kim, Y. et al. PMB 59, 2553 (2014). 21. Canney, M. S., Khokhlova, V. A., Bessonova, O. V., Bailey, M. R. & Crum, L. A. UMB 36, 250–267 (2010). 22. Khokhlova, T. D. et al. PNAS 111, 8161–8166 (2014). 21. Vaezy, S. et al. UMB 27, 33–42 (2001). 22. Rabkin, B. A., Zderic, V. & Vaezy, S. UMB 31, 947–956 (2005). 23. Farny, C. H., Holt, R. G. & Roy, R. AUMB 35, 603–615 (2009). 24. Ribault, M., Chapelon, J., Cathignol, D. & Gelet, A. Ultrasonic imaging 20, 160–177 (1998). 25. Kallel, F. et al. UMB 25, 641–647 (1999). 26. Kennedy, J. E. et al. UMB 30, 851–854 (2004). 27. Lewis, M. A., Staruch, R. M. & Chopra, R. IJH 31, 163–181 (2015). 28. De Senneville, B. D. et al. EUR Radiol 17, 2401–2410 (2007). 29. Rieke, V. & Butts Pauly, K. MR thermometry. JMRI 27, 376–390 (2008). 30. Ishihara, Y. et al. MRM 34, 814–823 (1995). 31. Poorter, J. D. et al.. MRM 33, 74–81 (1995). 32. Goss, S. A., Frizzell, L. A. & Dunn, F. UMB 5, 181–186 (1979). 33. Liu, H.-L. et al. Medical Physics 34, 3436–3448 (2007). 34. Bobkova, S., Gavrilov, L., Khoklova, V., Shaw, A. & Hand, J. UMB 36, 888–906 (2010). 35. De Greef, M. et al. Medical physics 42, 4685–4697 (2015). 36. Pernot, M., Aubry, J.-F., Tanter, M., Thomas, J.-L. & Fink, M. PMB 48, 2577 (2003). 37. De Senneville, B. D., Mougenot, C. & Moonen, C. T. MRM 57, 319–330 (2007). 38. Marquet, F., Aubry, J. F., Pernot, M., Fink, M. & Tanter, M. PMB 56, 7061 (2011). 39. B. Denis de Senneville, C. Zachiu, M. Ries, and C. Moonen. Phys Med Biol, 61(20):7377–7396, 2016. 40. Sun T., Zhang Y., Power C., Alexander P.M., Sutton J.T., Aryal M., Vykhodtseva N., (...), McDannold N.J. PNAS, 114 (48) , pp. E10281-E10290. (2017)Figures