Methods to Validate Quantitative Perfusion Measures
1Stanford University, Stanford, CA, United States
Synopsis
Cerebral blood flow (CBF) is a critical physiological biomarker that select appropriate treatments for cerebrovascular patients and is affected in aging and numerous neurological disorders. However, validation of perfusion biomarkers has been challenging, due to (a) inability to compare with a simultaneous reference standard; and (b) insufficient testing in disease cases, where pathology may interact with the imaging mechanism itself to create CBF inaccuracies. This talk describes how to define an appropriate perfusion measure to address a research/clinical question, and design experiments to validate this measurement. It also describes multi-modal imaging and challenge studies (cerebrovascular reactivity) contribute confidence in quantitative perfusion measures.
Objectives
By the end of the talk, attendees will be able to:
- Define an appropriate perfusion measure to address their research/clinical question, and design experiments to validate this measurement.
- Describe how challenge studies (cerebrovascular reactivity) and multi-modal imaging contribute confidence in quantitative perfusion measures.
Introduction
Cerebral blood flow is a fundamental rate constant (ml/100g/min) that describes the delivery of essential nutrients, therapeutics, and imaging agents to brain tissue, and clearance of unwanted waste products. Disruption to this blood supply has devastating consequences, notably in ischemic stroke, and imaging of quantitative CBF enables selection of therapies for patients at critical time points.
The MRI community has over 25 years of experience in CBF imaging with contrast-based and endogenous methods to assess global and regional brain perfusion1. However, validation of these biomarkers for use in clinical trials has been challenging, due to (a) inability to compare directly with a simultaneous reference standard; and (b) insufficient testing in disease cases, where pathology may interact with the imaging mechanism itself to create CBF inaccuracies.
Multi-modal imaging of cerebral blood flow
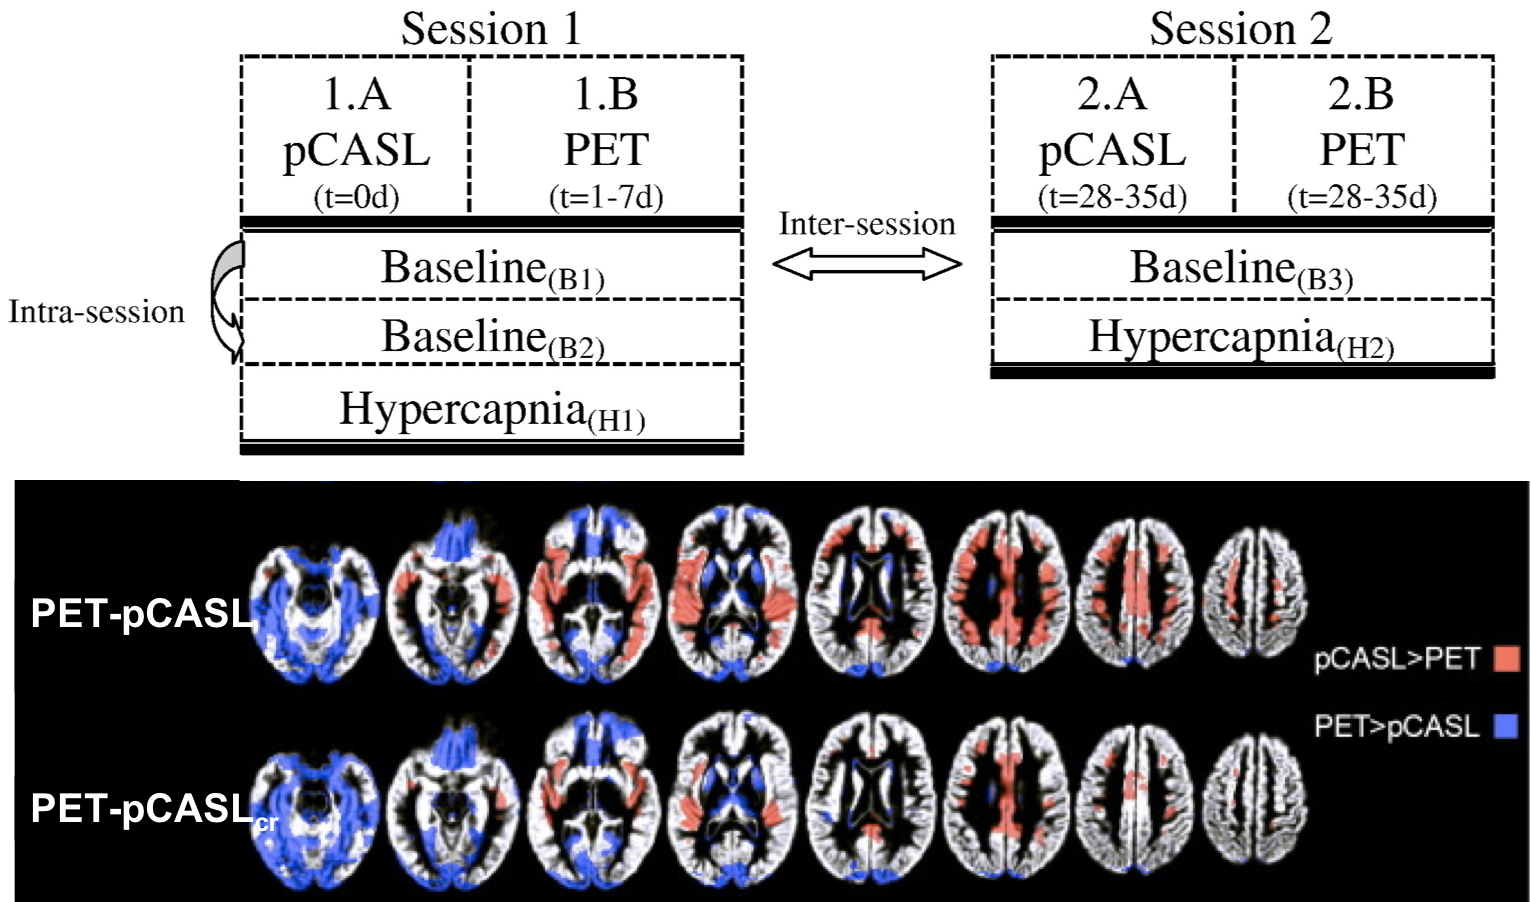
For clinical imaging, nuclear medicine techniques such as oxygen-15 water PET and xenon-133 CT are considered the reference standard for perfusion, due to high sensitivity of the tracers and established kinetic models for CBF quantification. Because perfusion fluctuates rapidly with time of day, caffeine, and diet2, 3, cross-modality comparisons between MRI and PET/SPECT have been most effective when scans are closely spaced in time4.
The advent of simultaneous PET/MRI enables concurrent CBF observations by each modality and provides the optimal hardware to validate physiological biomarkers. These studies allow parameter optimization of MRI methods (e.g. arterial spin labeling, ASL) through direct statistical comparison with PET CBF5. Interestingly, PET/MRI studies have also highlighted limitations with O-15 PET as a reference, including imperfect tracer extraction and input functions6, 7.
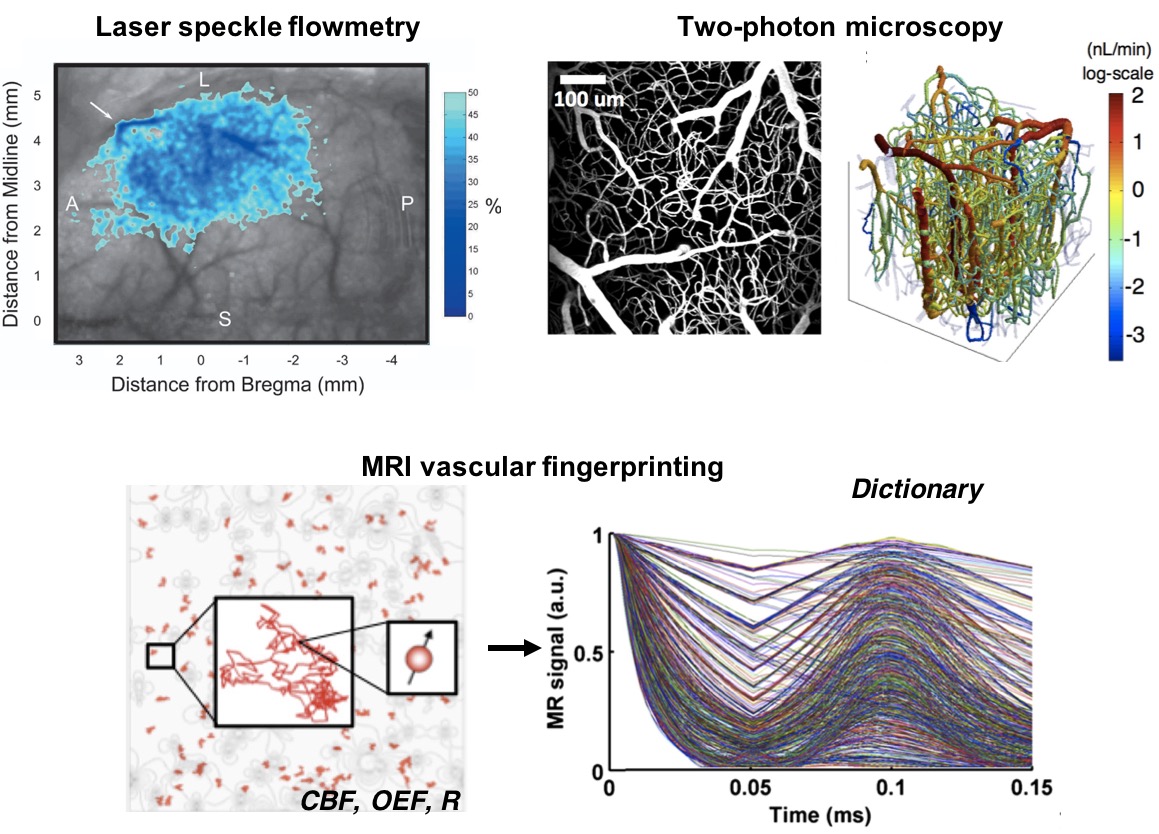
Alternatively, validation of quantitative perfusion at the microvascular (capillary) scale requires a reference standard with spatial resolution on the order of ~100mm. While limited to animal models and surface cortical tissues, near-infrared and photo-acoustic imaging enables visualization of microvasculature and CBF measurement (e.g., through intrinsic optical signals)8. This information will improve MRI kinetic models and biophysical models for MRI fingerprinting of CBF9-11; and ultimately may be combined with high-resolution functional MRI and calcium imaging to confirm neurovascular coupling12.
Patient thresholds and a database approach
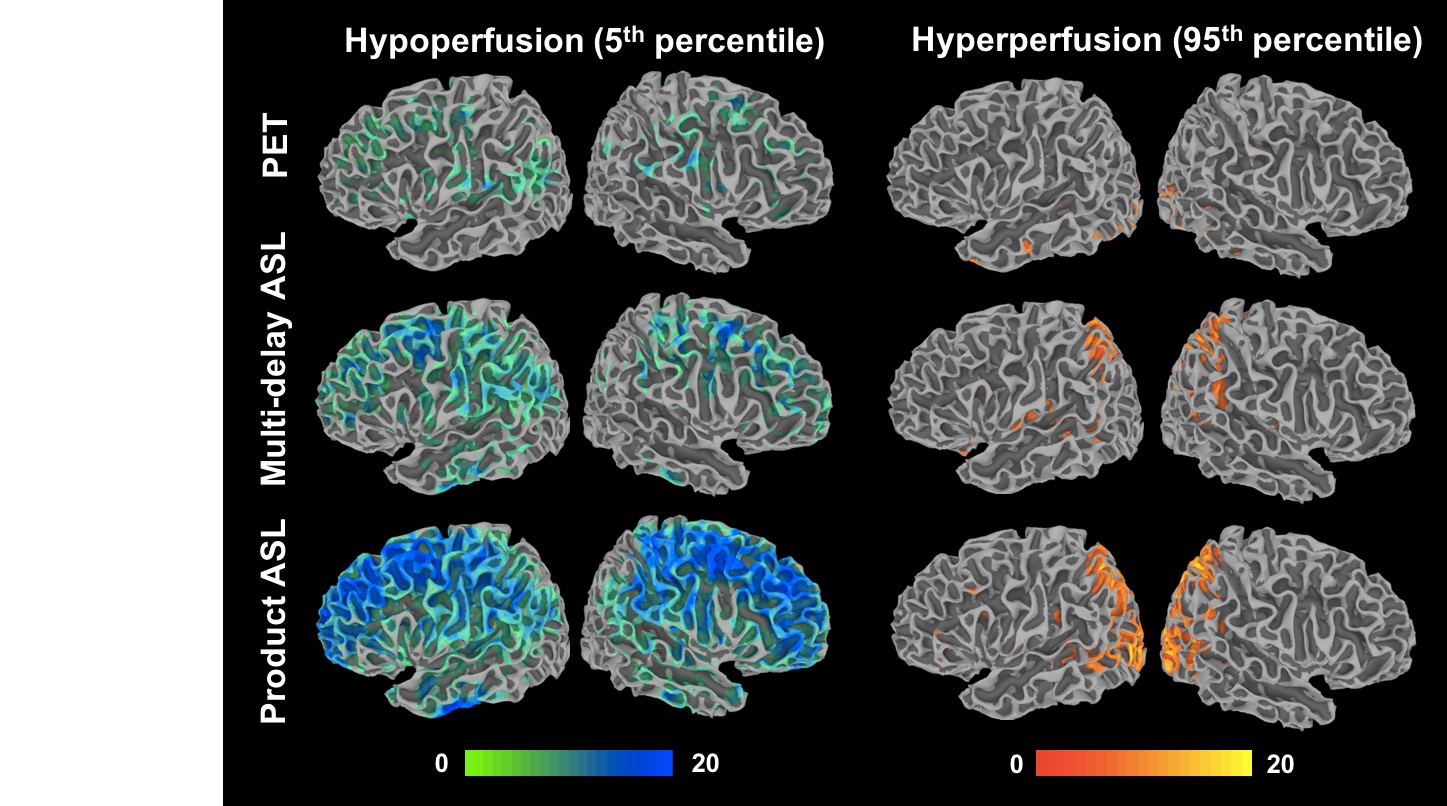
MRI methods to image CBF that have been optimized in healthy populations13 often perform poorly in cerebrovascular disorders and dementia14. For instance, the presence of long arterial transit times in patients with steno-occlusion of cerebral arteries necessitates advanced ASL MRI strategies (e.g., multiple post-label delay scans or velocity-selective pulses) that are insensitive to abnormal transit delays15, 16. Validation studies should therefore consider the patient populations of interest, and also include patients into machine-learning algorithms that seek to improve the quality of perfusion images17, 18.
Furthermore, while radiological assessment of CBF can be qualitative (e.g. hemispheric asymmetry), there is a growing need for a quantitative, threshold-based understanding of CBF19. The recent success of the DAWN and DEFUSE-3 trials20, 21 for acute stroke pioneered the use of MR contrast and CT-based imaging to select patients for new thrombectomy procedures in large-scale, clinical trials. These trials defined thresholds on infarct / diffusion-perfusion mismatch imaging volumes as entry criteria into the study, but lead to the following questions: Can thresholds be defined on CBF images themselves? Are different thresholds relevant for other MRI-based CBF methods and do they identify the same patients for treatment? These questions are answerable through appropriate patient design, comparison with healthy control databases22, and use of multi-modal imaging in future studies.
Cerebrovascular reactivity and challenge studies
The use of physiological challenges to alter CBF expands the dynamic range of perfusion values and improves the validation of perfusion imaging methods. Cerebrovascular reactivity (CVR) to such “stress tests” is an important biomarker on its own, offering distinct information from baseline CBF in aging23, 24 and many neurological disorders25. CVR impairment, especially paradoxical “steal” (decrease) of CBF where augmentation is expected, identifies the most severe cerebrovascular cases with exhausted vessel autoregulation26. Recent MRI perfusion studies have compared different ways to administer the CVR stress test (e.g., breathhold, hypercapnic gas breathing, pharmacological vasodilator) toward consensus guidelines27-29. As CVR will likely play a large clinical role in the future, any perfusion imaging method must be validated in its ability to robustly detect CBF changes, and CVR thresholds may also be defined in future clinical trials30.Future outlook
As the MRI community achieves a careful understanding of the advantages and disadvantages of different perfusion imaging approaches, novel syntheses of these techniques may emerge. For instance, if phase contrast MRI provides reliable global flow scaling while PET reliably assesses regional distribution of flow, a synthesis of the two may be enabled by PET/MRI hybrid scans31. Even if quantitative perfusion measures are not available in a scan session, other proxy measurements (e.g. the early PET tracer distribution at initial time points) may prove valuable32 and should be validated. In this way, the interaction between tracer delivery for imaging, drug delivery for treatment, and flow can be understood as imaging in general (and perfusion imaging specifically) play a larger role in clinical trials.Acknowledgements
Audrey Fan is supported by 1K99NS10288401A1.References
- Wintermark M, Sesay M, Barbier E, Borbely K, Dillon WP, Eastwood JD, et al. Comparative overview of brain perfusion imaging techniques. J Neuroradiol. 2005;32:294-314
- Chen Y, Wang DJ, Detre JA. Test-retest reliability of arterial spin labeling with common labeling strategies. Journal of magnetic resonance imaging : JMRI. 2011;33:940-949
- Parkes LM, Rashid W, Chard DT, Tofts PS. Normal cerebral perfusion measurements using arterial spin labeling: Reproducibility, stability, and age and gender effects. Magnetic resonance in medicine. 2004;51:736-743
- Fan AP, Jahanian H, Holdsworth SJ, Zaharchuk G. Comparison of cerebral blood flow measurement with [15O]-water positron emission tomography and arterial spin labeling magnetic resonance imaging: A systematic review. Journal of cerebral blood flow and metabolism : official journal of the International Society of Cerebral Blood Flow and Metabolism. 2016;36:842-861
- Heijtel DF, Mutsaerts HJ, Bakker E, Schober P, Stevens MF, Petersen ET, et al. Accuracy and precision of pseudo-continuous arterial spin labeling perfusion during baseline and hypercapnia: A head-to-head comparison with (1)(5)o h(2)o positron emission tomography. NeuroImage. 2014;92:182-192
- Khalighi MM, Deller TW, Fan AP, Gulaka PK, Shen B, Singh P, et al. Image-derived input function estimation on a tof-enabled pet/mr for cerebral blood flow mapping. Journal of cerebral blood flow and metabolism : official journal of the International Society of Cerebral Blood Flow and Metabolism. 2018;38:126-135
- Su Y, Arbelaez AM, Benzinger TL, Snyder AZ, Vlassenko AG, Mintun MA, et al. Noninvasive estimation of the arterial input function in positron emission tomography imaging of cerebral blood flow. Journal of cerebral blood flow and metabolism : official journal of the International Society of Cerebral Blood Flow and Metabolism. 2013;33:115-121
- Devor A, Sakadzic S, Srinivasan VJ, Yaseen MA, Nizar K, Saisan PA, et al. Frontiers in optical imaging of cerebral blood flow and metabolism. Journal of cerebral blood flow and metabolism : official journal of the International Society of Cerebral Blood Flow and Metabolism. 2012;32:1259-1276
- Christen T, Pannetier NA, Ni WW, Qiu D, Moseley ME, Schuff N, et al. Mr vascular fingerprinting: A new approach to compute cerebral blood volume, mean vessel radius, and oxygenation maps in the human brain. NeuroImage. 2014;89:262-270
- Wright KL, Jiang Y, Ma D, Noll DC, Griswold MA, Gulani V, et al. Estimation of perfusion properties with mr fingerprinting arterial spin labeling. Magn Reson Imaging. 2018;50:68-77
- Su P, Mao D, Liu P, Li Y, Pinho MC, Welch BG, et al. Multiparametric estimation of brain hemodynamics with mr fingerprinting asl. Magnetic resonance in medicine. 2017;78:1812-1823
- He Y, Wang M, Chen X, Pohmann R, Polimeni JR, Scheffler K, et al. Ultra-slow single-vessel bold and cbv-based fmri spatiotemporal dynamics and their correlation with neuronal intracellular calcium signals. Neuron. 2018;97:925-939 e925
- Alsop DC, Detre JA, Golay X, Gunther M, Hendrikse J, Hernandez-Garcia L, et al. Recommended implementation of arterial spin-labeled perfusion mri for clinical applications: A consensus of the ismrm perfusion study group and the european consortium for asl in dementia. Magnetic resonance in medicine. 2015;73:102-116
- Amukotuwa SA, Yu C, Zaharchuk G. 3d pseudocontinuous arterial spin labeling in routine clinical practice: A review of clinically significant artifacts. Journal of magnetic resonance imaging : JMRI. 2016;43:11-27
- Qiu D, Straka M, Zun Z, Bammer R, Moseley ME, Zaharchuk G. Cbf measurements using multidelay pseudocontinuous and velocity-selective arterial spin labeling in patients with long arterial transit delays: Comparison with xenon ct cbf. Journal of magnetic resonance imaging : JMRI. 2012;36:110-119
- Fan AP, Guo J, Khalighi MM, Gulaka PK, Shen B, Park JH, et al. Long-delay arterial spin labeling provides more accurate cerebral blood flow measurements in moyamoya patients: A simultaneous positron emission tomography/mri study. Stroke; a journal of cerebral circulation. 2017;48:2441-2449
- Kim KH, Choi SH, Park SH. Improving arterial spin labeling by using deep learning. Radiology. 2018;287:658-666
- Guo J, Gong E, Goubran M, Fan AP, Khalighi MM, Zaharchuk G. Improving perfusion image quality and quantification accuracy using multi-contrast MRI and deep convolutional neural network. Proc International Society of Magnetic Resonance in Medicine. 2018
- Yu S, Ma SJ, Liebeskind DS, Yu D, Li N, Qiao XJ, et al. Aspects-based reperfusion status on arterial spin labeling is associated with clinical outcome in acute ischemic stroke patients. Journal of cerebral blood flow and metabolism : official journal of the International Society of Cerebral Blood Flow and Metabolism. 2018;38:382-392
- Albers GW, Marks MP, Kemp S, Christensen S, Tsai JP, Ortega-Gutierrez S, et al. Thrombectomy for stroke at 6 to 16 hours with selection by perfusion imaging. The New England journal of medicine. 2018;378:708-718
- Jovin TG, Saver JL, Ribo M, Pereira V, Furlan A, Bonafe A, et al. Diffusion-weighted imaging or computerized tomography perfusion assessment with clinical mismatch in the triage of wake up and late presenting strokes undergoing neurointervention with trevo (dawn) trial methods. Int J Stroke. 2017;12:641-652
- Shin DD, Ozyurt IB, Brown GG, Fennema-Notestine C, Liu TT. The cerebral blood flow biomedical informatics research network (cbfbirn) data repository. NeuroImage. 2016;124:1202-1207
- Richiardi J, Monsch AU, Haas T, Barkhof F, Van de Ville D, Radu EW, et al. Altered cerebrovascular reactivity velocity in mild cognitive impairment and alzheimer's disease. Neurobiol Aging. 2015;36:33-41
- Suri S, Mackay CE, Kelly ME, Germuska M, Tunbridge EM, Frisoni GB, et al. Reduced cerebrovascular reactivity in young adults carrying the apoe epsilon4 allele. Alzheimers Dement. 2015;11:648-657 e641
- Liu P, J BDV, Lu H. Cerebrovascular reactivity (cvr) mri with co2 challenge: A technical review. NeuroImage. 2018
- Gupta A, Chazen JL, Hartman M, Delgado D, Anumula N, Shao H, et al. Cerebrovascular reserve and stroke risk in patients with carotid stenosis or occlusion: A systematic review and meta-analysis. Stroke; a journal of cerebral circulation. 2012;43:2884-2891
- Fierstra J, Sobczyk O, Battisti-Charbonney A, Mandell DM, Poublanc J, Crawley AP, et al. Measuring cerebrovascular reactivity: What stimulus to use? J Physiol. 2013;591:5809-5821
- Bright MG, Murphy K. Reliable quantification of bold fmri cerebrovascular reactivity despite poor breath-hold performance. NeuroImage. 2013;83:559-568
- Tancredi FB, Hoge RD. Comparison of cerebral vascular reactivity measures obtained using breath-holding and co2 inhalation. Journal of cerebral blood flow and metabolism : official journal of the International Society of Cerebral Blood Flow and Metabolism. 2013;33:1066-1074
- Fierstra J, van Niftrik C, Warnock G, Wegener S, Piccirelli M, Pangalu A, et al. Staging hemodynamic failure with blood oxygen-level-dependent functional magnetic resonance imaging cerebrovascular reactivity: A comparison versus gold standard ((15)o-)h2o-positron emission tomography. Stroke; a journal of cerebral circulation. 2018;49:621-629
- Ssali T, Anazodo UC, Thiessen JD, Prato FS, St Lawrence K. A non-invasive method for quantifying cerebral blood flow by hybrid pet/mr. Journal of nuclear medicine : official publication, Society of Nuclear Medicine. 2018
- Zaharchuk G, Fan AP, Gulaka P, Guo J, Poston K, Grecius M, et al. Early uptake amyloid PET correlates strongly with cerebral blood flow based on arterial spin labeling MRI: A simultaneous PET/MRI study. Journal of Cerebral Blood Flow and Metabolism. 2017;37:224-225
Figures