ASL Post-Processing & Modeling (with Demo)
1Institute of Biomedical Engineering, University of Oxford, Oxford, United Kingdom
Synopsis
The aim of this talk is to introduce the key steps involved in the analysis of ASL data to produce a perfusion-weighted image, a full quantified perfusion image and even images of other haemodynamic parameters. We will see that ASL analysis is for the most part quite simple and eve more advance methods are quite accessible through software tools that are now freely available.
Target audience
Clinicians and basic scientists interested in imaging perfusion using Arterial Spin Labelling both within individual patients and as part of group/population studies.Purpose
The aim of this short talk is to introduce the key concepts behind the quantification of perfusion, as well as other haemodynamic parameters, when using Arterial Spin Labelling (ASL). At the same time we will look at how this can be done using a freely available software tool. We will also consider some of the corrections that you might want to carry out as part of the analysis of ASL data to achieve the most robust and accurate estimates in the final images.Objectives
- Illustrate how simple it is to generate a perfusion-weighted image from ASL data via subtraction.
- Introduce tracer kinetics for ASL and explain the role of a tracer kinetic model in perfusion quantification for ASL.
- Introduce methods for calibration using ASL data to compute perfusion in absolute units (ml/100g/min).
- Consider other post-processing corrections including motion, distortion and partial volume correction.
- Consider robust ways to transform data into a template space and the pitfalls of group analysis with ASL.
Overview
In essence the analysis of ASL data to obtain quantitative measurements of perfusion within an individual can be thought of as taking three stages:
- label-control subtraction,
- kinetic model inversion,
- calibration (calculation of arterial magnetisation).
In this talk we will briefly consider all three steps. We will look at the underlying theory and determine what information is needed, in terms of data and knowledge of the acquisition, to successfully perform an analysis for yourself. We will also look at how to do this using a widely available software tool.
We will also consider specific challenges with ASL perfusion data when performing a group analysis, particularly in the process of registration to a template space.
Finally, we will briefly consider some of other corrections that you may wish to perform on your data to increase the robustness and accuracy of your measurements and the statistical power to detect changes or differences in a group study. Including correction for motion, distortion and partial volume effects.
Software
The following is a non-exhaustive list of software tools available for the analysis of ASL data. The main scanner manufacturers now have in-built tools for basic perfusion-weighted image generation, but more options are generally available if you export the data and analyse it yourself.
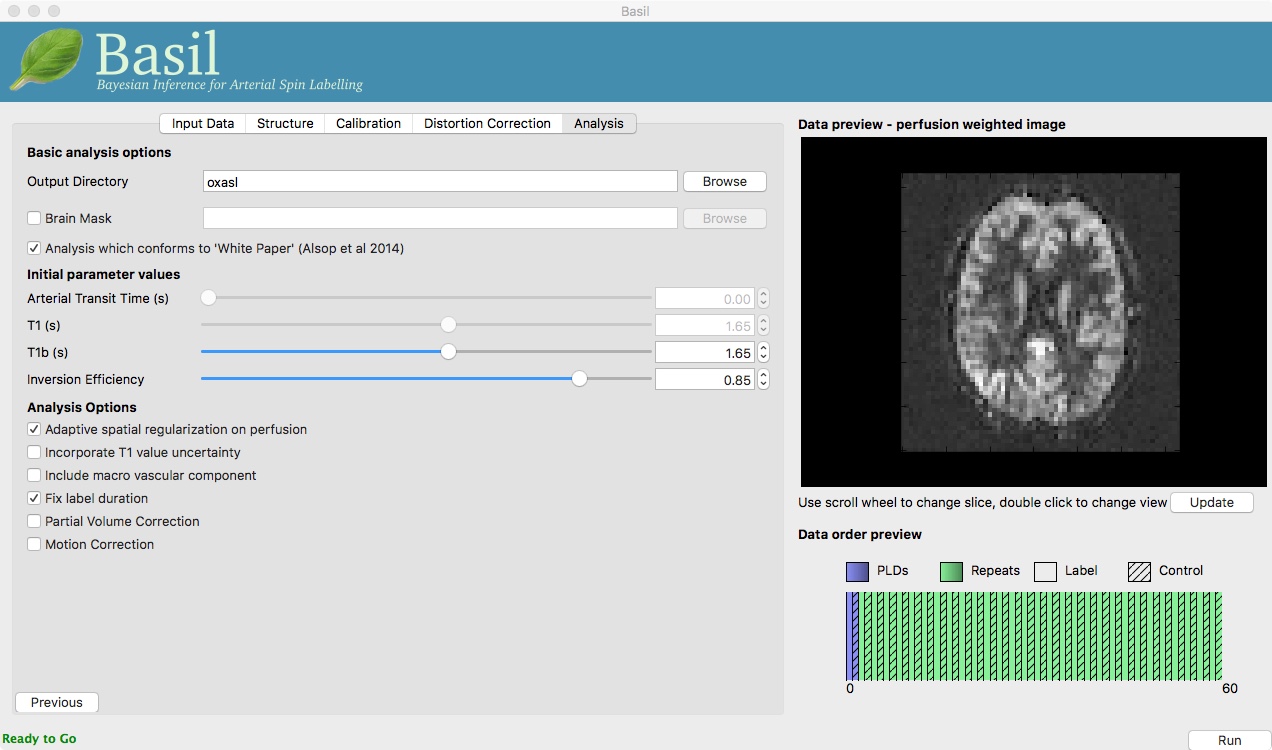
BASIL, part of the FMRIB Software Library (FSL) (https://fsl.fmrib.ox.ac.uk/fsl/fslwiki/BASIL). We will look at the recently released GUI for BASIL as part of the talk.
ASLtbx, a SPM plugin (https://cfn.upenn.edu/~zewang/ASLtbx.php).
ASAP, a SPM plugin that also exploits FSL tools (https://cfn.upenn.edu/~zewang/ASLtbx.php).
Acknowledgements
Thomas Okell, Bradley MacIntosh, Mark Jenkinson, Martin Craig.References
The following are useful further reading related to ASL analysis:
Introduction to Perfusion Quantification using Arterial Spin Labelling. Chappell, MacIntosh & Okell, Oxford University Press, 2017. http://www.neuroimagingprimers.org/ (freely available tutorial exercises for ASL using BASIL tools available via the website).
Recommended implementation of arterial spin‐labeled perfusion MRI for clinical applications: A consensus of the ISMRM perfusion study group and the European consortium for ASL in dementia. Alsop et al., Magnetic Resonance in Medicine, 73(1), 102–116, 2015. http://doi.org/10.1002/mrm.25197
Introduction to Functional Magnetic Resonance Imaging: Principles and Techniques (2nd ed.). Buxton, Cambridge University Press, 2009.
Figures
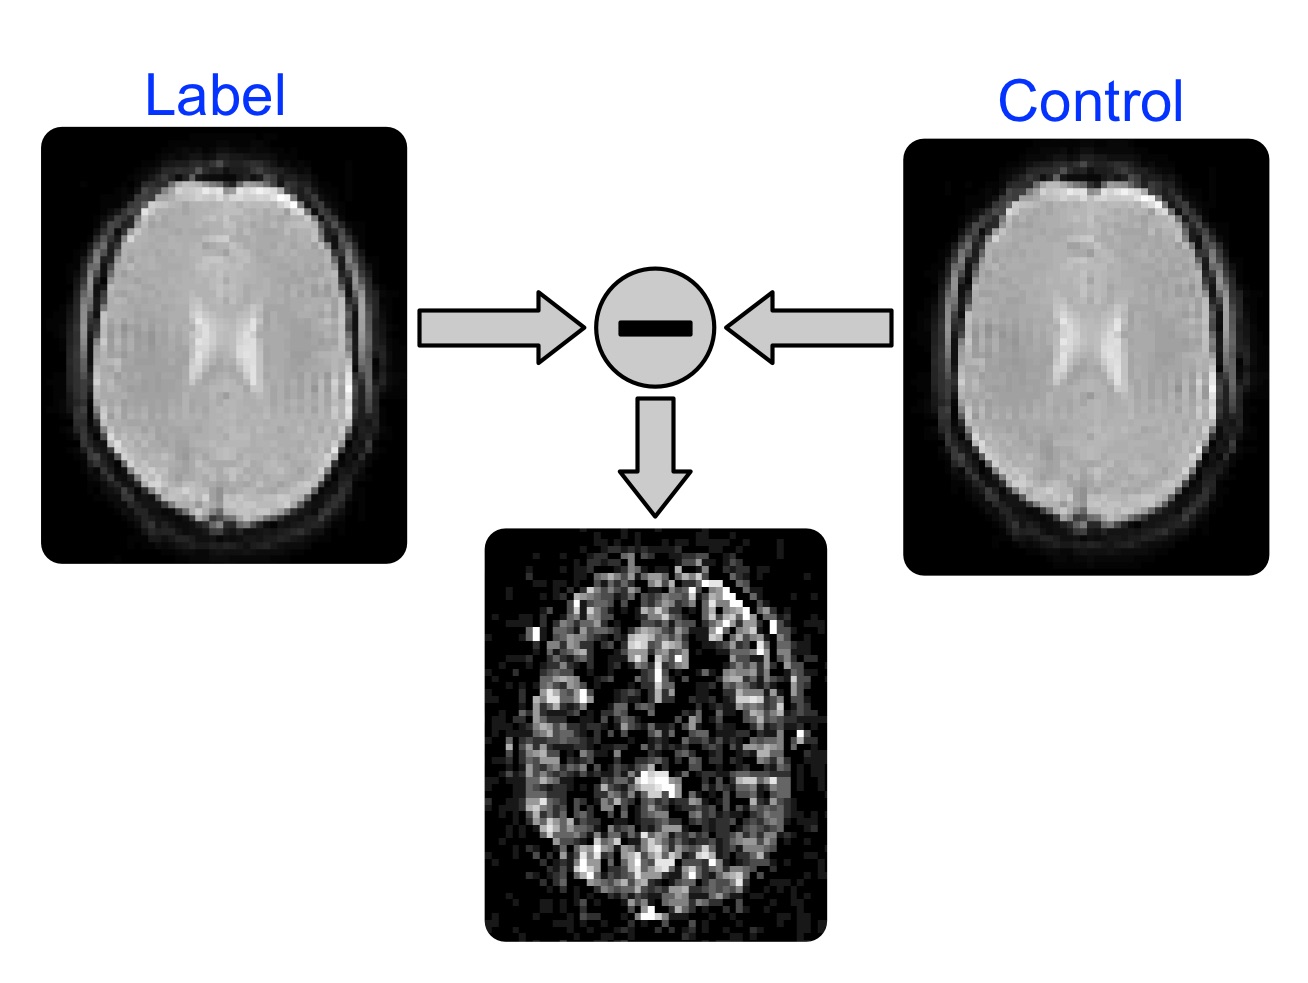
Figure 1: Illustration of label-control subtraction to produce a perfusion-weighted image.
Reproduced with permission, Introduction to Perfusion Quantification using Arterial Spin Labeling, OUP, 2017.
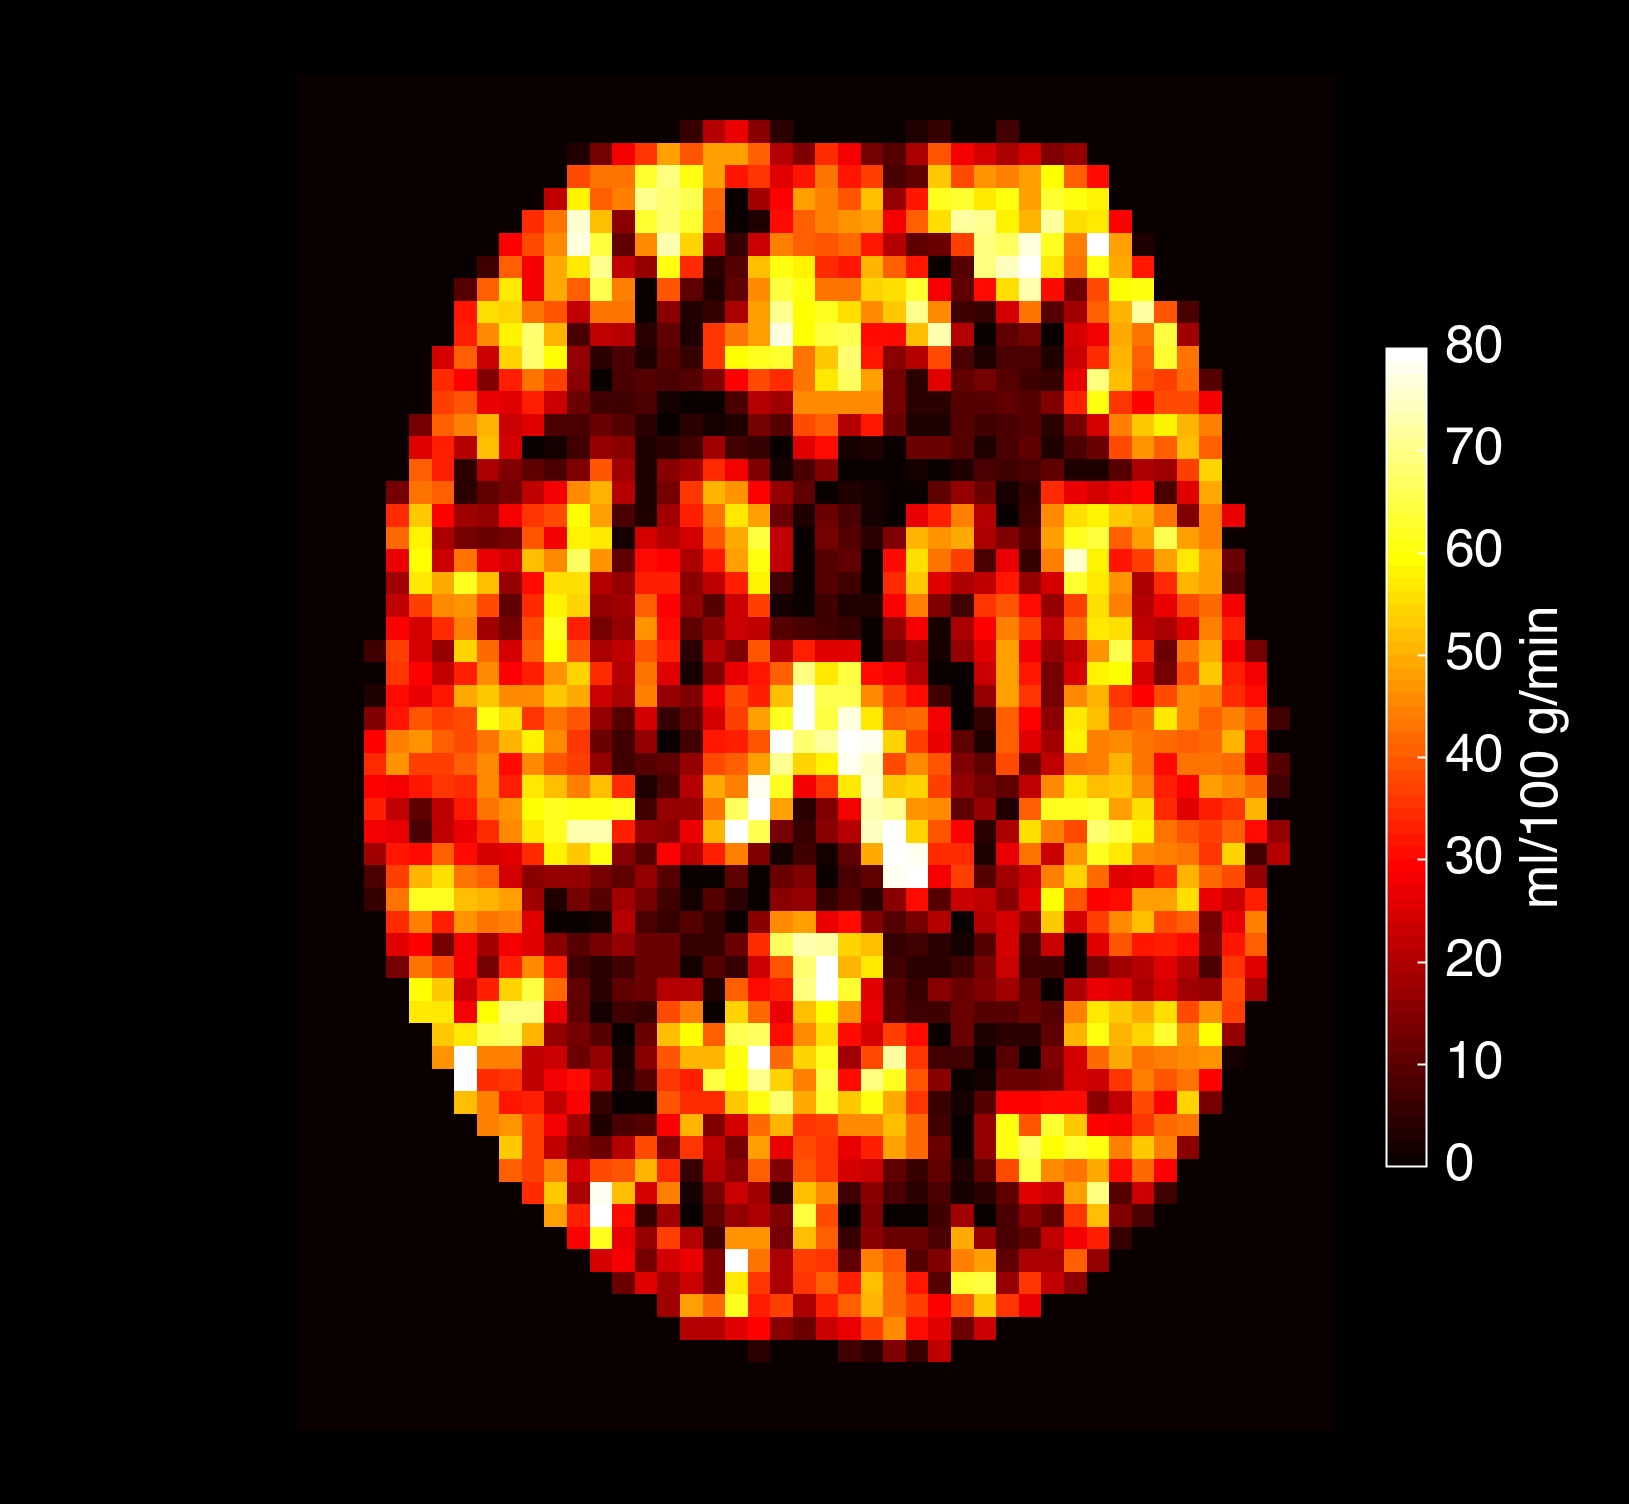
Figure 2: A single slice from a fully quantified (and corrected) ASL perfusion image in units of ml/100g/min.
Reproduced with permission, Introduction to Perfusion Quantification using Arterial Spin Labeling, OUP, 2017.