MR Spectroscopy - The Forgotten Molecular Imaging Modality
1Yale University School of Medicine, United States
Synopsis
MR-based molecular imaging typically relies on the high detection sensitivity of water to indirectly observe the underlying molecular and cellular processes. The ubiquitous presence of water demands that image contrast and specificity is obtained through molecular imaging probe design. MR spectroscopy uses the intrinsic specificity provided by the chemical shift to allow detection of a wide range of metabolites and metabolic pathways. When combined with spatial imaging gradients, MR-based metabolic imaging can provide a unique and complementary addition to the arsenal of molecular imaging techniques.
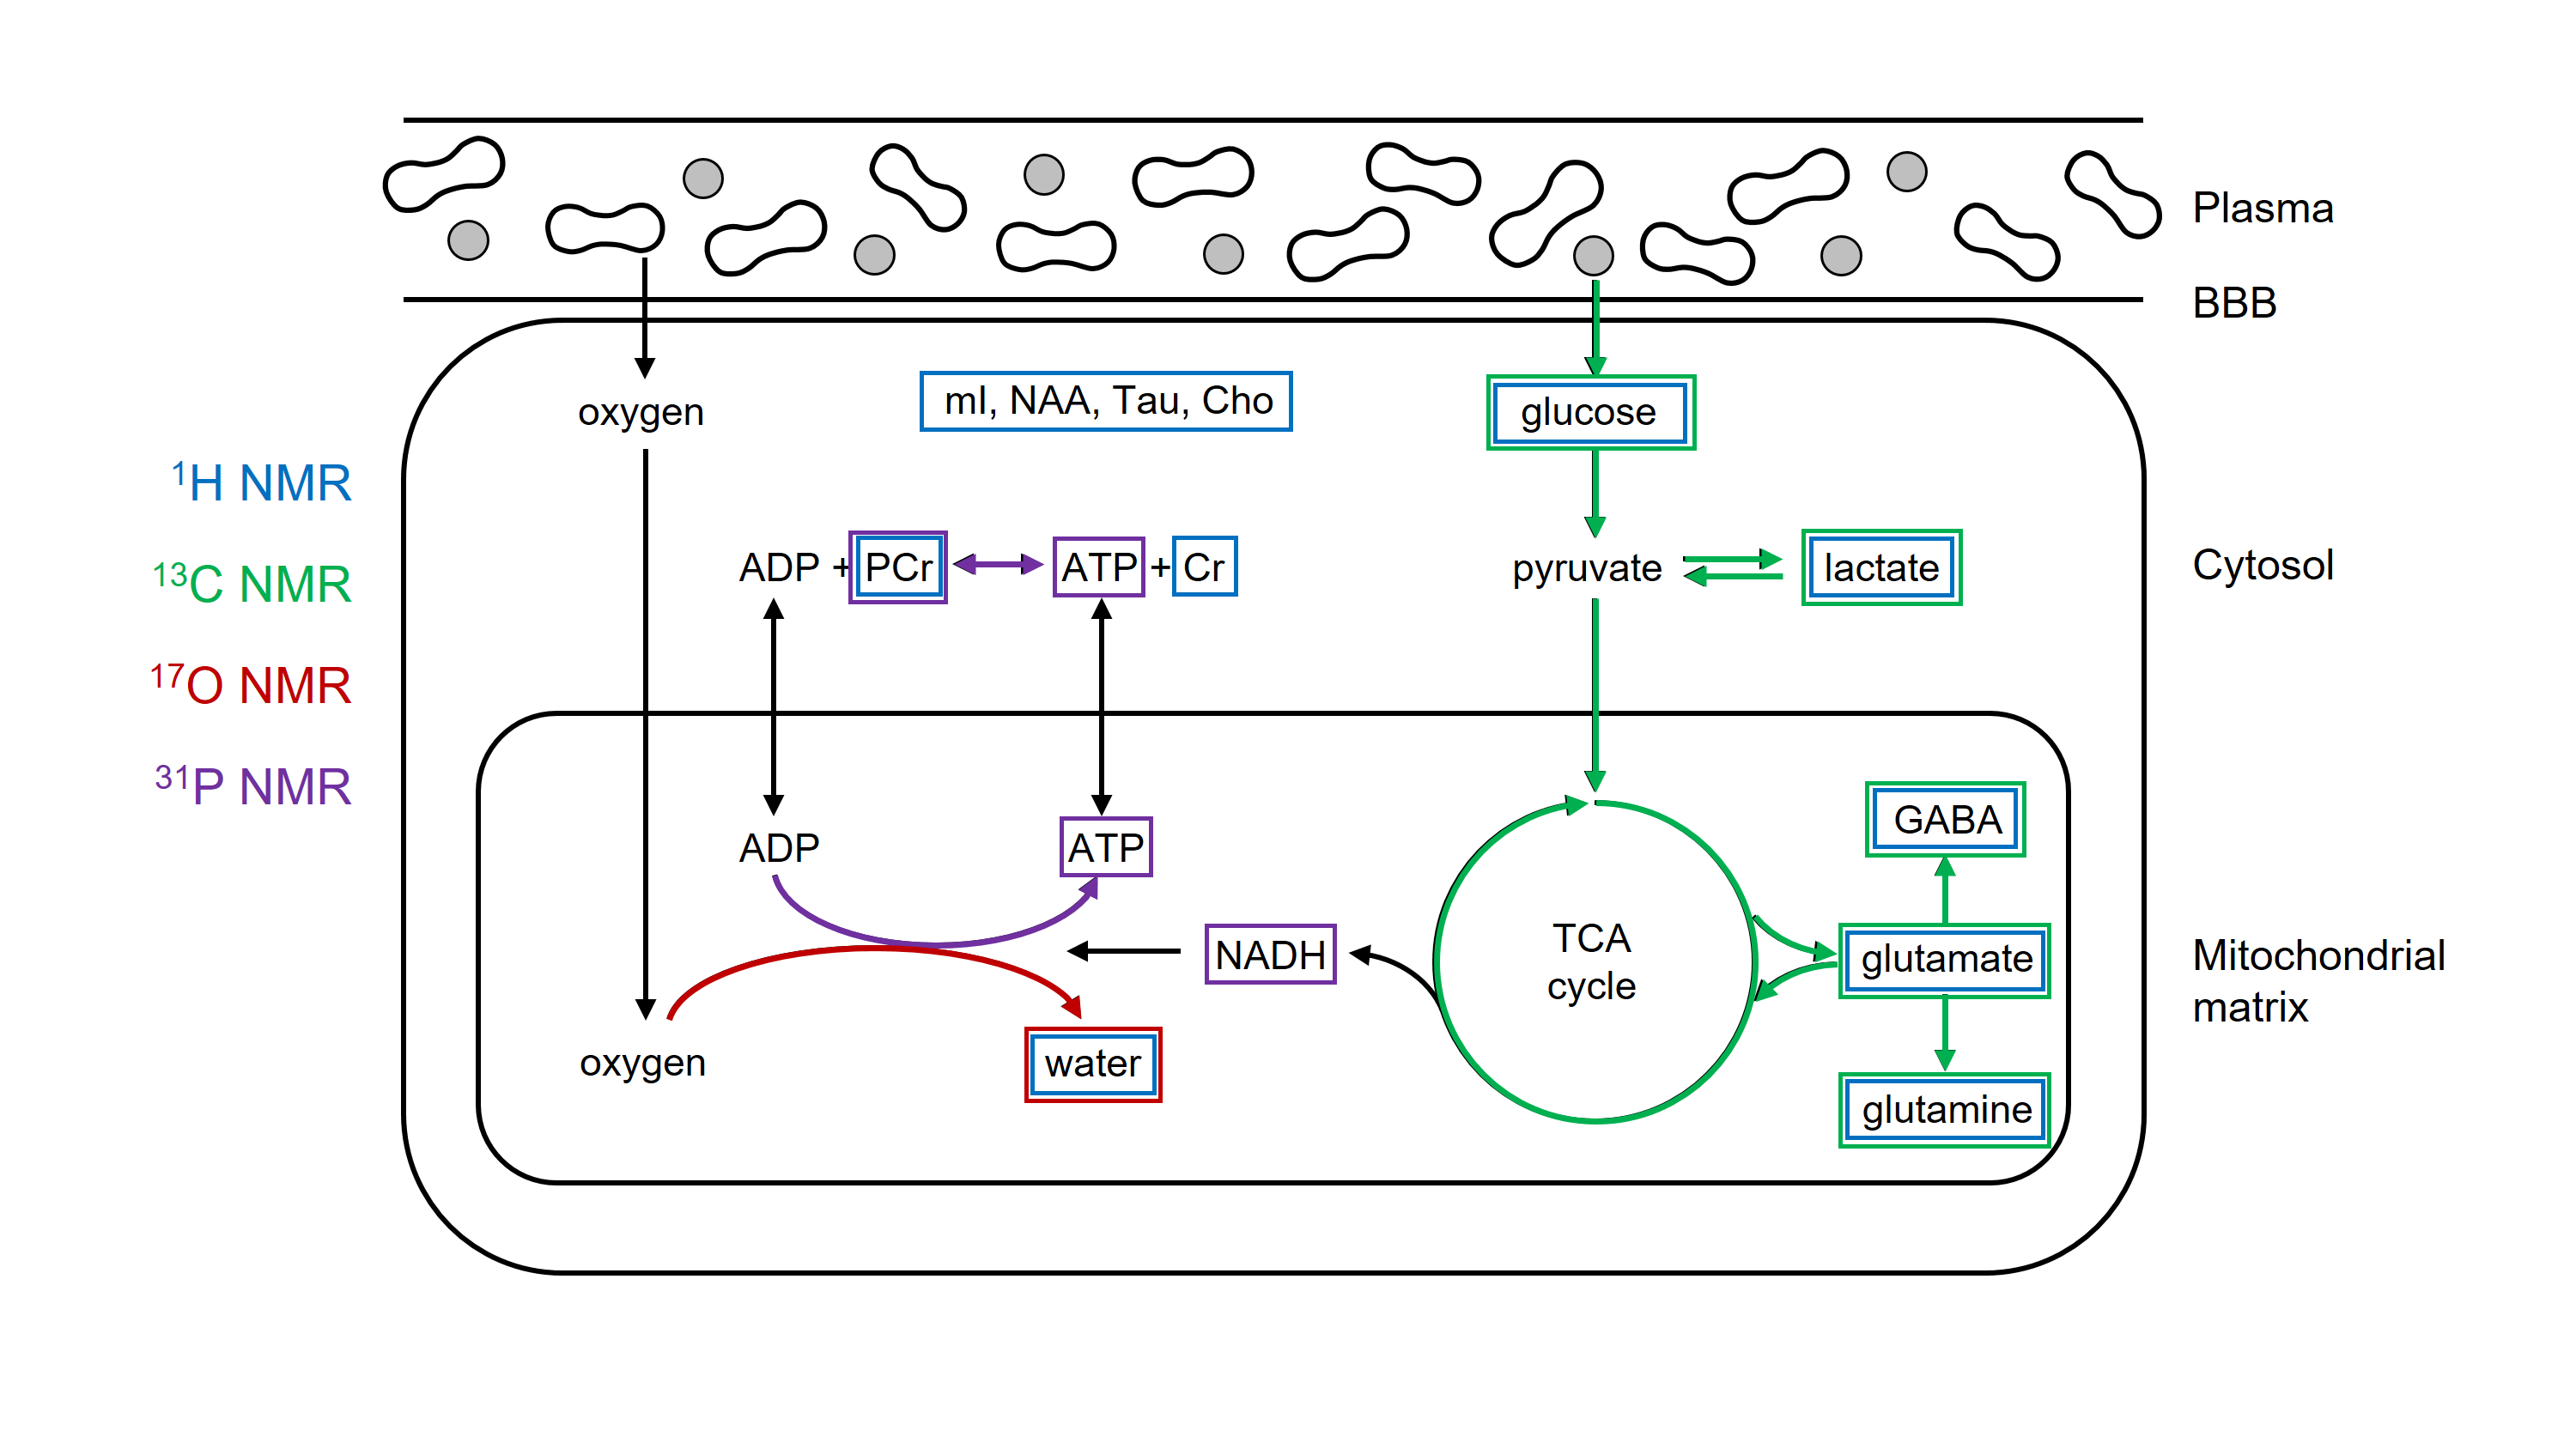
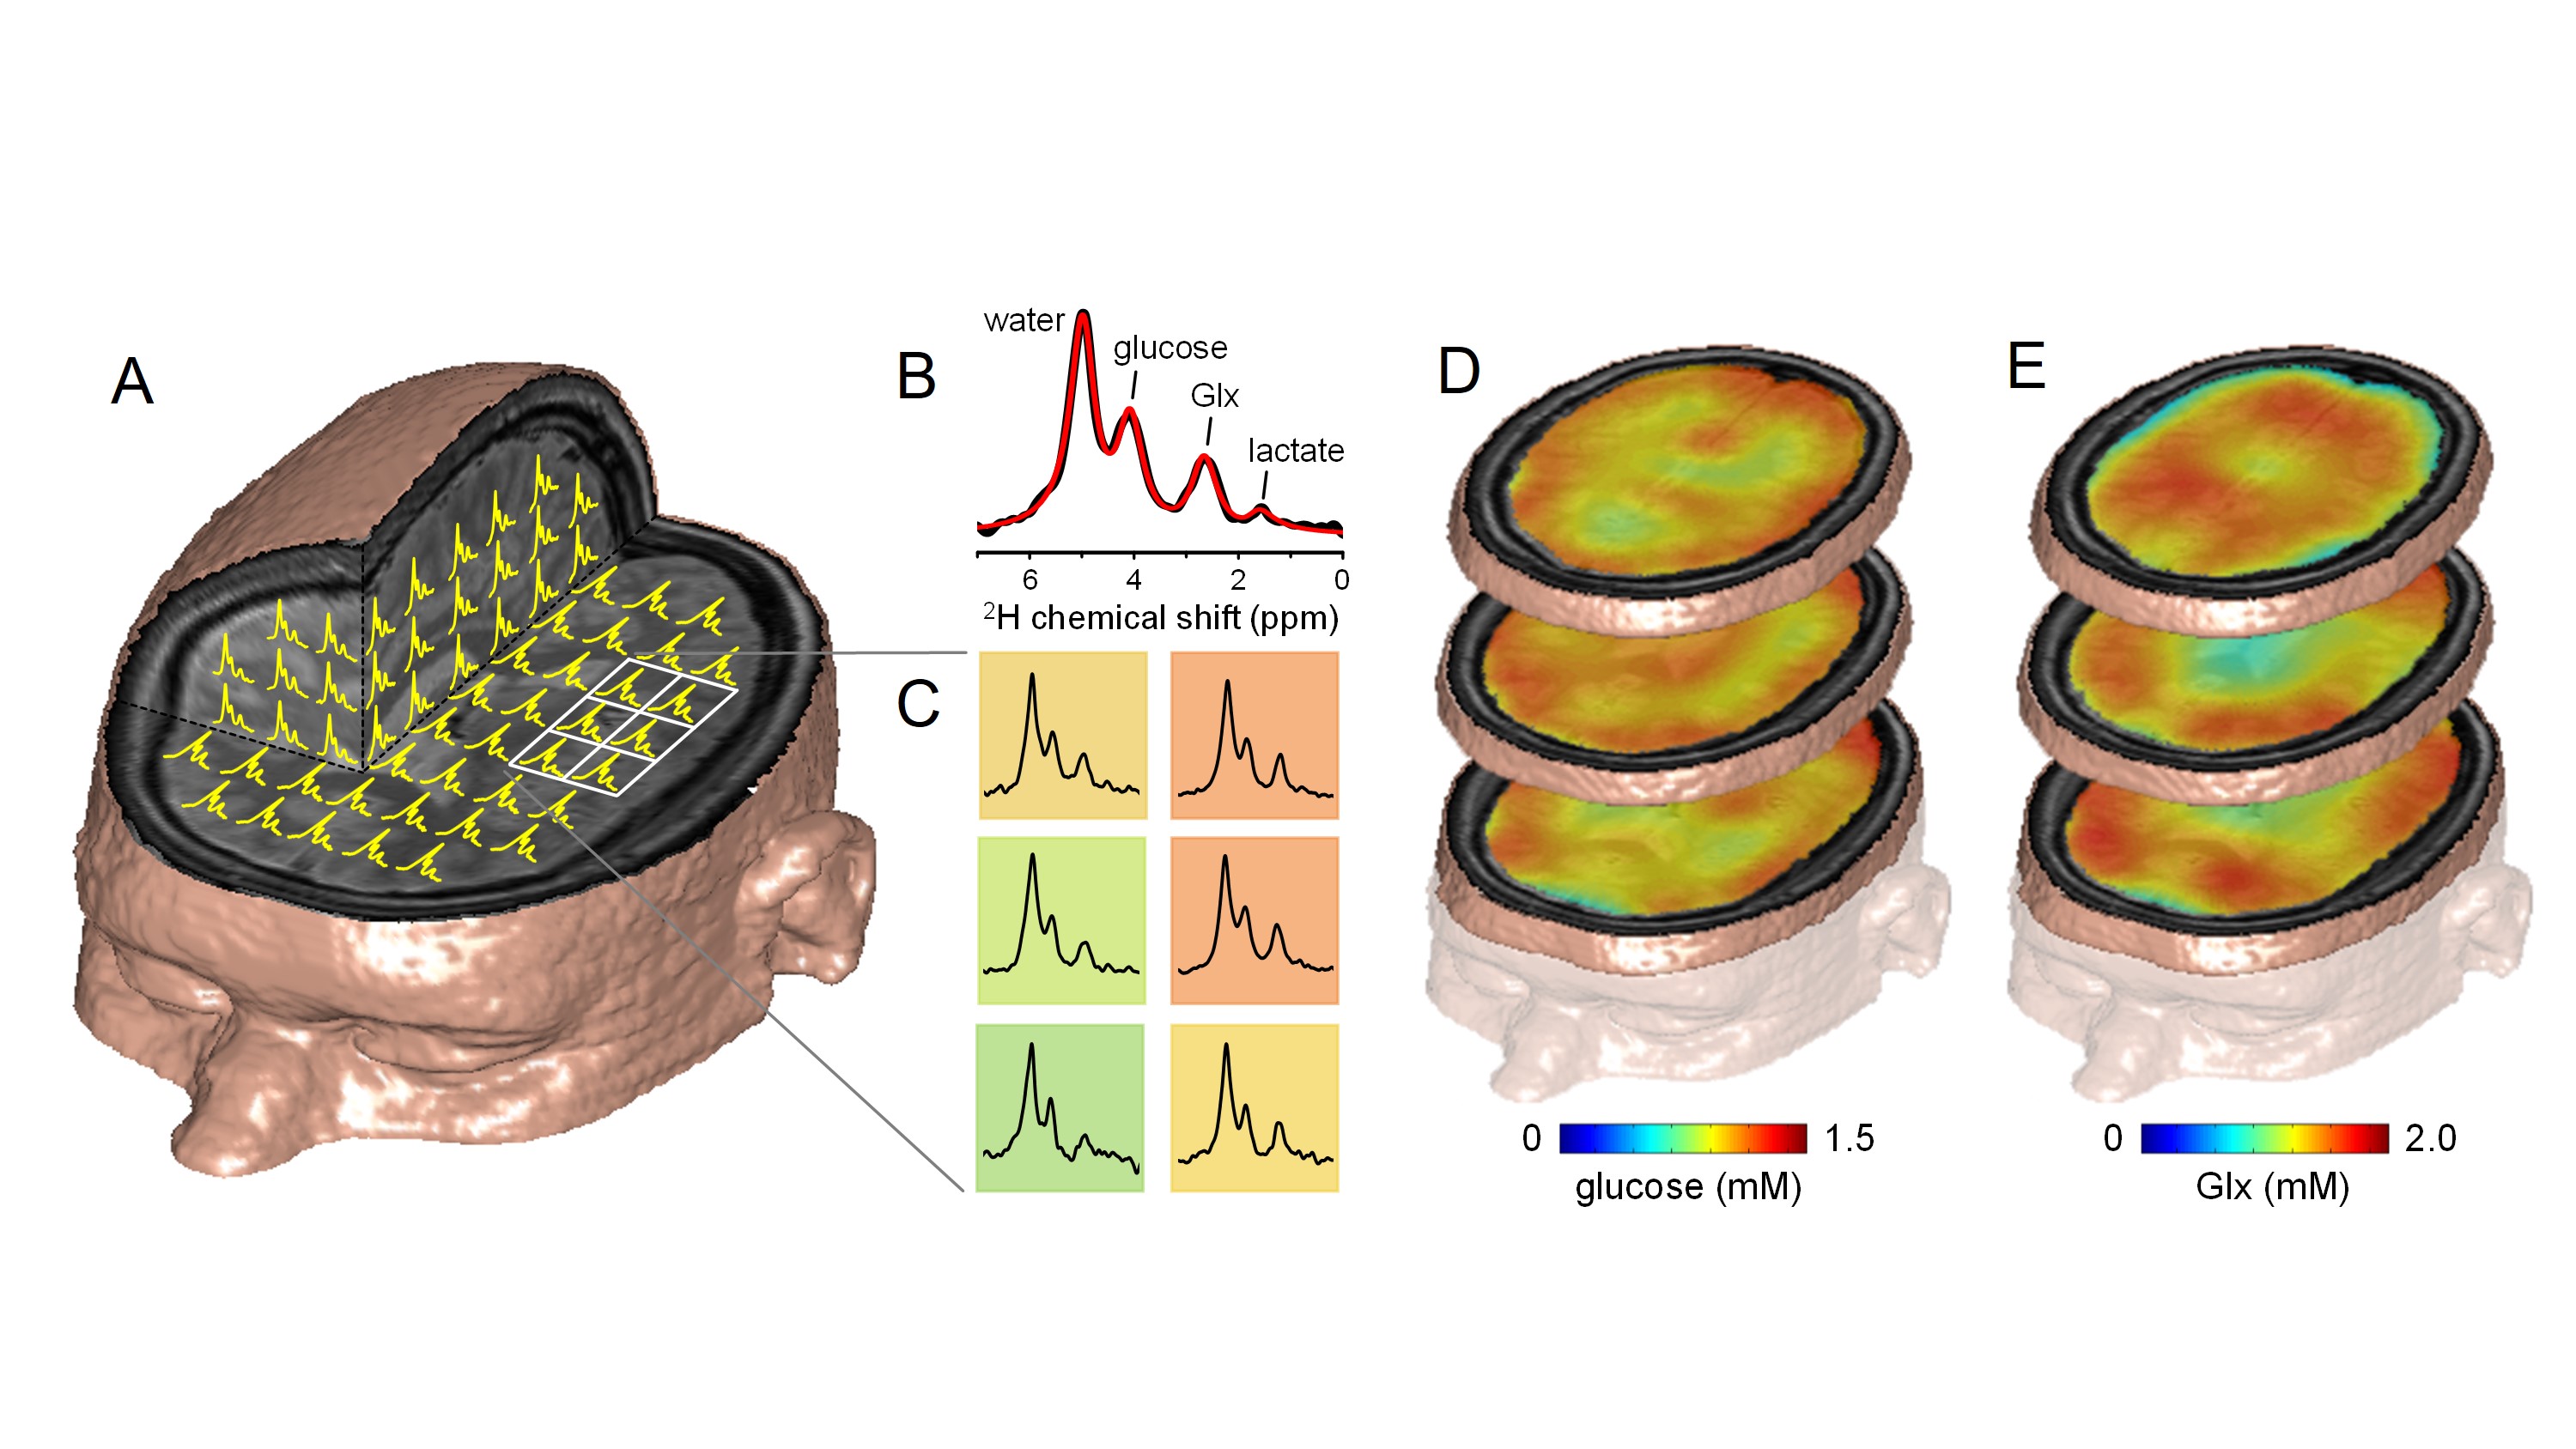
Molecular imaging can be defined as the visualization of molecular and cellular function in living organisms through macroscopic imaging. MR-based molecular imaging typically relies on the high detection sensitivity of water to indirectly observe the underlying molecular and cellular processes. The ubiquitous presence of water demands that image contrast and specificity is obtained through molecular imaging probe design. When looking beyond water, the NMR chemical shift phenomenon provides a high, intrinsic specificity that allows detection of a wide range of metabolites and metabolic processes with NMR spectroscopy (MRS). Traditionally, the chemical shift dispersion is emphasized in the form of a NMR spectrum, thereby largely disguising the spatial information. However, spatial information can be combined with chemical information in the form of MR spectroscopic imaging (MRSI). Any MRS pulse sequence can be modified into a MRSI method by adding phase-encoding gradients. Realistic expectations should be set with regards to spatial and temporal resolution of MRSI. Since typical metabolite levels are over a thousand times lower than water, the spatial resolution has to be decreased proportional. For a typical 1 x 1 x 1 mm = 1 µL MRI pixel resolution, the MRSI resolution should be reduced to 10 x 10 x 10 mm = 1 mL pixel volumes. For a wide range of pathologies, a nominal volume of 1 mL is adequate to allow disease characterization and follow therapy response. The information content of MRSI depends on the nucleus studied and the perturbations applied. Figure 1 shows the metabolites and metabolic pathways in a generic ‘brain’ cell that can be detected with proton and heteronuclear MRS. Proton MRS excels at the detection of total metabolite concentrations related to energy metabolism (glucose, phosphocreatine, lactate), neurotransmission (glutamate, glutamine, GABA) and cell specific compounds (N-acetyl aspartate, myo-inositol). An important aspect of metabolism is the dynamic conversion of metabolites via metabolic pathways such as glycolysis and the tricarboxylic acid (TCA) cycle. Whereas proton MRS can detect the total metabolic pools with concentrations above the MR detection threshold, proton MRS is not sensitive to the dynamic fluxes through the various metabolic pathways. Similar to proton NMR, phosphorus 31P NMR can also detect the total concentration of metabolic pools involved in energy metabolism (ATP, phosphocreatine, NAD+/NADH, inorganic phosphate). In addition, 31P NMR can be sensitized to metabolic fluxes with magnetization transfer methods in which the perturbation of one metabolite (e.g. PCr) leads to a reduction in another metabolite (e.g. ATP) as the perturbed magnetization is transferred between the two exchanging pools. Magnetization transfer methods are only applicable when the exchange rate between the pools is much faster than signal recovery due to T1 relaxation. The metabolic processes detectable with 1H MRS are generally too slow to be studied with magnetization transfer. Slower metabolic processes can be studied with isotope labeling strategies. In this approach a metabolic substrate (e.g. glucose) is replaced with an isotopically-enriched substrate (e.g. [1-13C]-glucose) via intravenous infusion or oral administration. The isotopic 13C label can be followed over time with 13C MRS as the label is transferred from the substrate to downstream metabolic products, such as [3-13C]-lactate in the case of glycolysis. The rate of 13C label accumulation in downstream product is a measure of the metabolic flux through the pathway that can be extracted via metabolic modeling. The isotope labeling method allows the detection of a wide range of metabolic rates, spanning from minutes (glycolysis) to hours (TCA cycle, glycogen synthesis) to days (lipid synthesis). The majority of isotope labeling studies have been performed with 13C NMR due to the ubiquity of the carbon skeleton in the majority of metabolites. However, the approach is equally valid using 17O NMR to follow the fate of 17O-labeled inhaled oxygen gas. Deuterium (2H) NMR offers a high-sensitive, robust alternative to 13C-based metabolic imaging (Figure 2). NMR spectroscopy provides a unique tool to detect and study a wide range of metabolic processes in vivo. In contrast to indirect detection via the water signal, NMR spectroscopy provides a direct method to detect metabolism ‘in action’. MRSI data displayed as metabolic images (Fig. 2) provides a framework that is more familiar for researchers and clinicians working with MRI and other imaging modalities. When used in metabolic imaging mode, MR spectroscopy becomes comparable to MR imaging, while providing unique metabolic information.
Acknowledgements
No acknowledgement found.References
No reference found.Figures