Diffusion & Perfusion Weighted Imaging
1Department of Anatomy and Medical Imaging, School of Medical Sciences, The University of Auckland, New Zealand
Synopsis
This lecture is devoted to the basic technological aspects of diffusion-weighted imaging (DWI) and perfusion-weighted imaging (PWI) approaches used in MRI, using neuroimaging applications as examples, and with the concepts explained with minimal use of equations. PWI approaches covered are: dynamic susceptibility contrast (DSC) perfusion, dynamic contrast enhanced (DCE) perfusion, Arterial Spin Labeling (ASL), and the Intravoxel Incoherent Motion (IVIM) method.
Background
Diffusion-weighted imaging (DWI) [1-6] is one of the most important contrast mechanisms in MRI. It has revolutionised the detection of pathologic conditions physiologic mechanisms sensitive for diffusion abnormality, such as in stroke, seizure, trauma, demyelination, tumors, infection, and others. More extended diffusion-weighted scans, such as Diffusion Tensor Imaging (DTI) [7] (including extra processing of DTI to yield fiber tractography images) allow clinicians to evaluate the degree and spatial distribution of anisotropic diffusion, providing further insights into the microscopic architecture of the brain, including the orientation of large white matter pathways. DTI has been used to examine areas of subtle neural degeneration and demyelination in diseases like multiple sclerosis, and is currently part of many clinical MRI protocols.
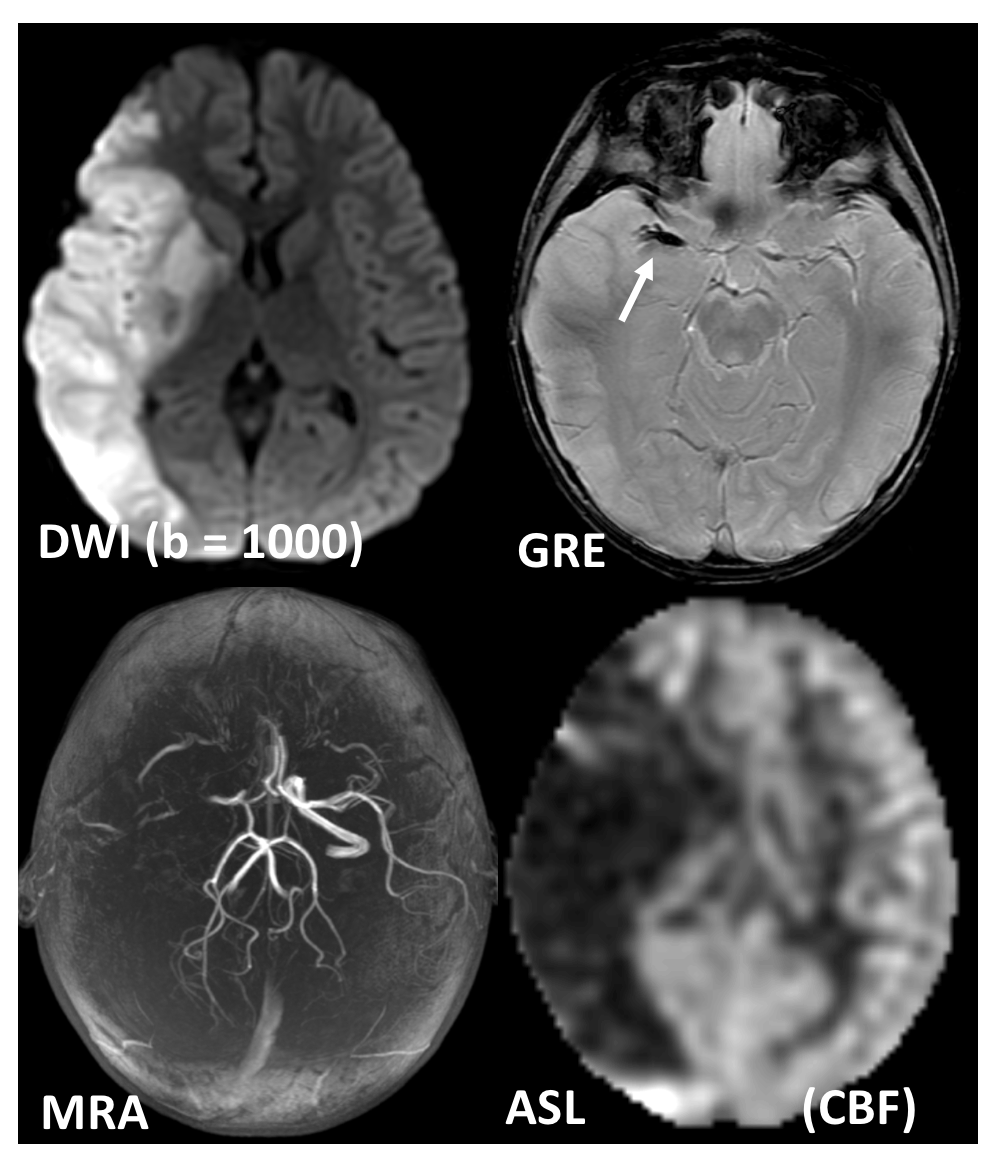
Perfusion-weighted imaging (PWI) is an MRI technology that studies cerebral hemodynamics and blood flow [8-9]. PWI provides information on hypoperfused areas of brain tissue. It is used in the evaluation of focal brain lesions, primary tumors, in the differentiation of tumor recurrence and radionecrosis, and others. PWI is often combined with other MR techniques like magnetic resonance angiography (MRA) to assess vessel patency, and DWI to identify areas of reversible ischemia early before it progresses to permanent infarction [10-12].
Diffusion-weighted imaging
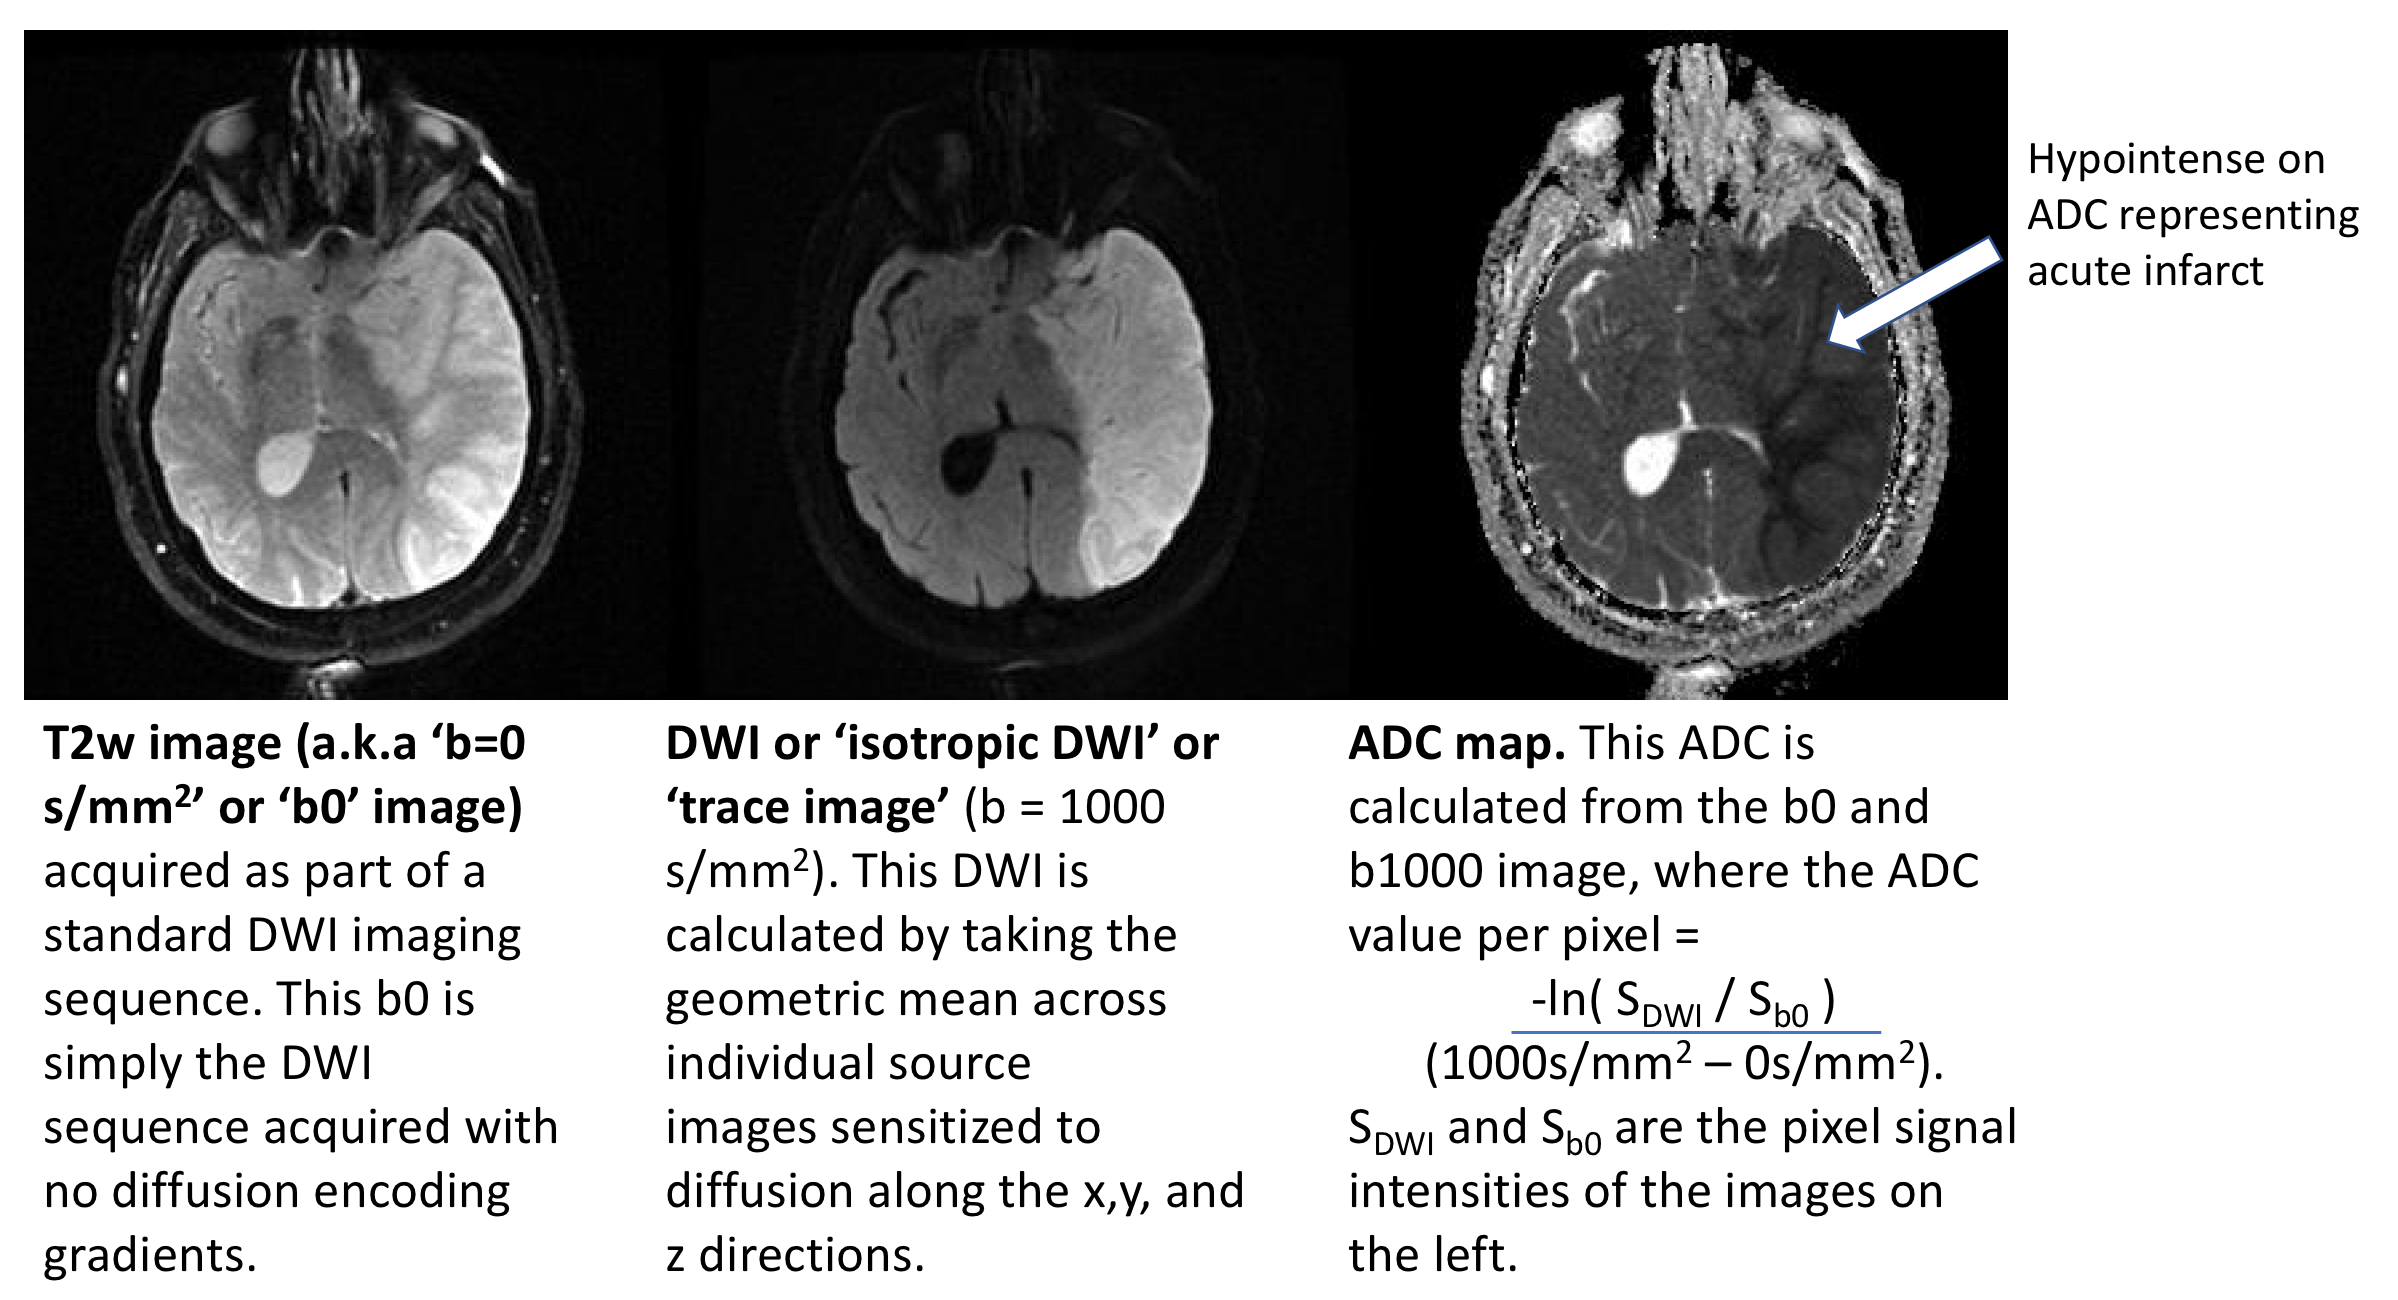
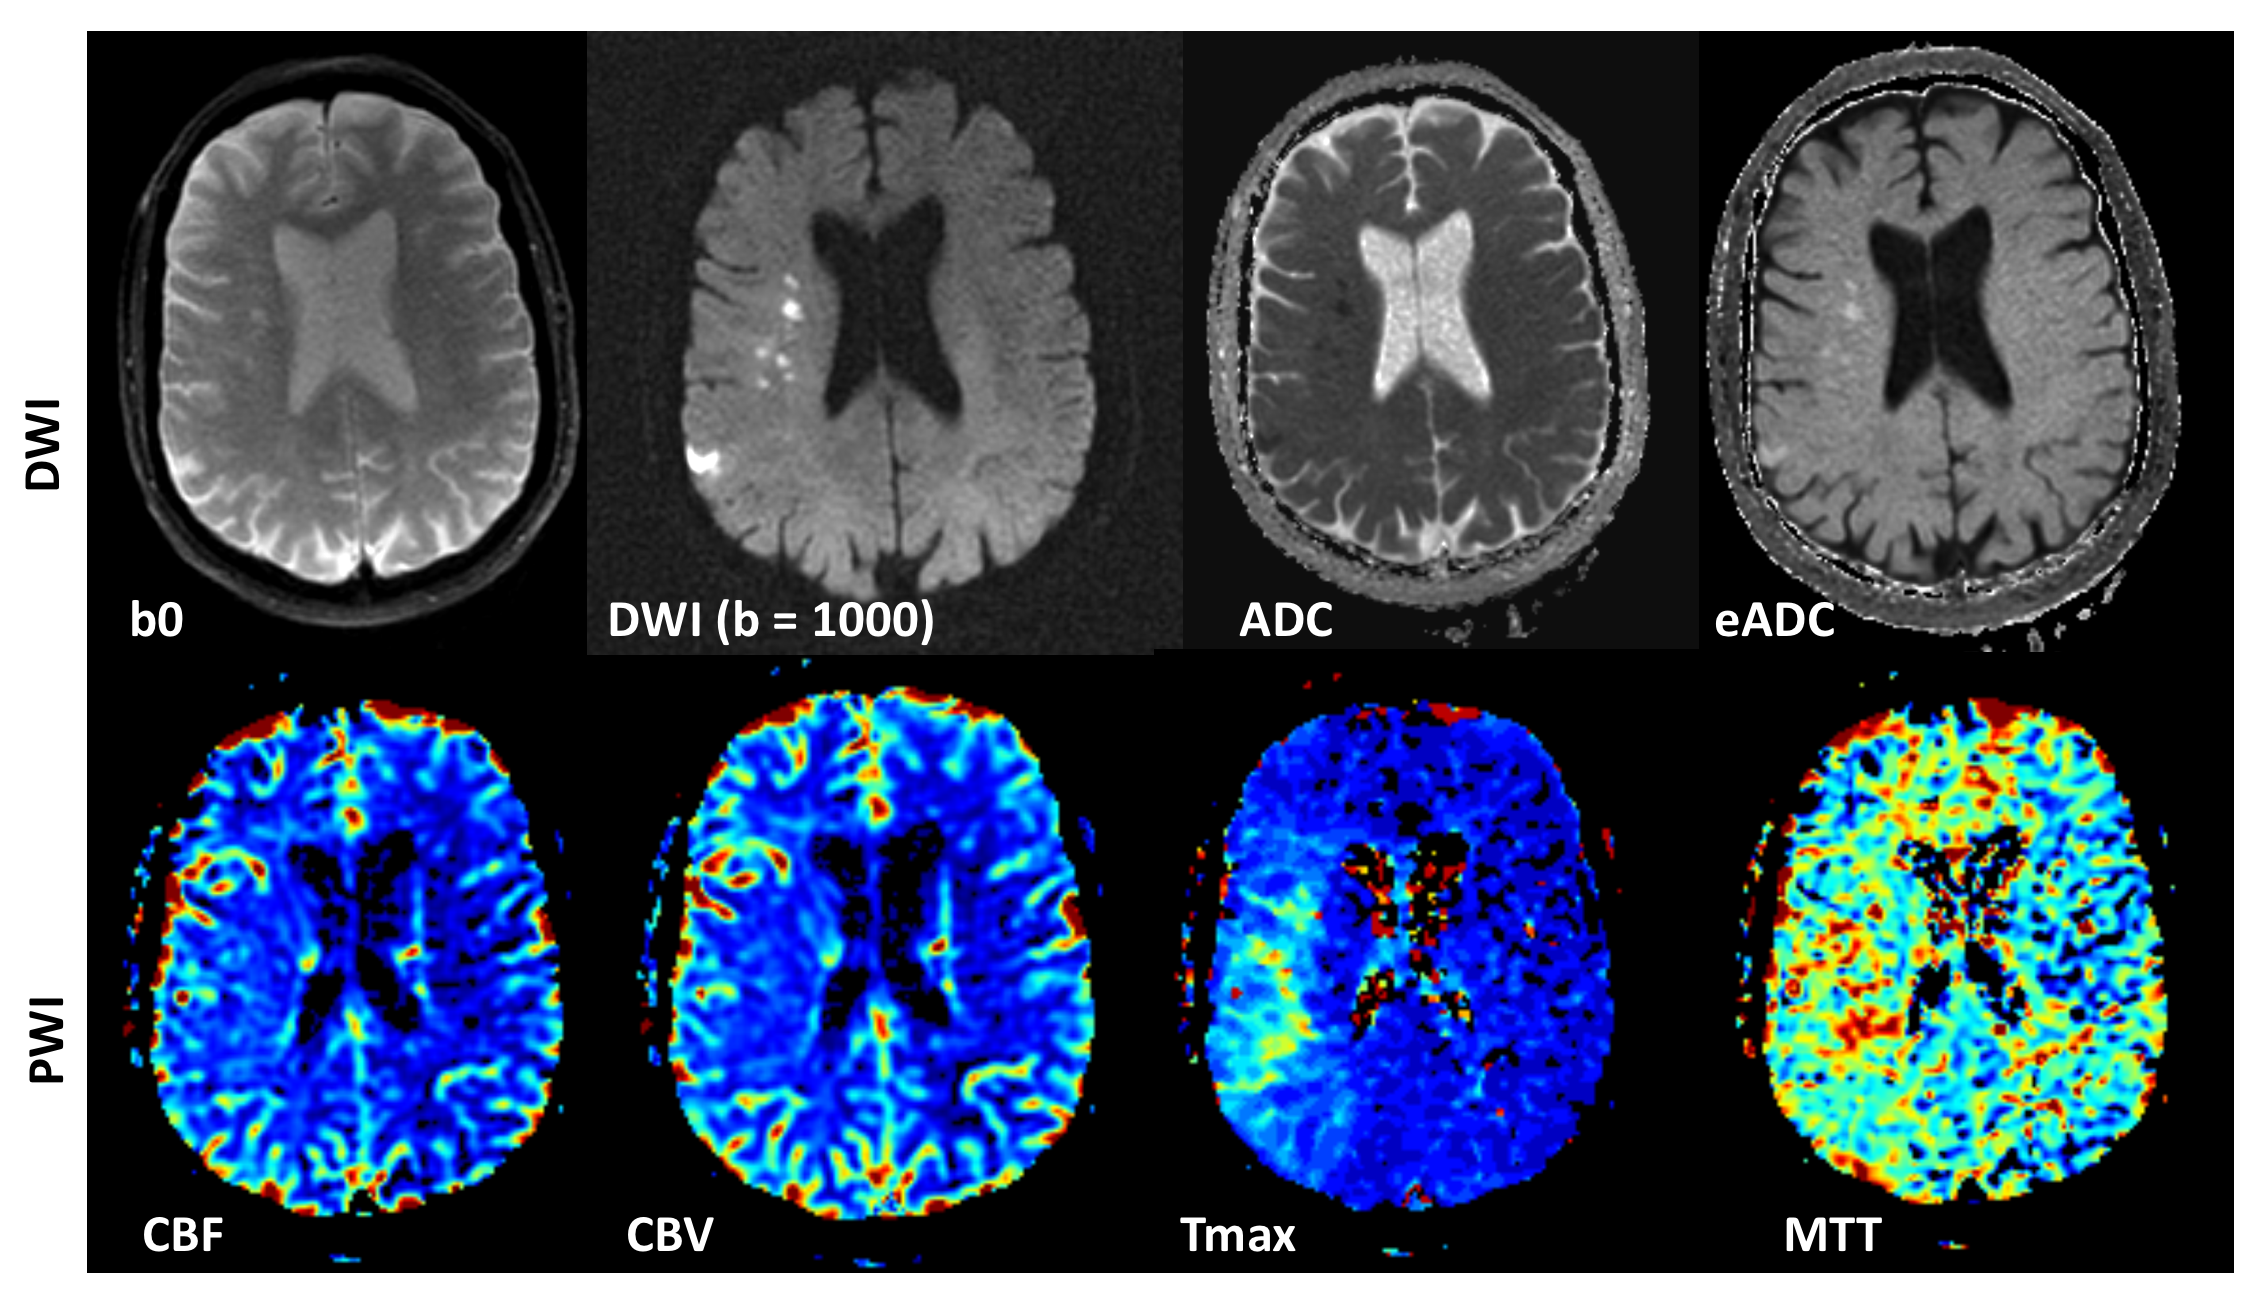
Diffusion-weighted imaging (DWI) uses the diffusion of water molecules to generate contrast in MR images. Due to the presence of cell membranes, macromolecules, fibers and other obstacles, the water molecules tend to be confined and hindered in their normal free diffusion. Water molecule diffusion patterns can therefore reveal microscopic details about tissue architecture, characterize different tissue types or pathological processes. DWI allows one to take ‘snapshots’ of this tissue water motion on a time scale of a few tens of milliseconds, using strong ‘diffusion encoding’ magnetic field gradients. On a DWI image, the grayscale pixel value is dependent on the underlying diffusivity, where voxels with high diffusion appear hypointense (e.g. CSF) and voxels with low diffusion appear hyperintense (e.g. acute stroke, Fig 1).
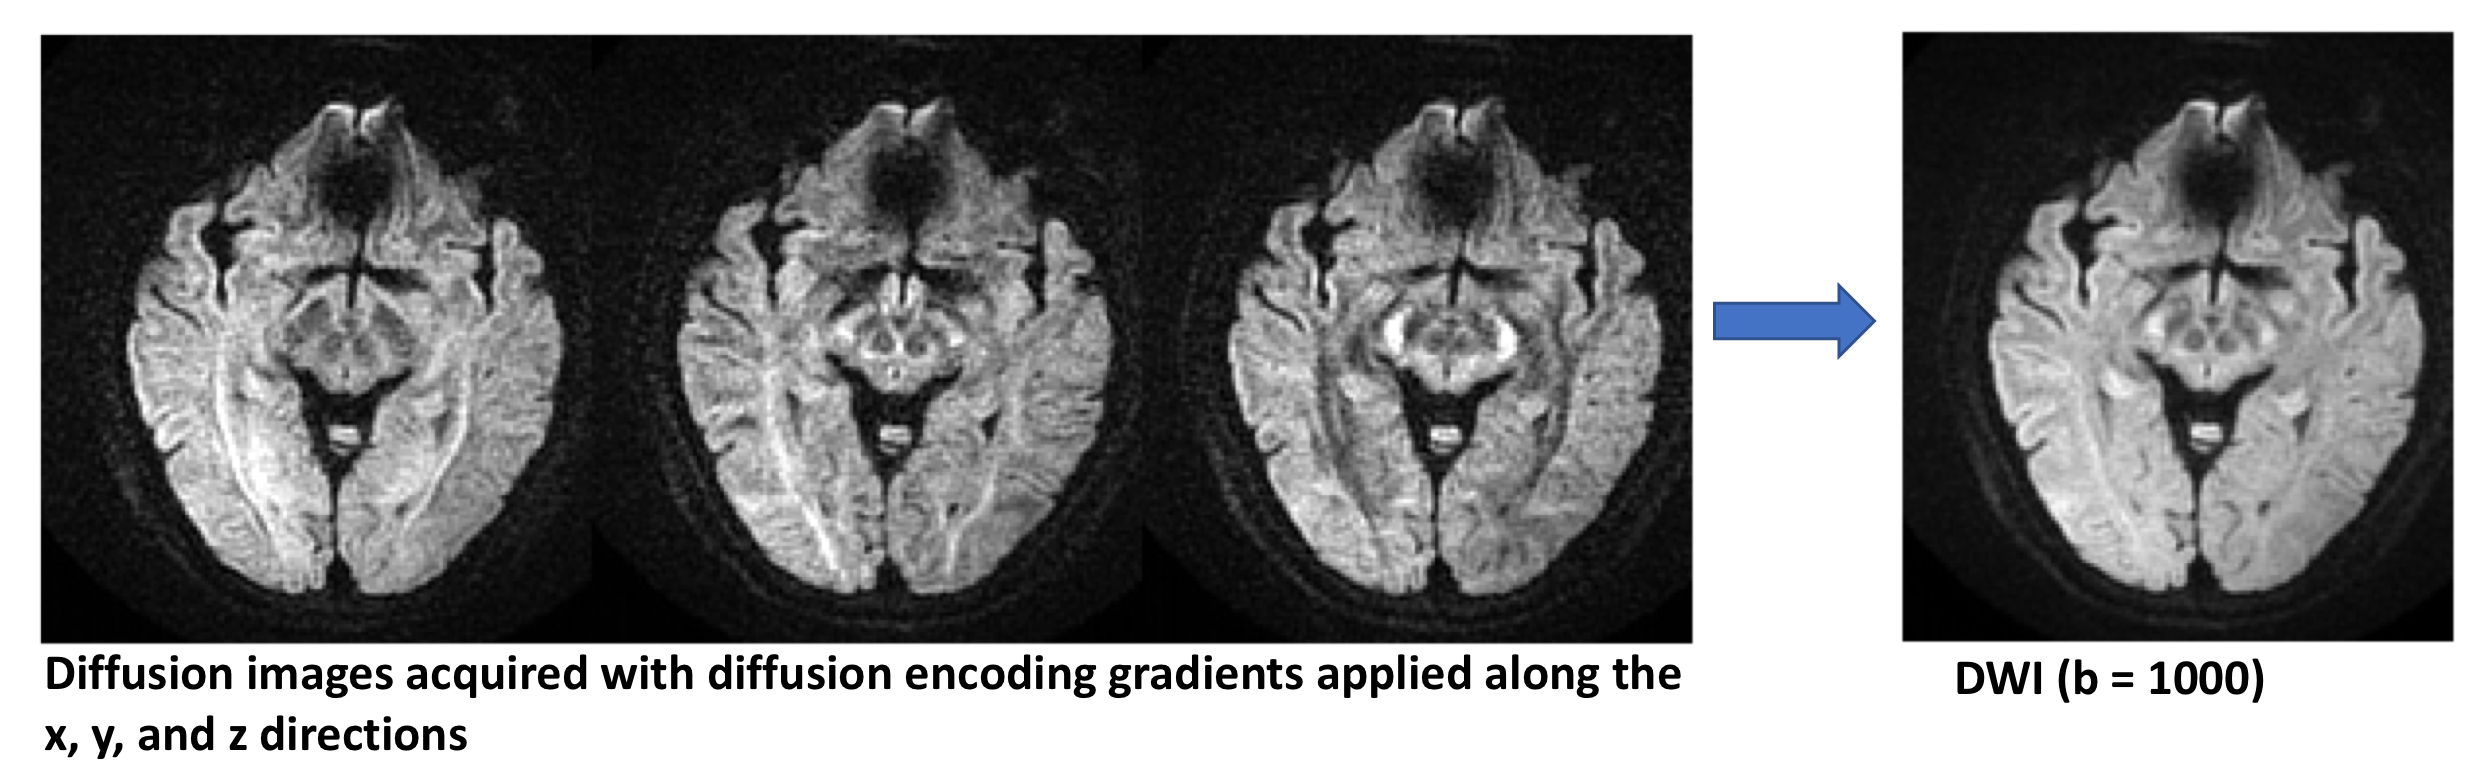
A DWI imaging acquisition is typically achieved with the Stejskal and Tanner method, where the strength of the diffusion encoding is represented by the ‘b-value’. A typical brain DWI sequence comprises of the acquisition of one ‘b = 0’ or T2-weighted image, followed by 3 or more diffusion-weighted ‘source’ images acquired at a b-value of 1000 (Fig. 2). These individual source images are usually combined by into a single final set for diagnosis by taking the geometric mean across these images. The combined image is known by various names: diffusion-weighted images, isotropic images, or trace images.
On both the b = 0 and b = 1000 images, the contrast not only depends upon the spatially distributed diffusion coefficient of the acquired tissues, but also depends on the T2 (and sometimes T1) values. Because of this, the ‘apparent diffusion coefficient’ or ADC is often calculated (based off the -logarithm ratio of b1000/b0), which helps to differentiate T2 shine through (or T1) effects and other artifacts from real diffusion lesions (Fig. 1).
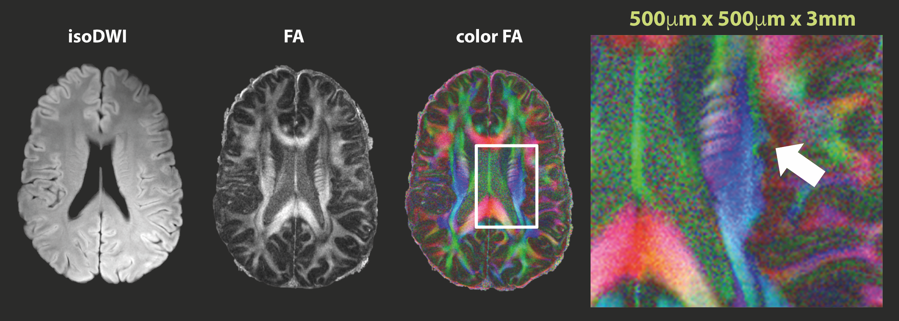
The more advanced form of DWI, diffusion tensor imaging (DTI) (Fig. 3), looks at the degree of anisotropy of water diffusion by describing diffusion as a tensor. By acquiring six or more directions, one can model the diffusion processes as a tensor, to compute diffusion anisotropy measures such as the fractional anisotropy (FA). This allows us to visualize and assess white matter fiber tracks in which diffusion of water follows a preferred direction. By color-coding the direction of these FA maps (‘color FA’), one is able to visualize direction information. With some extra processing to follow the direction of these white matter fiber tracts, fiber tractography maps can be created, which help to look at white matter integrity.
Perfusion-weighted imaging
Perfusion-weighted imaging (PWI) methods can be categorized into two types of methods: contrast imaging by injection of MR contrast, and endogenous (and non-invasive) methods. Contrast-based methods include dynamic susceptibility contrast (DSC) perfusion [8-9] and dynamic contrast enhanced (DCE) perfusion [13-17]. Non-contrast-based methods include Arterial Spin Labeling (ASL) [18-22], and the (less commonly-used method) Intravoxel Incoherent Motion (IVIM) [23].
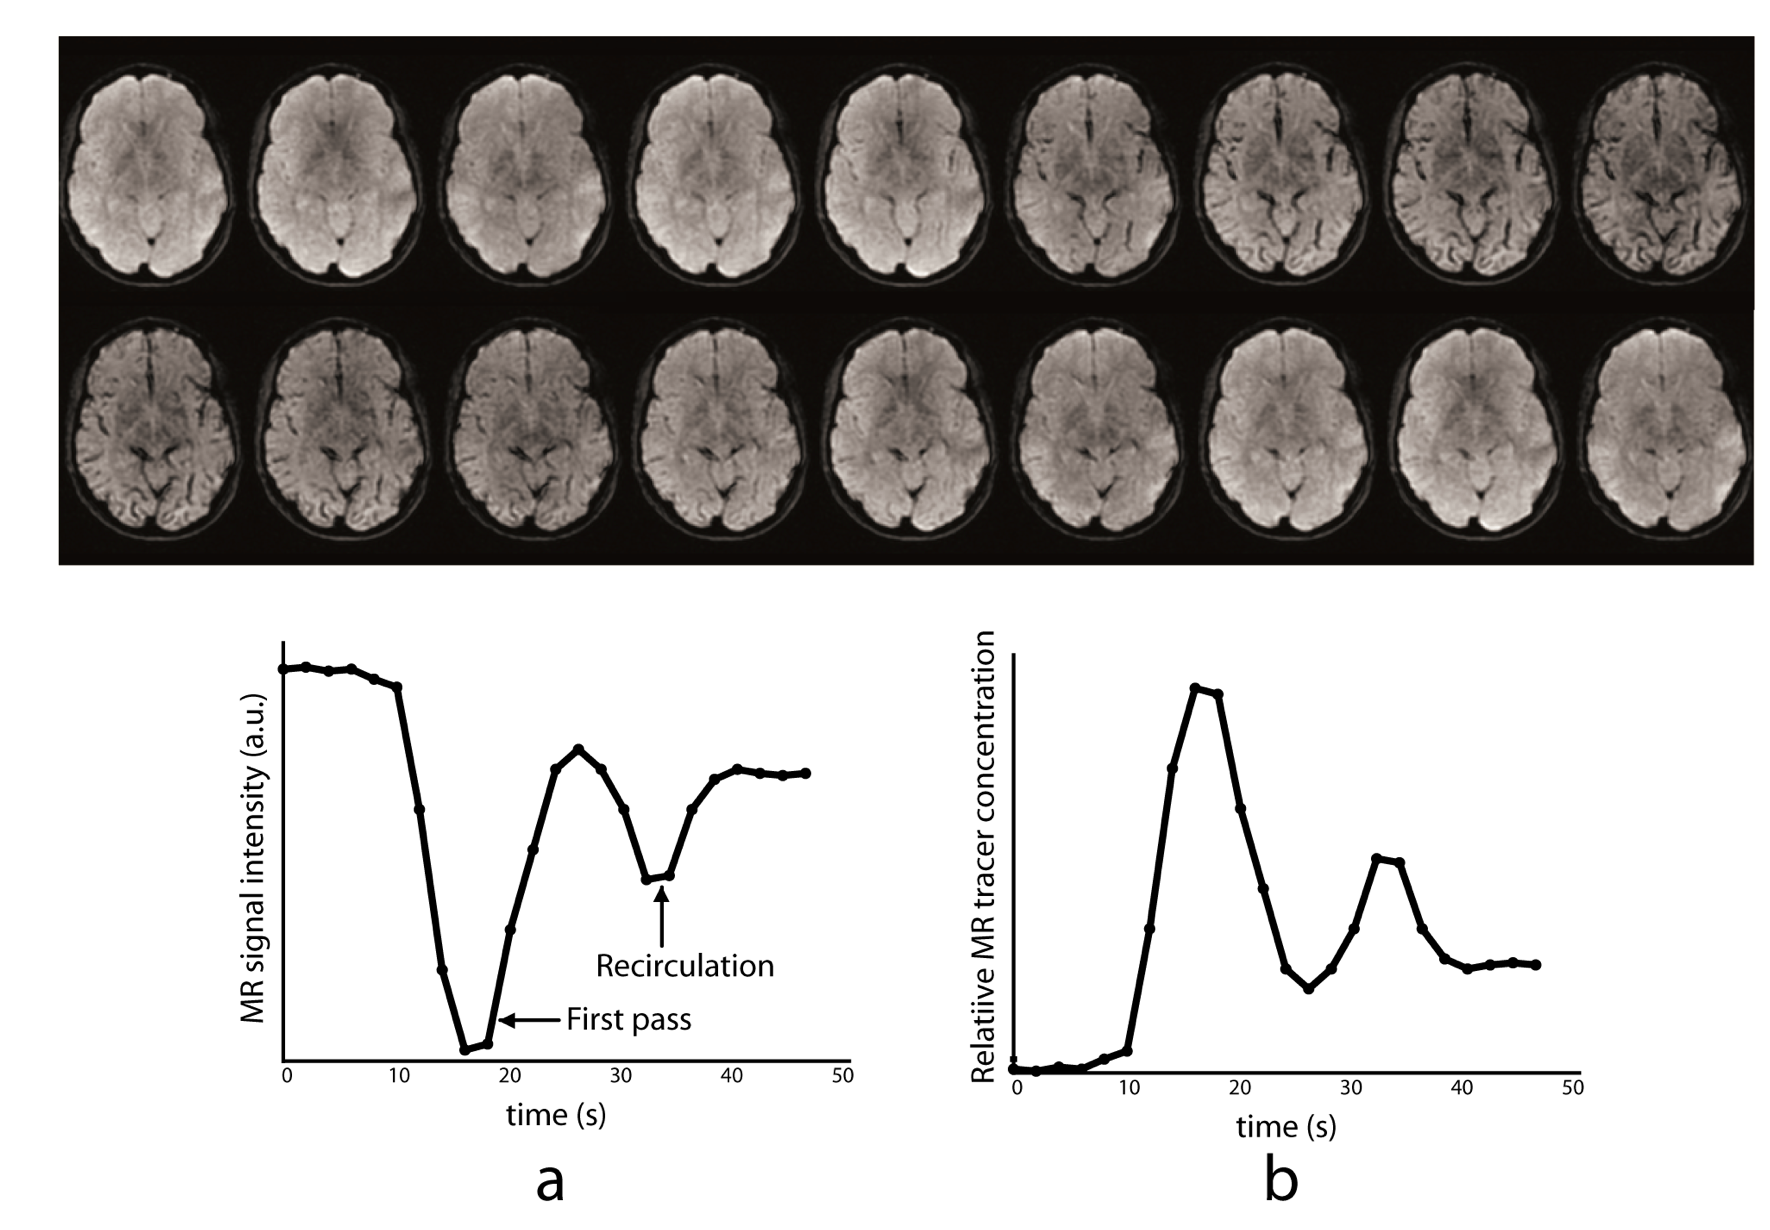
In DSC-MRI, a contrast agent (typically gadolinium) is injected intravenously, and a time series of fast T2*-weighted (or spin-echo) images is acquired during the first pass through the cerebral circulation. As gadolinium passes through the tissues, it produces a reduction of T2* intensity depending on the local concentration (Fig. 4). Hemodynamic maps of cerebral blood flow (CBF), cerebral blood volume (CBV) and mean transit time (MTT) or time to bolus peak (TTP) can be created by mathematical analysis of the evolution of the intensity of the signal. Both DSC-PWI and DWI are rapidly have become integral parts of the diagnostic workup in the acute stroke setting (Fig. 5).
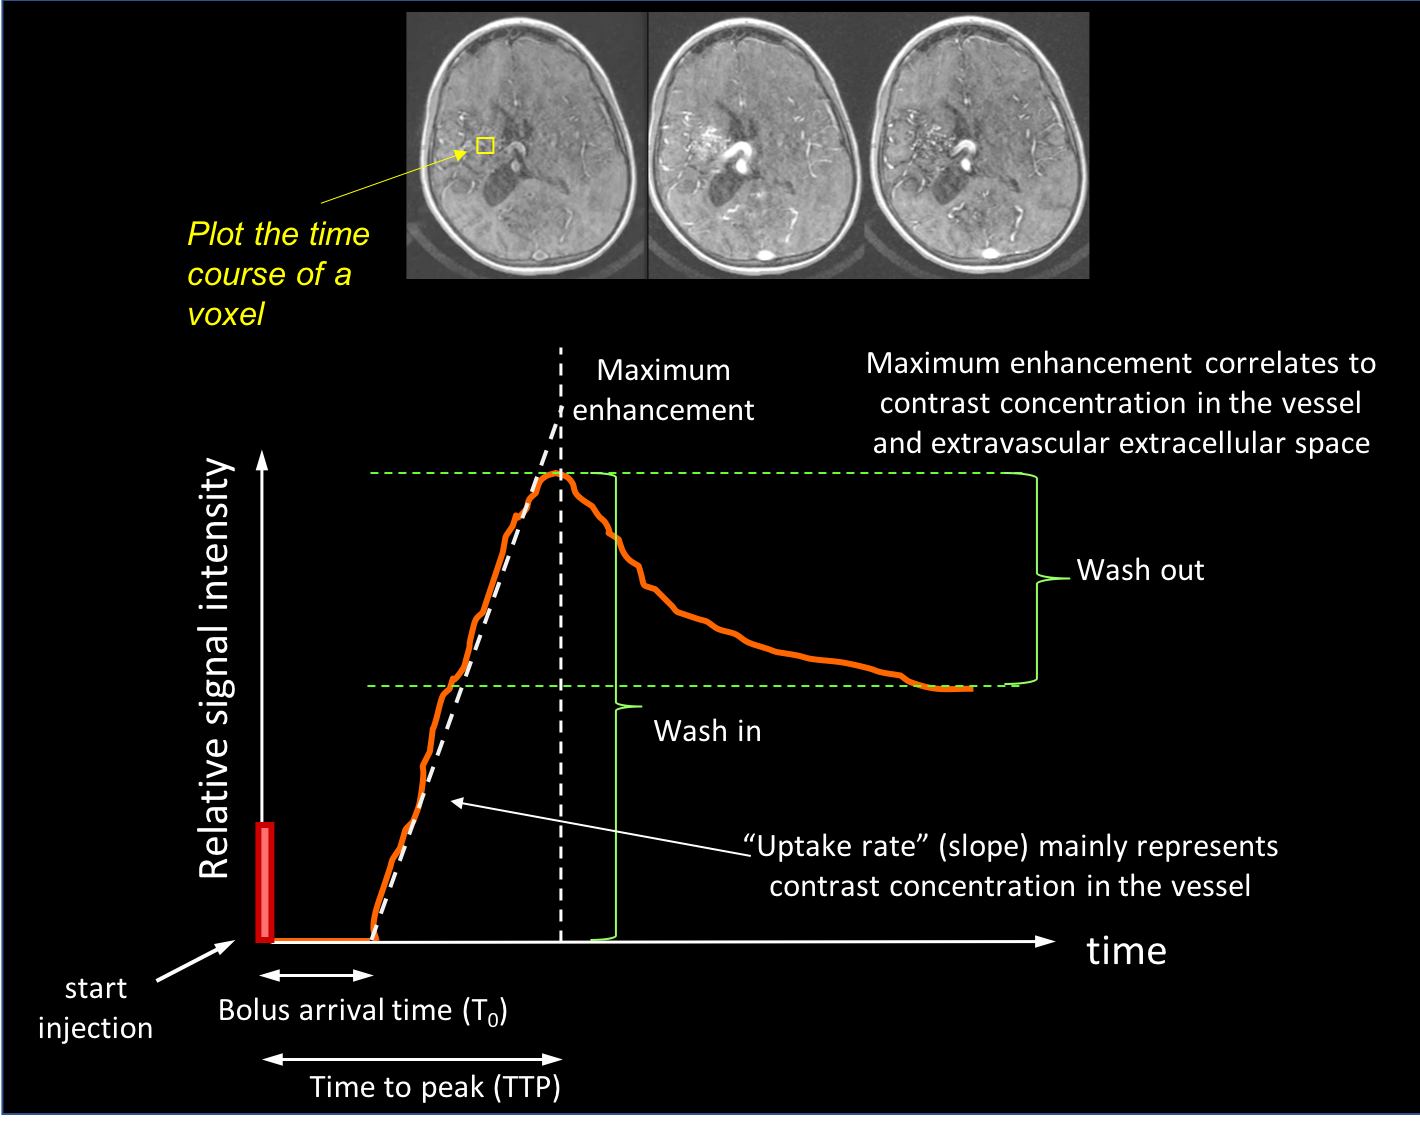
In DCE-MRI, the contrast agent is tracked with a T1-weighted gradient echo method (Fig. 6). Since gadolinium reduces the local relaxation T1 relaxation time, such a T1-weighted image yields signal enhancement. Unlike DSC which generally assumes that the gadolinium stays in the vascular bed, DCE assumes that the contrast agent goes into tissue. This is why DCE is widely referred to as ‘permeability’ MRI, in which the signal-time-curve is thought to reflect a composite of tissue perfusion, vessel permeability, and extravascular-extracellular space. As such, by plotting the relative signal enhancement as it leaks out into the tissue versus time, one can extract qualitative measures such as wash-in, maximum enhancement, bolus arrival time, time to peak, uptake rate, and washout contrast kinetics of the tissue, thereby providing insight into the nature of the bulk tissue properties at the microvascular level (Fig. 6).
To get quantitative measurements in DCE-MRI, the easiest and most well-known model is the Tofts two-compartment (plasma space and extravascular-extracellular space) model [24]. For this approach, the signal intensity data is converted to gadolinium concentration, then the vascular input function is determined, after which pharmacokinetic modeling is performed. This yields the following metrics: the transfer constant (ktrans), a factor related to vessel permeability and tissue blood flow (the most-used constant); the fractional volume of the extravascular-extracellular space (ve), a marker of cell density; the rate constant (kep), where kep = ktrans/ve), which describes the diffusion of the contrast agent back to the plasma; and the fractional volume of the plasma space (vp).
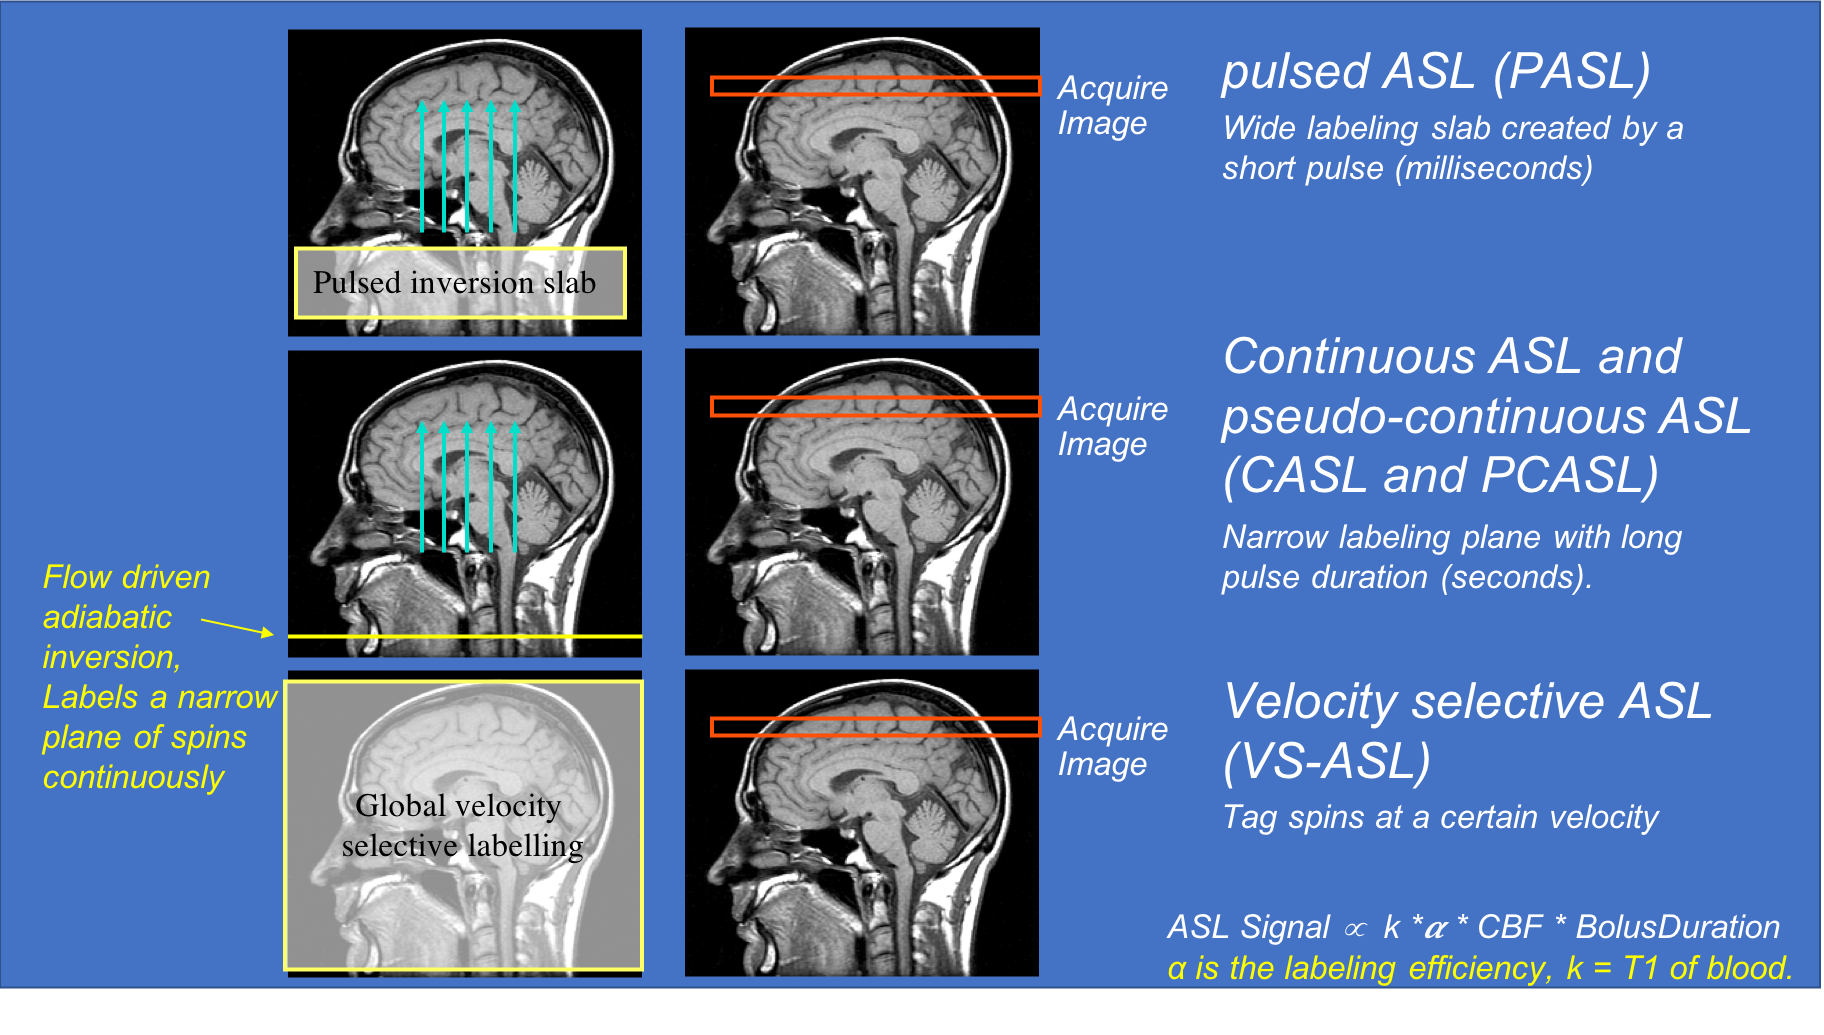
Arterial spin labeling (ASL) uses magnetically labeled arterial blood water protons as an endogenous diffusible tracer to measure tissue blood flow. Here, flowing spins in the carotid arteries are inverted by a radiofrequency pulse. The influx of fresh, labeled protons in the tissue of interest slightly alters the magnetization and, depending on the exchange with tissue protons (therefore the T1 relaxation time of the tissue), renders this method sensitive to the local degree of microperfusion. Hence, any change in regional blood flow will be picked up by ASL via image contrast changes. The four types of ASL preparation components are: pulsed ASL (PASL), continuous ASL (CASL), pseudo-continuous ASL (pCASL) and velocity-selective ASL (VS-ASL) (Fig. 7). The primary difference among these ASL categories is the technique that magnetically tags the inflowing blood. In the past, despite being non-invasive, ASL methods have seen limited adoption clinically due to their complexity, susceptibility to motion, among other problems. However due to recent technical advances, ASL is increasingly becoming of increasing clinical interest, particularly to investigate perfusion abnormalities in cerebral stroke and patients with chronic vascular diseases (Fig. 8).
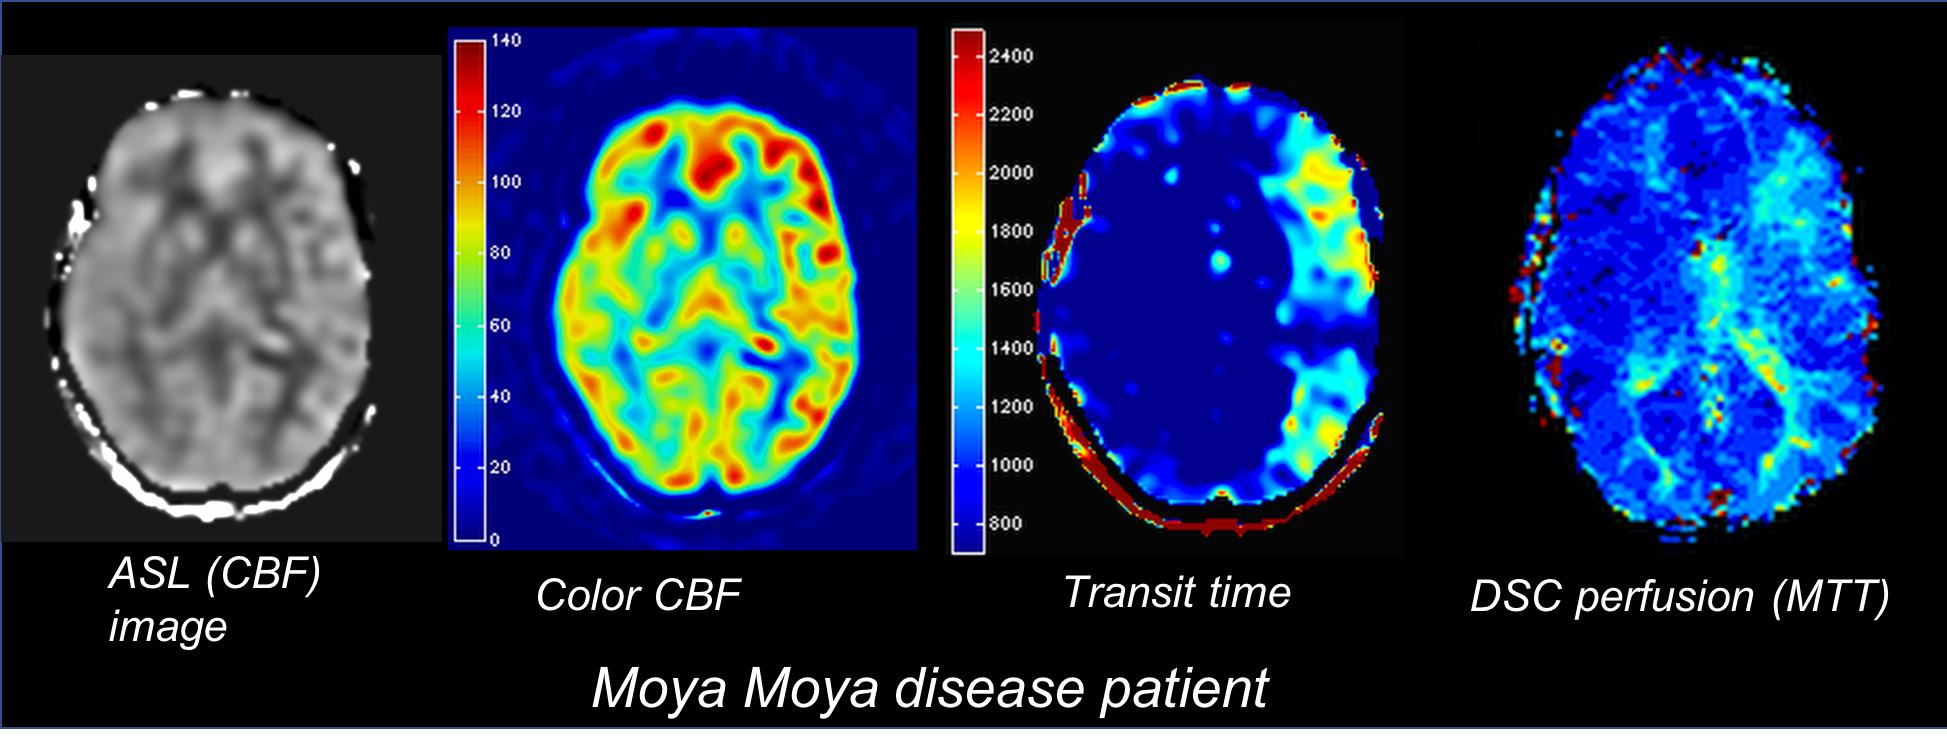
It is also possible to get MTT maps by acquiring multiple ‘post label delay’ images. These multi-delay ASL approaches can be used for any of the above ASL approaches. Multi-delay ASL is useful in cerebrovascular cases such as Moya Moya disease, in which patients have prolonged for heterogeneous blood transit times (Fig. 9). Note that these transit times can also be helpful for correcting for these transit time effects in the CBF maps.
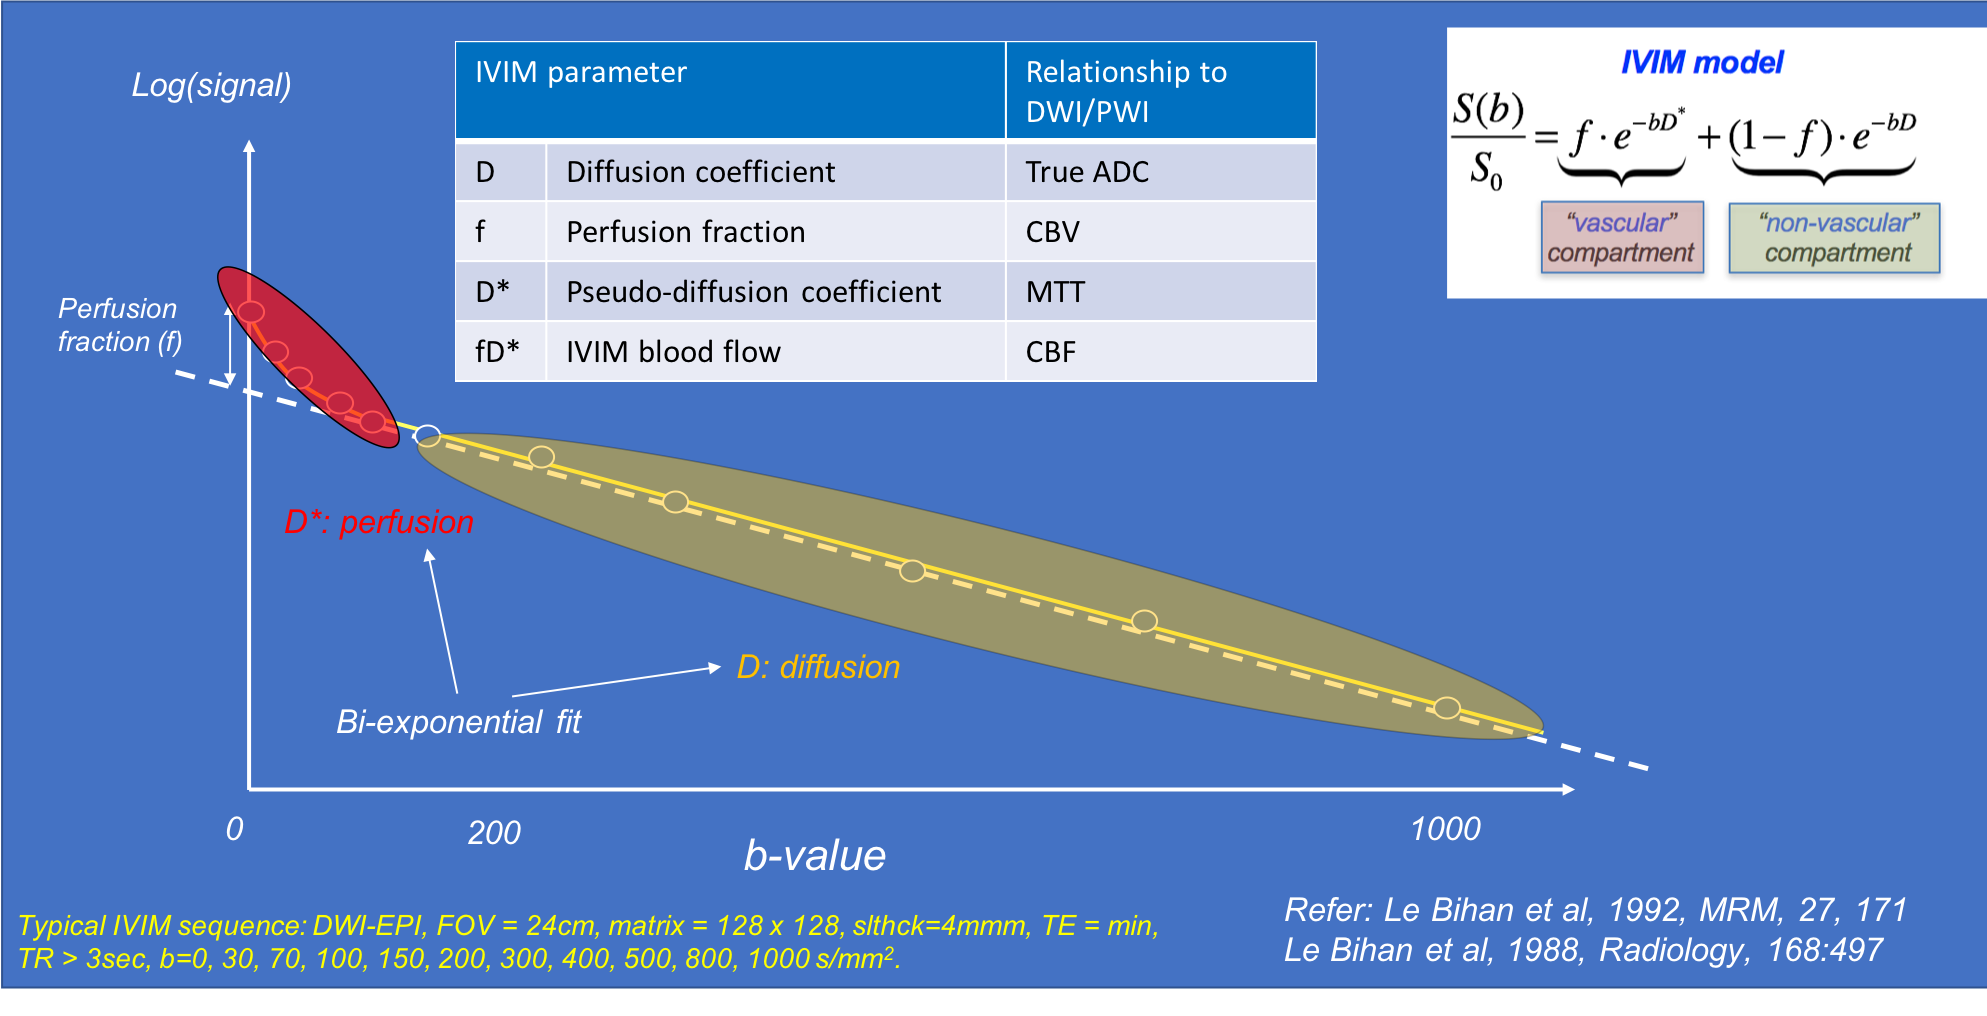
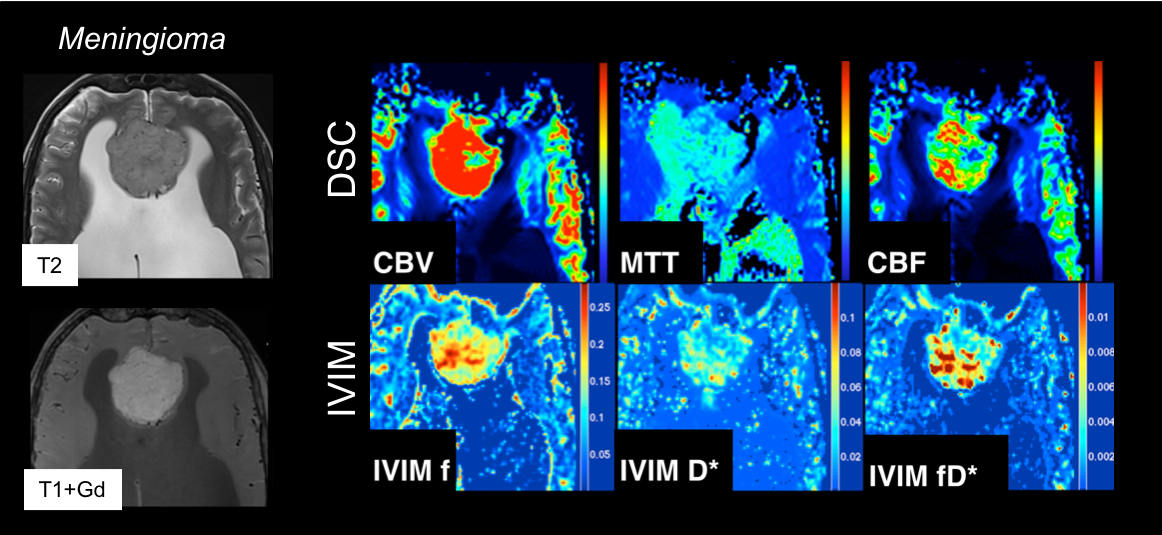
Intravoxel incoherent motion (IVIM) imaging is a method used to assess all the microscopic motions that could contribute to the signal acquired with diffusion MRI. These motions are molecular diffusion of water and microcirculation of blood in the capillaries (i.e. perfusion, or in other words, a pseudo-diffusion process from movement of blood in the microvasculature). The IVIM model therefore infers that diffusion images may have perfusion effects (i.e. not just molecular diffusion of water in the tissue, or ‘true’ diffusion). As a consequence, this infers that the ADC could be overestimated in conventional DWI models. It also means that, using a more comprehensive DWI dataset with multiple b-values, several additional maps can be calculated, such as the ‘true’ diffusion coefficient (D), the perfusion fraction (f), the pseudo-diffusion coefficient (D*), and the ‘IVIM blood flow’ (fD*) (Figs. 10-11).
Acknowledgements
No acknowledgement found.References
1. Le Bihan, D; E. Breton (1985). "Imagerie de diffusion in-vivo par résonance magnétique nucléaire". C R Acad Sci (Paris). 301 (15): 1109–1112.
2. Merboldt, K; Hanicke, W; Frahm, J (1985). "Self-diffusion NMR imaging using stimulated echoes". Journal of Magnetic Resonance (1969). 64 (3): 479–486. JMagR..64..479M.
3. Taylor, D G; Bushell, M C (1985). "The spatial mapping of translational diffusion coefficients by the NMR imaging technique". Physics in Medicine and Biology. 30 (4): 345–349.
4. Moseley ME, Kucharczyk J, Mintorovitch J, Cohen Y, Kurhanewicz J, Derugin N, Asgari H, Norman D. Diffusion-weighted mr imaging of acute stroke: Correlation with t2-weighted and magnetic susceptibility-enhanced mr imaging in cats. AJNR Am J Neuroradiol. 1990;11:423-429
5. Lansberg MG, Norbash AM, Marks MP, Tong DC, Moseley ME, Albers GW. Advantages of adding diffusion-weighted magnetic resonance imaging to conventional magnetic resonance imaging for evaluating acute stroke. Arch Neurol. 2000;57:1311-1316
6. Warach S, Gaa J, Siewert B, Wielopolski P, Edelman RR. Acute human stroke studied by whole brain echo planar diffusion- weighted magnetic resonance imaging. Ann Neurol. 1995;37:231–241.
7. Basser Peter J., Mattiello James, LeBihan Denis. Estimation of the effective self-diffusion tensor from the NMR spin echo. (Series B).Journal of Magnetic Resonance. 1994;103:247–254.
8. Baird AE, Warach S. Magnetic resonance imaging of acute stroke. J Cereb Blood Flow Metab. 1998;18:583-609
9. Calamante F, Thomas DL, Pell GS, Wiersma J, Turner R. Measuring cerebral blood flow using magnetic resonance imaging techniques. J Cereb Blood Flow Metab. 1999;19:701-735
10. Hossmann K-A, Hoehn-Berlage M. Diffusion and perfusion MR imaging of cerebral ischemia. Cerebrovasc Brain Metab Rev. 1995;7:187–217.
11. Sorensen AG, Buonanno FS, Gonzalez RG, Schwamm LH, Lev MH, Huang-Hellinger FR, Reese TG, Weisskoff RM, Davis TL, Suwanwela N, Can U, Moreira JA, Copen WA, Look RB, Finklestein SP, Rosen BR, Koroshetz WJ. Hyperacute stroke: evaluation with combined multisection diffusion- weighted and hemodynamically weighted echo-planar MR imaging. Radiology. 1996;199:391–401.
12. Warach S, Dashe JF, Edelman RR. Clinical outcome in ischemic stroke predicted by early diffusion- weighted and perfusion magnetic resonance imaging: a preliminary analysis. J Cereb Blood Flow Metab. 1996;16:53–59.
13. Gadian D.G., Payne J.A., Bryant D.J., Young I.R., Carr D.H., Bydder G.M. Gadolinium-DTPA as a contrast agent in MR imaging—Theoretical projections and practical observations. J. Comput. Assist. Tomogr. 1985;2:242–251.
14. Grossman R.I., Gonzalez-Scarano F., Atlas S.W., Galetta S., Silberberg D.H. Multiple sclerosis: Gadolinium enhancement in MR imaging. Radiology. 1986;3:721–725.
15. Miller D.H., Rudge P., Johnson G., Kendall B.E., Macmanus D.G., Moseley I.F., Barnes D., McDonald W.I. Serial gadolinium enhanced magnetic resonance imaging in multiple sclerosis. Brain. 1988; 4:927–939.
16. Brix G, Semmler W, Port R, Schad LR, Layer G, Lorenz WJ. Pharmacokinetic parameters in CNS Gd-DTPA enhanced MR imaging. J Comput Assist Tomogr. 1991;15:621–628.
17. Tofts PS, Kermode AG. Measurement of the blood-brain barrier permeability and leakage space using dynamic MR imaging. 1. Fundamental concepts. Magn Reson Med. 1991;17:357–367.
18. Detre JA, Leigh JS, Williams DS, Koretsky AP. Perfusion imaging. Magn Reson Med 1992;23(1):37-45 19. Detre JA, Zhang W, Roberts DA, et al. Tissue specific perfusion imaging using arterial spin labeling. NMR Biomed 1994;7(1-2):75-82
20. Williams DS, Detre JA, Leigh JS, Koretsky AP. Magnetic resonance imaging of perfusion using spin inversion of arterial water. Proc Natl Acad Sci U S A 1992;89(1):212-216
21. Deibler AR, Pollock JM, Kraft RA, Tan H, Burdette JH, Maldjian JA. Arterial spin-labeling in routine clinical practice, part 1: technique and artifacts. AJNR Am J Neuroradiol. 2008;29:1228–1234.
22. Wolf RL, Detre JA. Clinical neuroimaging using arterial spin-labeled perfusion magnetic resonance imaging. Neurotherapeutics. 2007;4:346–359.
23. Le Bihan, D; Breton, E; Lallemand, D; Grenier, P; Cabanis, E; Laval-Jeantet, M (1986). "MR imaging of intravoxel incoherent motions: application to diffusion and perfusion in neurologic disorders". Radiology. 161 (2): 401–7.
24. Tofts PS, Brix G, Buckley DL, et al. Estimating kinetic parameters from dynamic contrast-enhanced T(1)-weighted MRI of a diffusable tracer: standardized quantities and symbols. J Magn Reson Imaging. 1999;10:223–232.
Figures