Animal Diffusion Imaging UHF
Hao Huang1
1University of Pennsylvania, United States
Synopsis
The audience will understand current technical challenges and possible solutions of animal diffusion imaging at UHF. Several applications of animal diffusion imaging at UHF will be introduced. These applications include delineation of mouse embryo anatomical structures with high contrasts of diffusion tensor microimaging, microstructural measurement of animal brain cerebral cortex and white matter tracts, tractography of mouse brain white matter tracts, establishment of animal brain atlases and biomarker detection with diffusion MRI of animal model.
Summary and target audience
The volume of a mouse brain is approximately 3000 times smaller than that of a human brain. Revealing anatomical details of the small animal brain requires higher resolution (e.g. 0.1-0.2mm isotropic). Ultra-high field (UHF) (e.g. 7.0 Tesla, 9.4 Tesla, 11.7 Tesla, or even 17 Tesla) is needed for sufficient signal-to-noise ratio (SNR) of animal diffusion MR images. The audience will understand current technical challenges and possible solutions of animal diffusion imaging at UHF. Several applications of animal diffusion imaging at UHF will be introduced. These applications include delineation of mouse embryo anatomical structures with high contrasts of diffusion tensor microimaging, microstructural measurement of animal brain cerebral cortex and white matter tracts, tractography of mouse brain white matter tracts, establishment of animal brain atlases and biomarker detection with diffusion MRI of animal model.Technical challenges
High magnetic field has been used to enhance spatial resolution in human brain diffusion tensor imaging (DTI) [e.g. 1-3]. The primary technical challenge in animal diffusion MRI is to achieve sufficient SNR at high spatial resolution. The spatial resolution is theoretically limited by SNR that can be achieved with MRI. Diffusion MRI is inherently a noisy technique because the signal magnitude in diffusion weighted images is attenuated by diffusion sensitizing gradients, posing further challenges on the front of SNR. With the volume of a mouse brain is approximately 3000 times smaller than that of a human brain, 0.1-0.2mm isotropic resolution in the mouse brain could only reveal the anatomical details similar to those in human brain diffusion MRI at typical 2mm isotropic resolution. 0.1-0.2 mm isotropic resolution, however, results in 3 orders of magnitude loss in MR signal strength, as the signal is proportional to the volume of the voxel. Therefore, ultra-high field magnets (e.g. 7.0 Tesla, 9.4 Tesla, 11.7 Tesla, or even 17 Tesla) are necessary for animal diffusion MRI. Higher magnetic field induces problems of smaller T2 and higher field inhomogeneity.Possible imaging solutions
Possible solutions include two approaches based on spin echo: multiple spin echo (MSE) and fast spin echo (FSE) [4]. In both MSE and FSE acquisitions, there are multiple refocusing pulses and echoes after the initial excitation pulse. In the FSE acquisition, the multiple spin echoes sample different lines in the k-space, whereas in MSE acquisition, the multiple spin echoes sample the same line in the k-space. In both cases, the number of echoes that can be acquired is limited by the T2 decay. From the MSE experiments, multiple images will be obtained and added together to increase the SNR. Selection of FSE or MSE acquisition depends on imaging time, resolution, and SNR requirements. Usually FSE is more time efficient and well-suited for in vivo experiments.Applications
High contrasts of developing mouse embryos: With the high contrasts offered by DTI-derived maps, the critical structures such as neuroepithelium, cortical plate and axonal structures of developing mouse embryos can be delineated and three-dimensionally reconstructed [5]. The high contrasts of DTI-derived maps at 0.1x0.1x0.1mm3 resolution are shown in Figure 1. The microstructural measurement of animal brain: The microstructure of both cerebral cortex [6-9] and white matter tracts [10] can be measured to characterize the animal brain developmental pattern. The cortical microstructural maturational pattern of the developing rat brains can be delineated by cortical fractional anisotropy maps, shown in Figure 2. Tractography of rodent brain white matter tracts: Based on tractography with the high resolution mouse brain DTI, The traced and reconstructed corpus callosum of a mouse brain is shown in Figure 3. Establishment of animal brain atlases: The animal brain atlases can be established with high contrasts and high resolution of diffusion MRI obtained with UHF. As an example, the macaque brain atlas [11,12] with the DTI resolution of 0.3x0.44x0.45mm3 is demonstrated in Figure 4. Biomarker detection of diffusion MRI of animal model: A suite of genotypes and phenotypes with animal diffusion MRI for biomarker of neurological and psychiatric disorders will be covered.Acknowledgements
No acknowledgement found.References
[1] Vu AT, Auerbach E, Lenglet C, Moeller S, Sotiropoulos SN, Jbabdi S, Andersson J, Yacoub E, Ugurbil K, 2015. High resolution whole brain diffusion imaging at 7T for Human Connectome Project. Neuroimage 122: 318-331. [2] Wu W, Poser BA, Douaud G, Frost R, In MH, Speck O, Koopmans PJ, Miller KL, 2016. High-resolution diffusion MRI at 7T using a three-dimensional multi-slab acquisition. Neuroimage 143: 1-14. [3] McNab JA, Jbabdi S, Deoni SCL, Douaud G, Behrens TEJ, Miller KL, 2009. High resolution diffusion-weighted imaging in fixed human brain using diffusion-weighted steady state free precession. Neuroimage 46: 775-785. [4] Zhang J, Huang H, Aggarwal M, Mori S. Diffusion tensor microimaging and its applications. Jones D ed., 2010. Diffusion MRI: Theories, Methods, and Applications. 425-438. Oxford University Press [5] Zhang J, Richards LJ, Yarowsky P, Huang H, van Zijl PCM, Mori S., 2001. Three-dimensional anatomical characterization of the developing mouse brain by diffusion tensor microimaging. Neuroimage 20, 1639-1648. [6] Huang H, Yamamoto A, Hossain MA, Younes L, Mori S, 2008. Quantitative cortical mapping of fractional anisotropy of developing rat brains. Journal of Neuroscience 28: 1427-1433. [7] Mori S, Itoh R, Zhang J, Kaufmann WE, van Zijl PC, Solaiyappan M, Yarowsky P. 2001. Diffusion tensor imaging of the developing mouse brain. Magn Reson Med 46:18-23. [8] Kroenke CD, Taber EN, Leigland LA, Knutsen AK, Bayly PV. 2009. Regional patterns of cerebral cortical differentiation determined by diffusion tensor MRI. Cereb Cortex 19:2916-2929. [9] Kroenke CD, Van Essen DC, Inder TE, Rees S, Bretthorst GL, Neil JJ. 2007. Microstructural changes of the baboon cerebral cortex during gestational development reflected in magnetic resonance imaging diffusion anisotropy. J Neurosci 27:12506-12515. [10] Baloch S, Verma R, Huang H, Khurd P, Clark S, Yarowsky P, Abel T, Mori S, Davatzikos C, 2008. Quantification of brain maturation and growth patterns in C57BL/6J mice via computational neuroanatomy of diffusion tensor images. Cerebral Cortex 19: 675-687. [11] Feng L, Jeon T, Yu Q, Ouyang M, Peng Q, Mishra V, Pletikos M, Sestan N, Miller MI, Mori S, Hsiao S, Liu S, Huang H. 2017. Population-averaged atlas with high-resolution ex vivo DTI integrated into in vivo space. Brain Structure and Function 222(9): 4131-4147. [12] Calabrese E, Badea A, Coe CL, Lubach GR, Shi Y, Styner MA, Johnson GA, 2015. A diffusion tensor MRI atlas of the postmortem rhesus macaque brain. Neuroimage 117:408–416.Figures
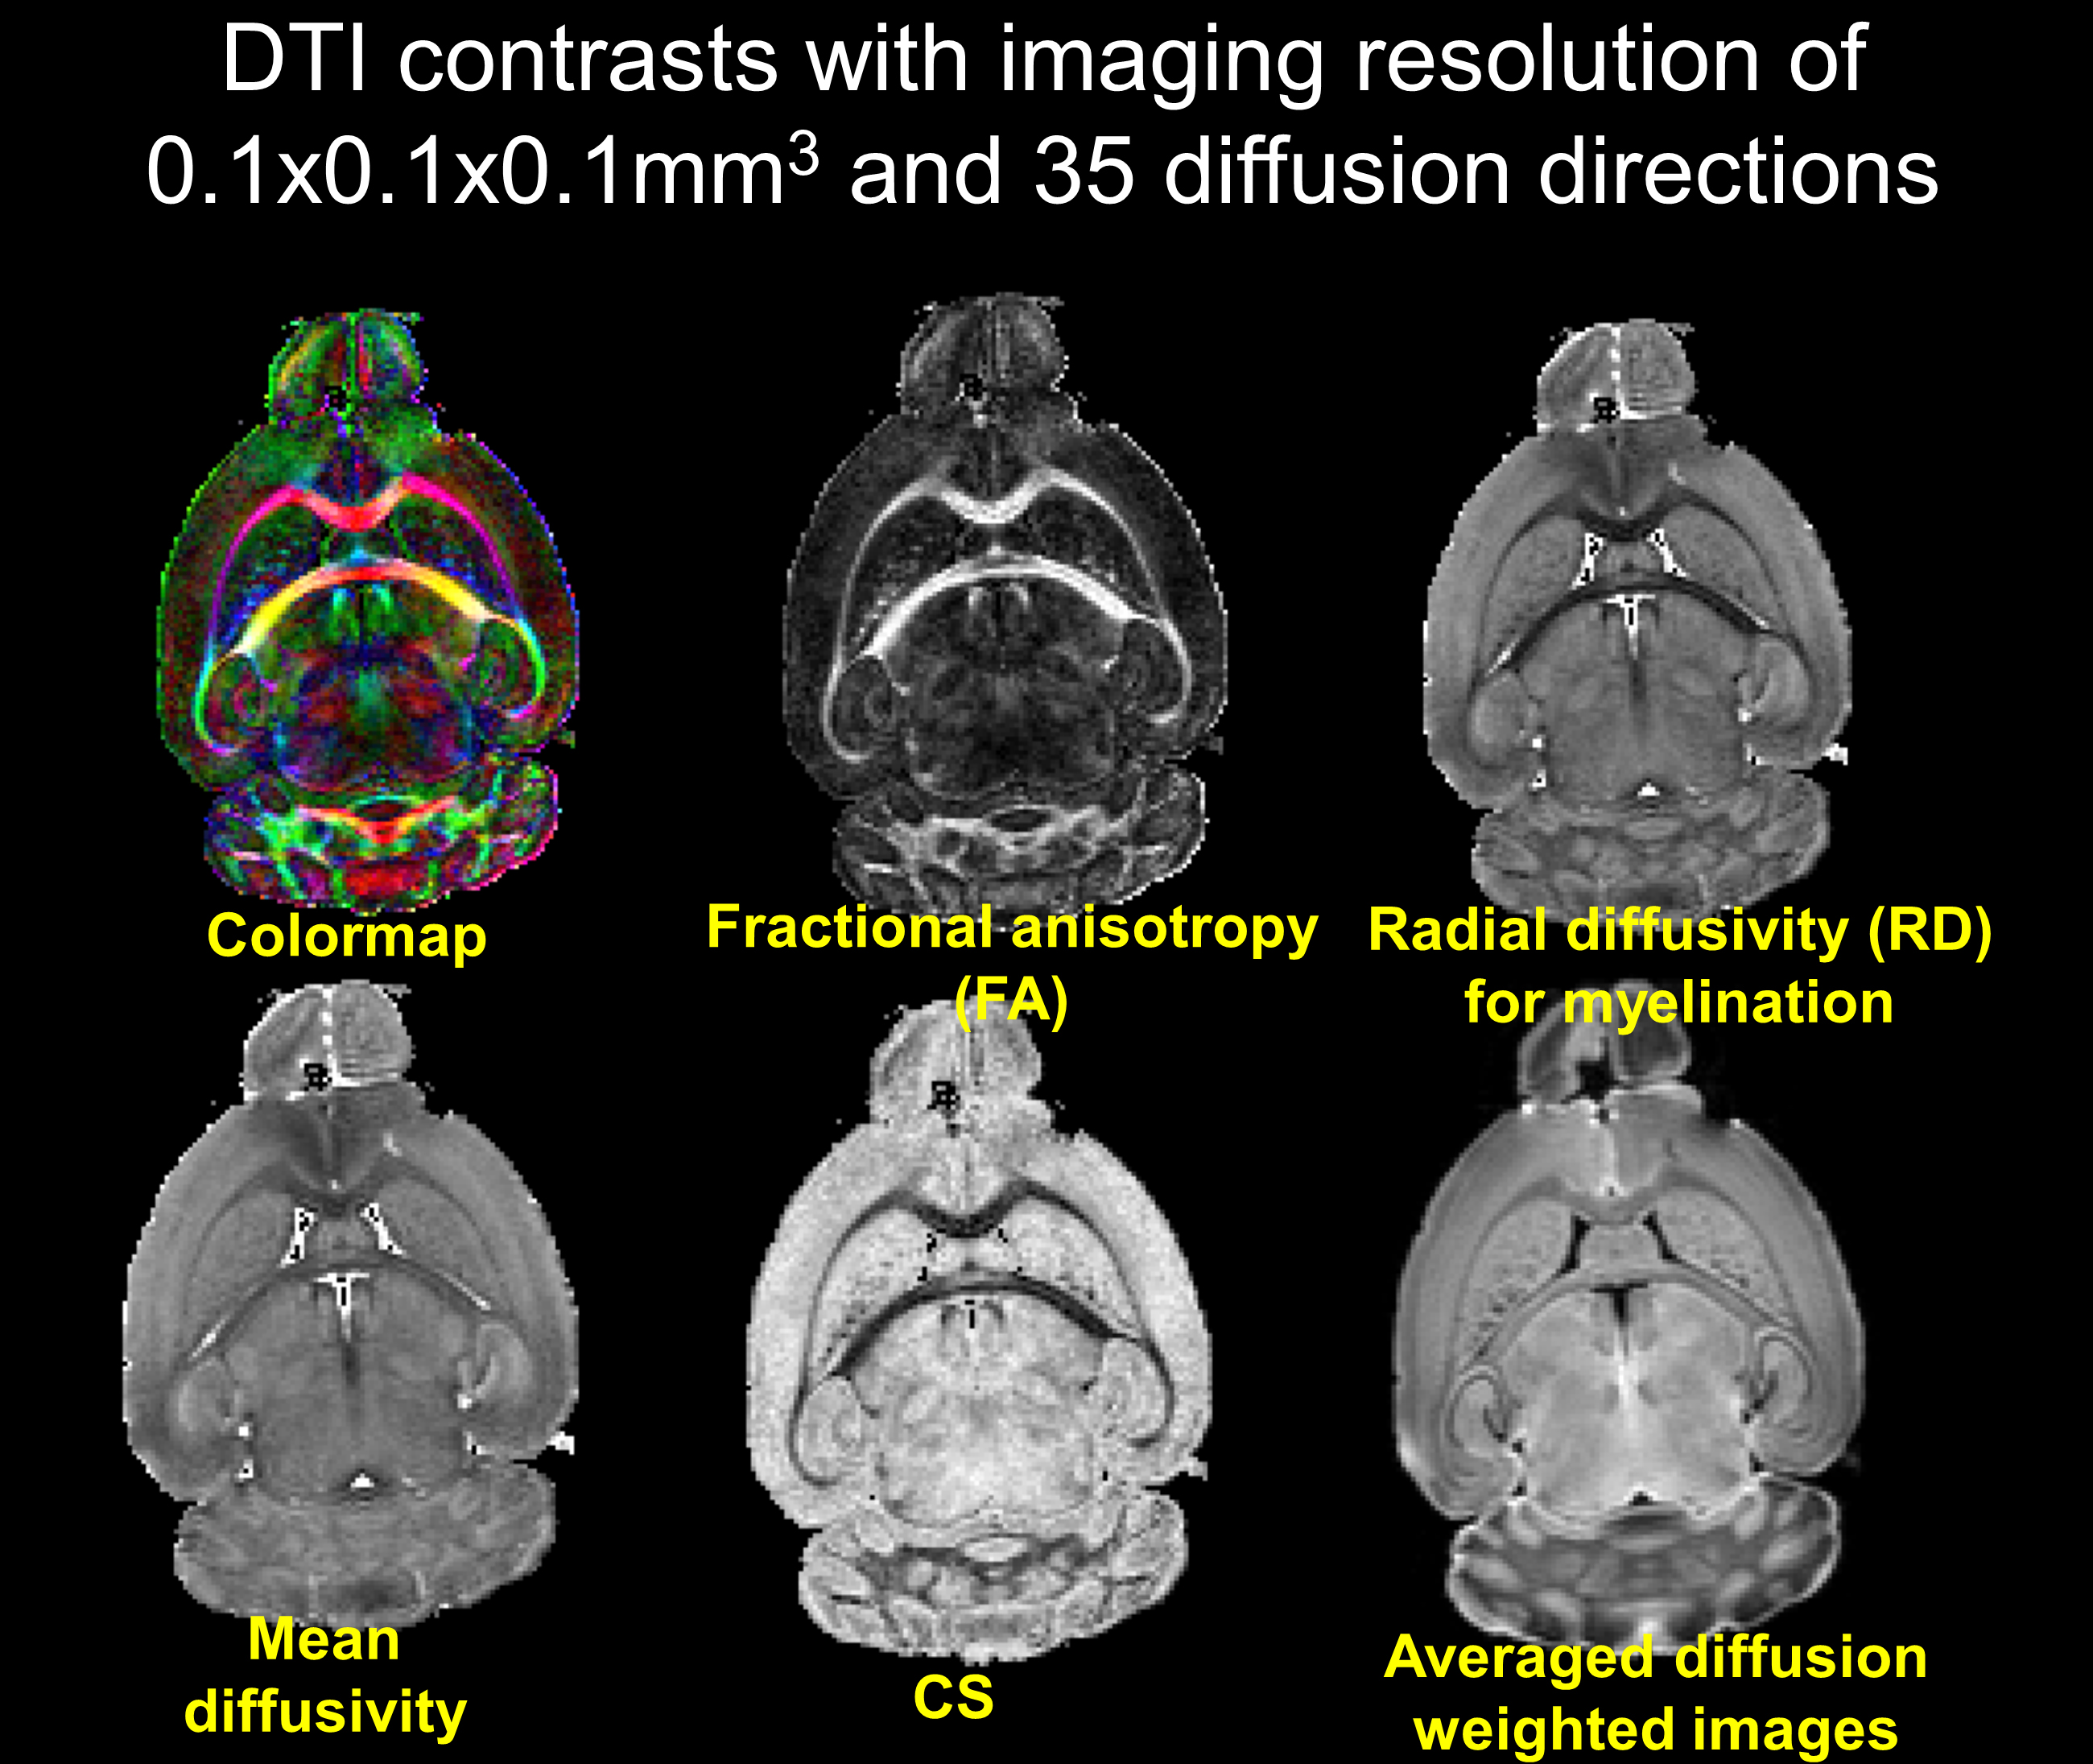
Figure 1: High contrasts from DTI-derived
maps of a representative adult mouse brain with spatial resolution 0.1x0.1x0.1mm3.
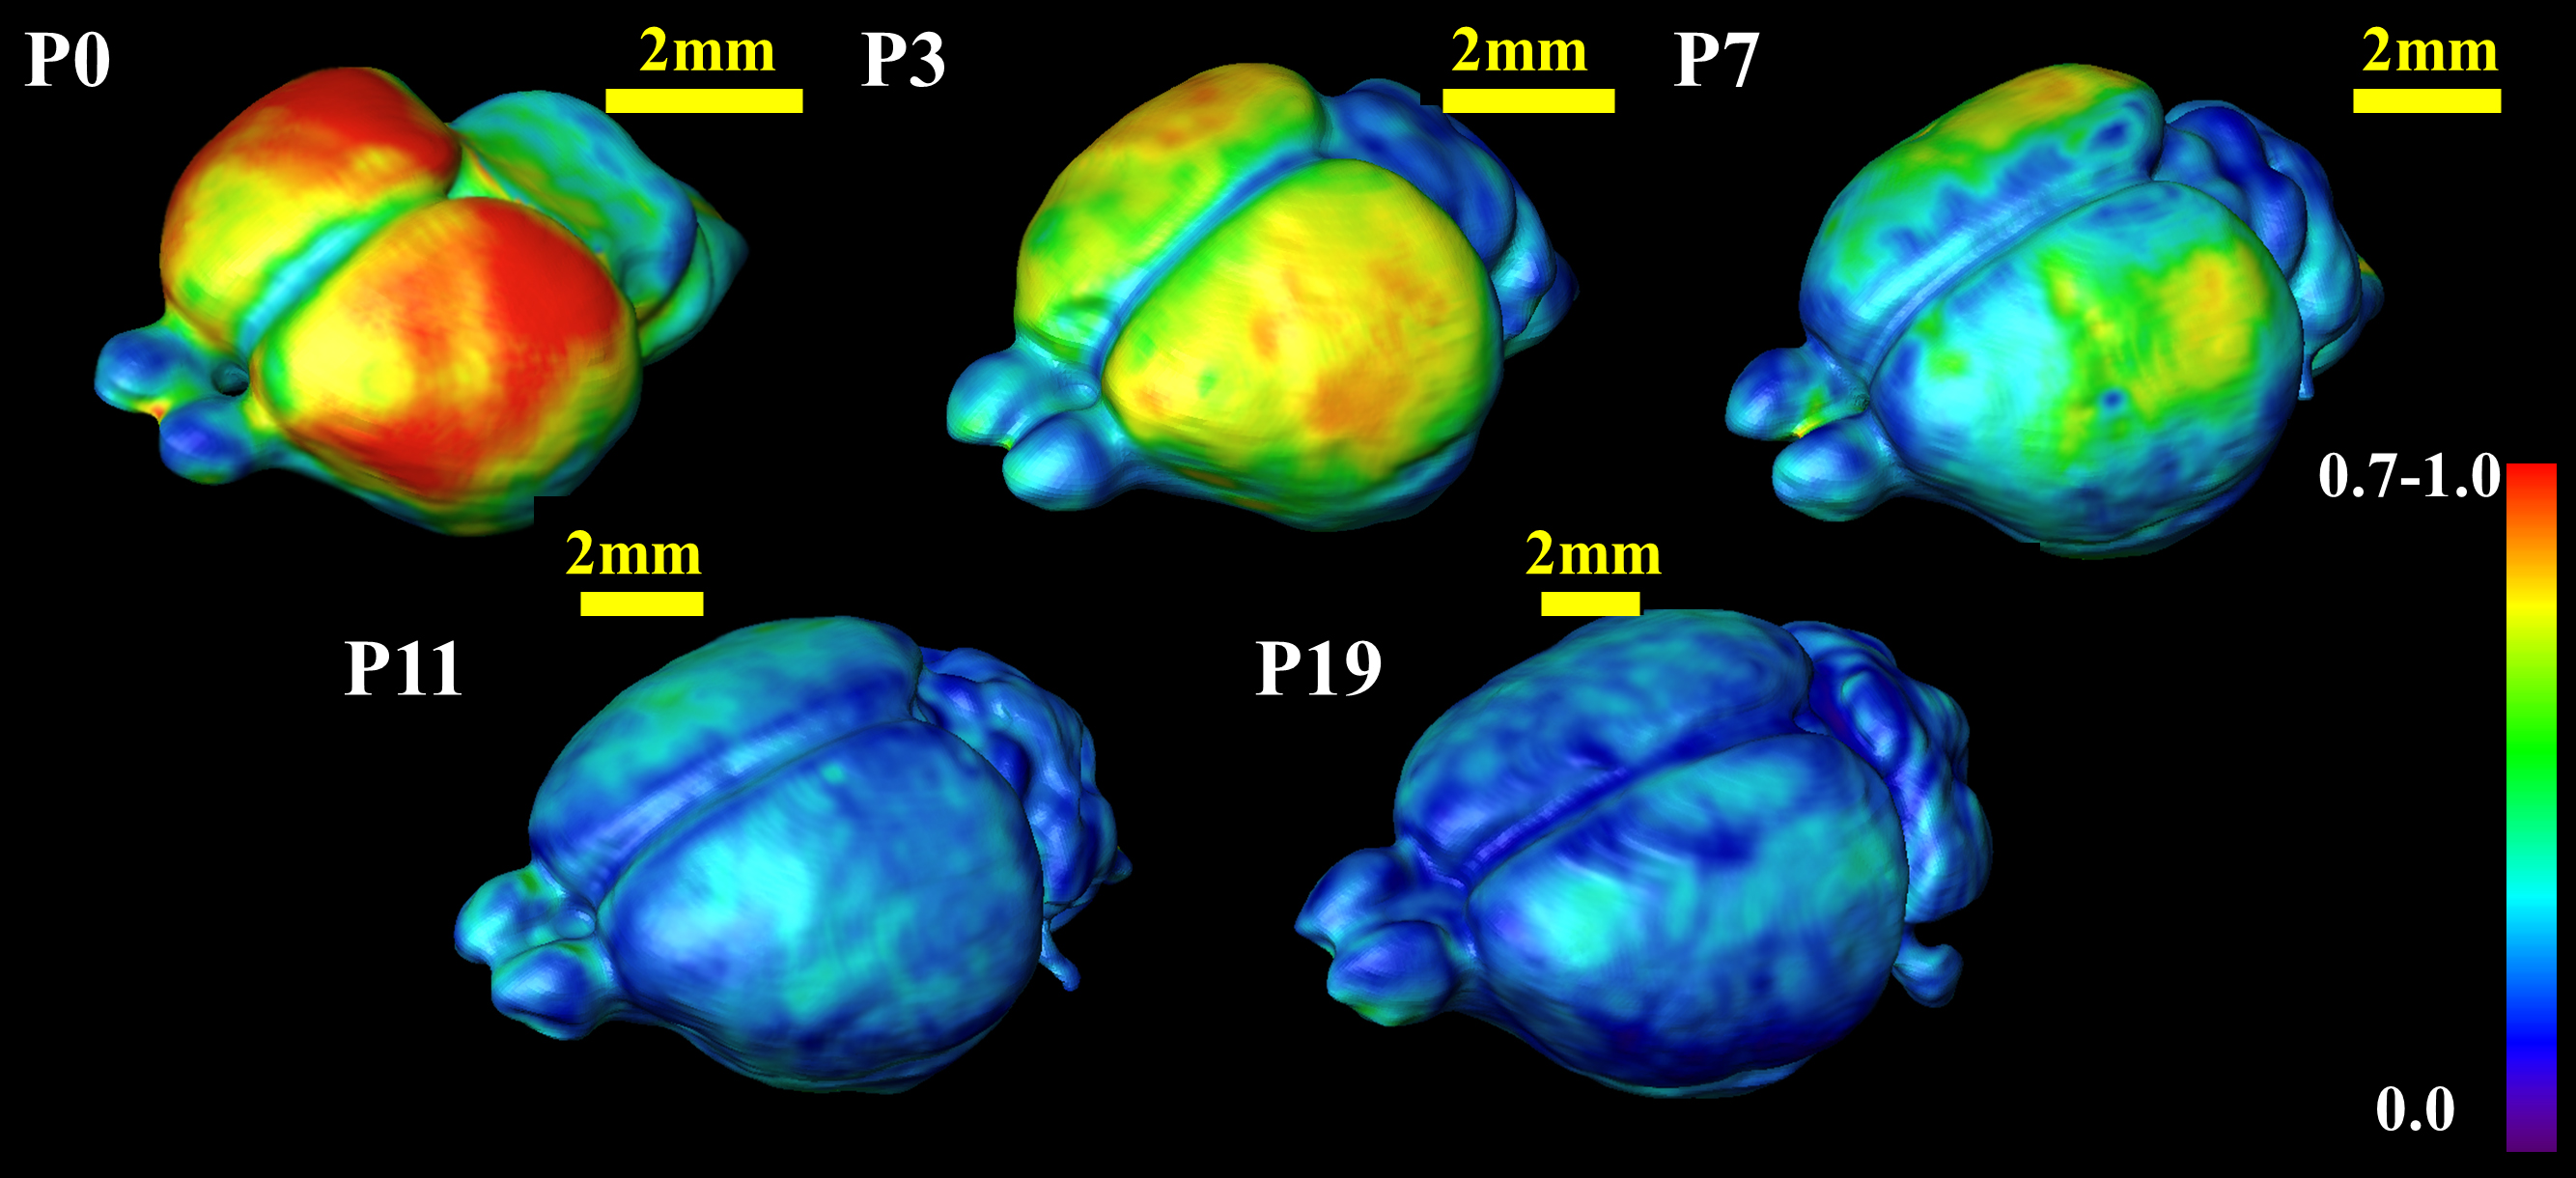
Figure 2: Fractional
anisotropy (FA) mapping of the cortical surfaces of rat brains from P0 to P19.
The color encoding FA values is shown in the color bar.
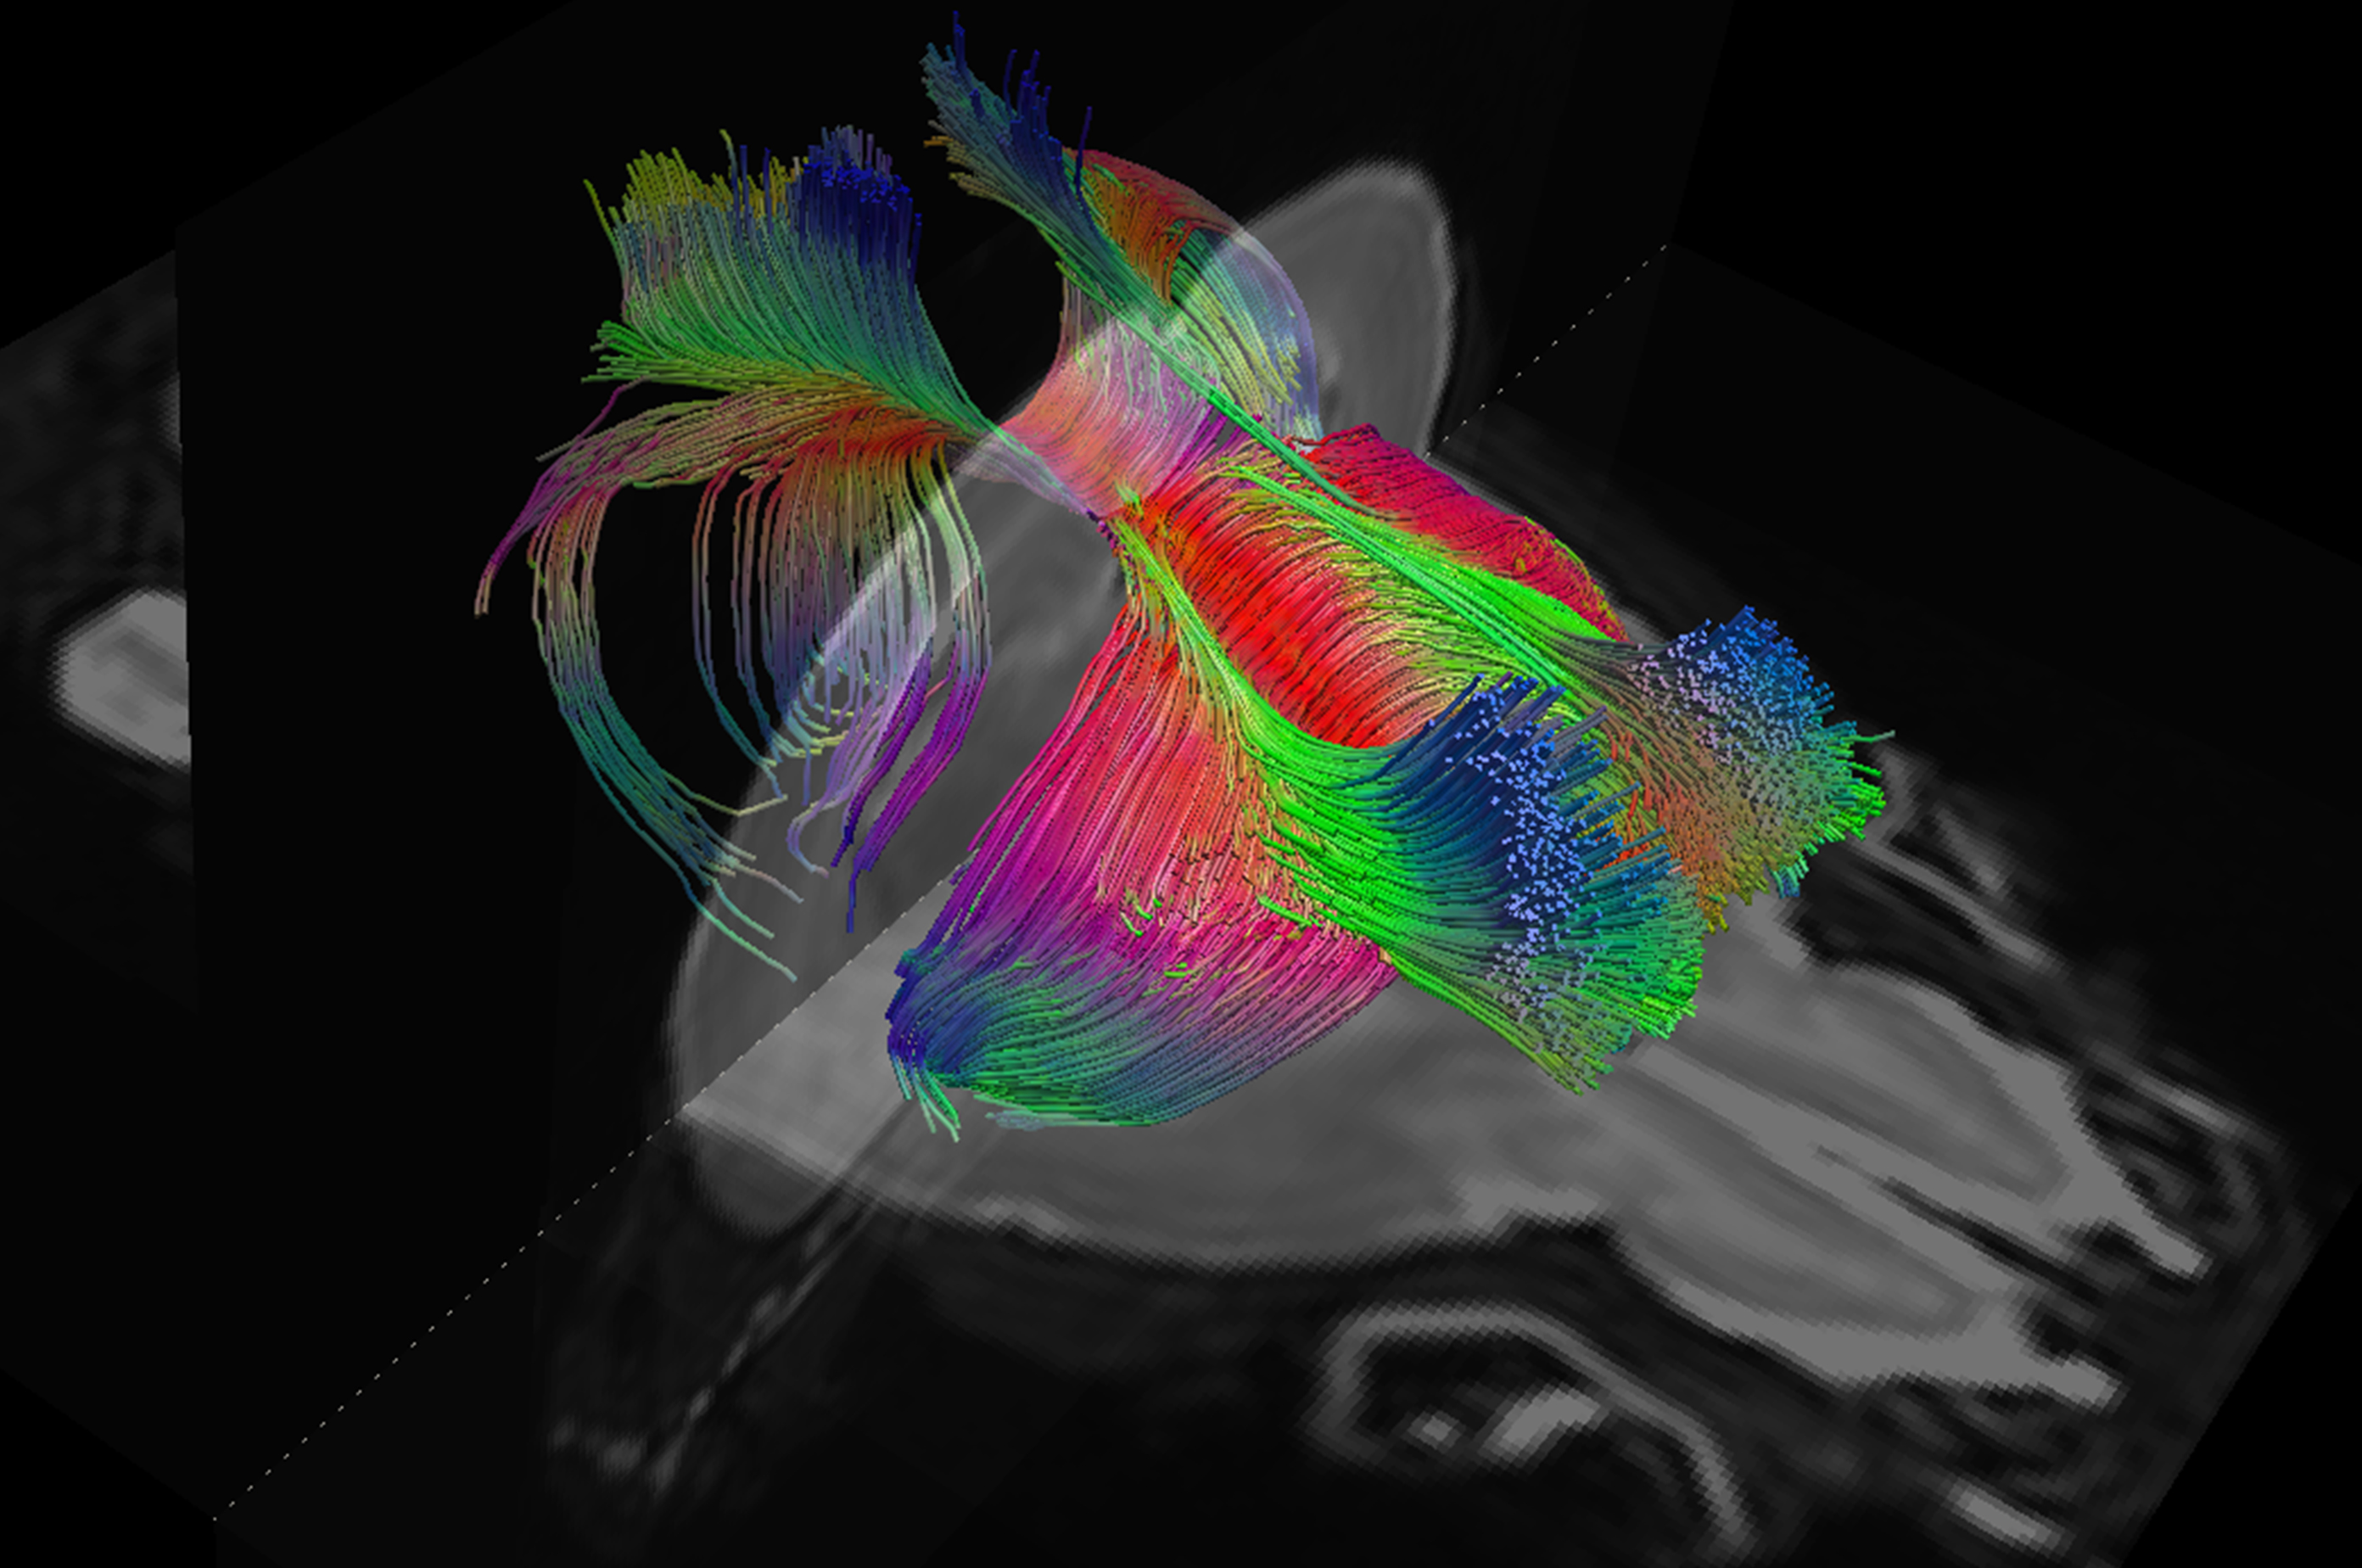
Figure 3: DTI tractography of the mouse brain corpus callosum
with mouse DTI data at 0.1x0.1x0.1mm3 resolution.
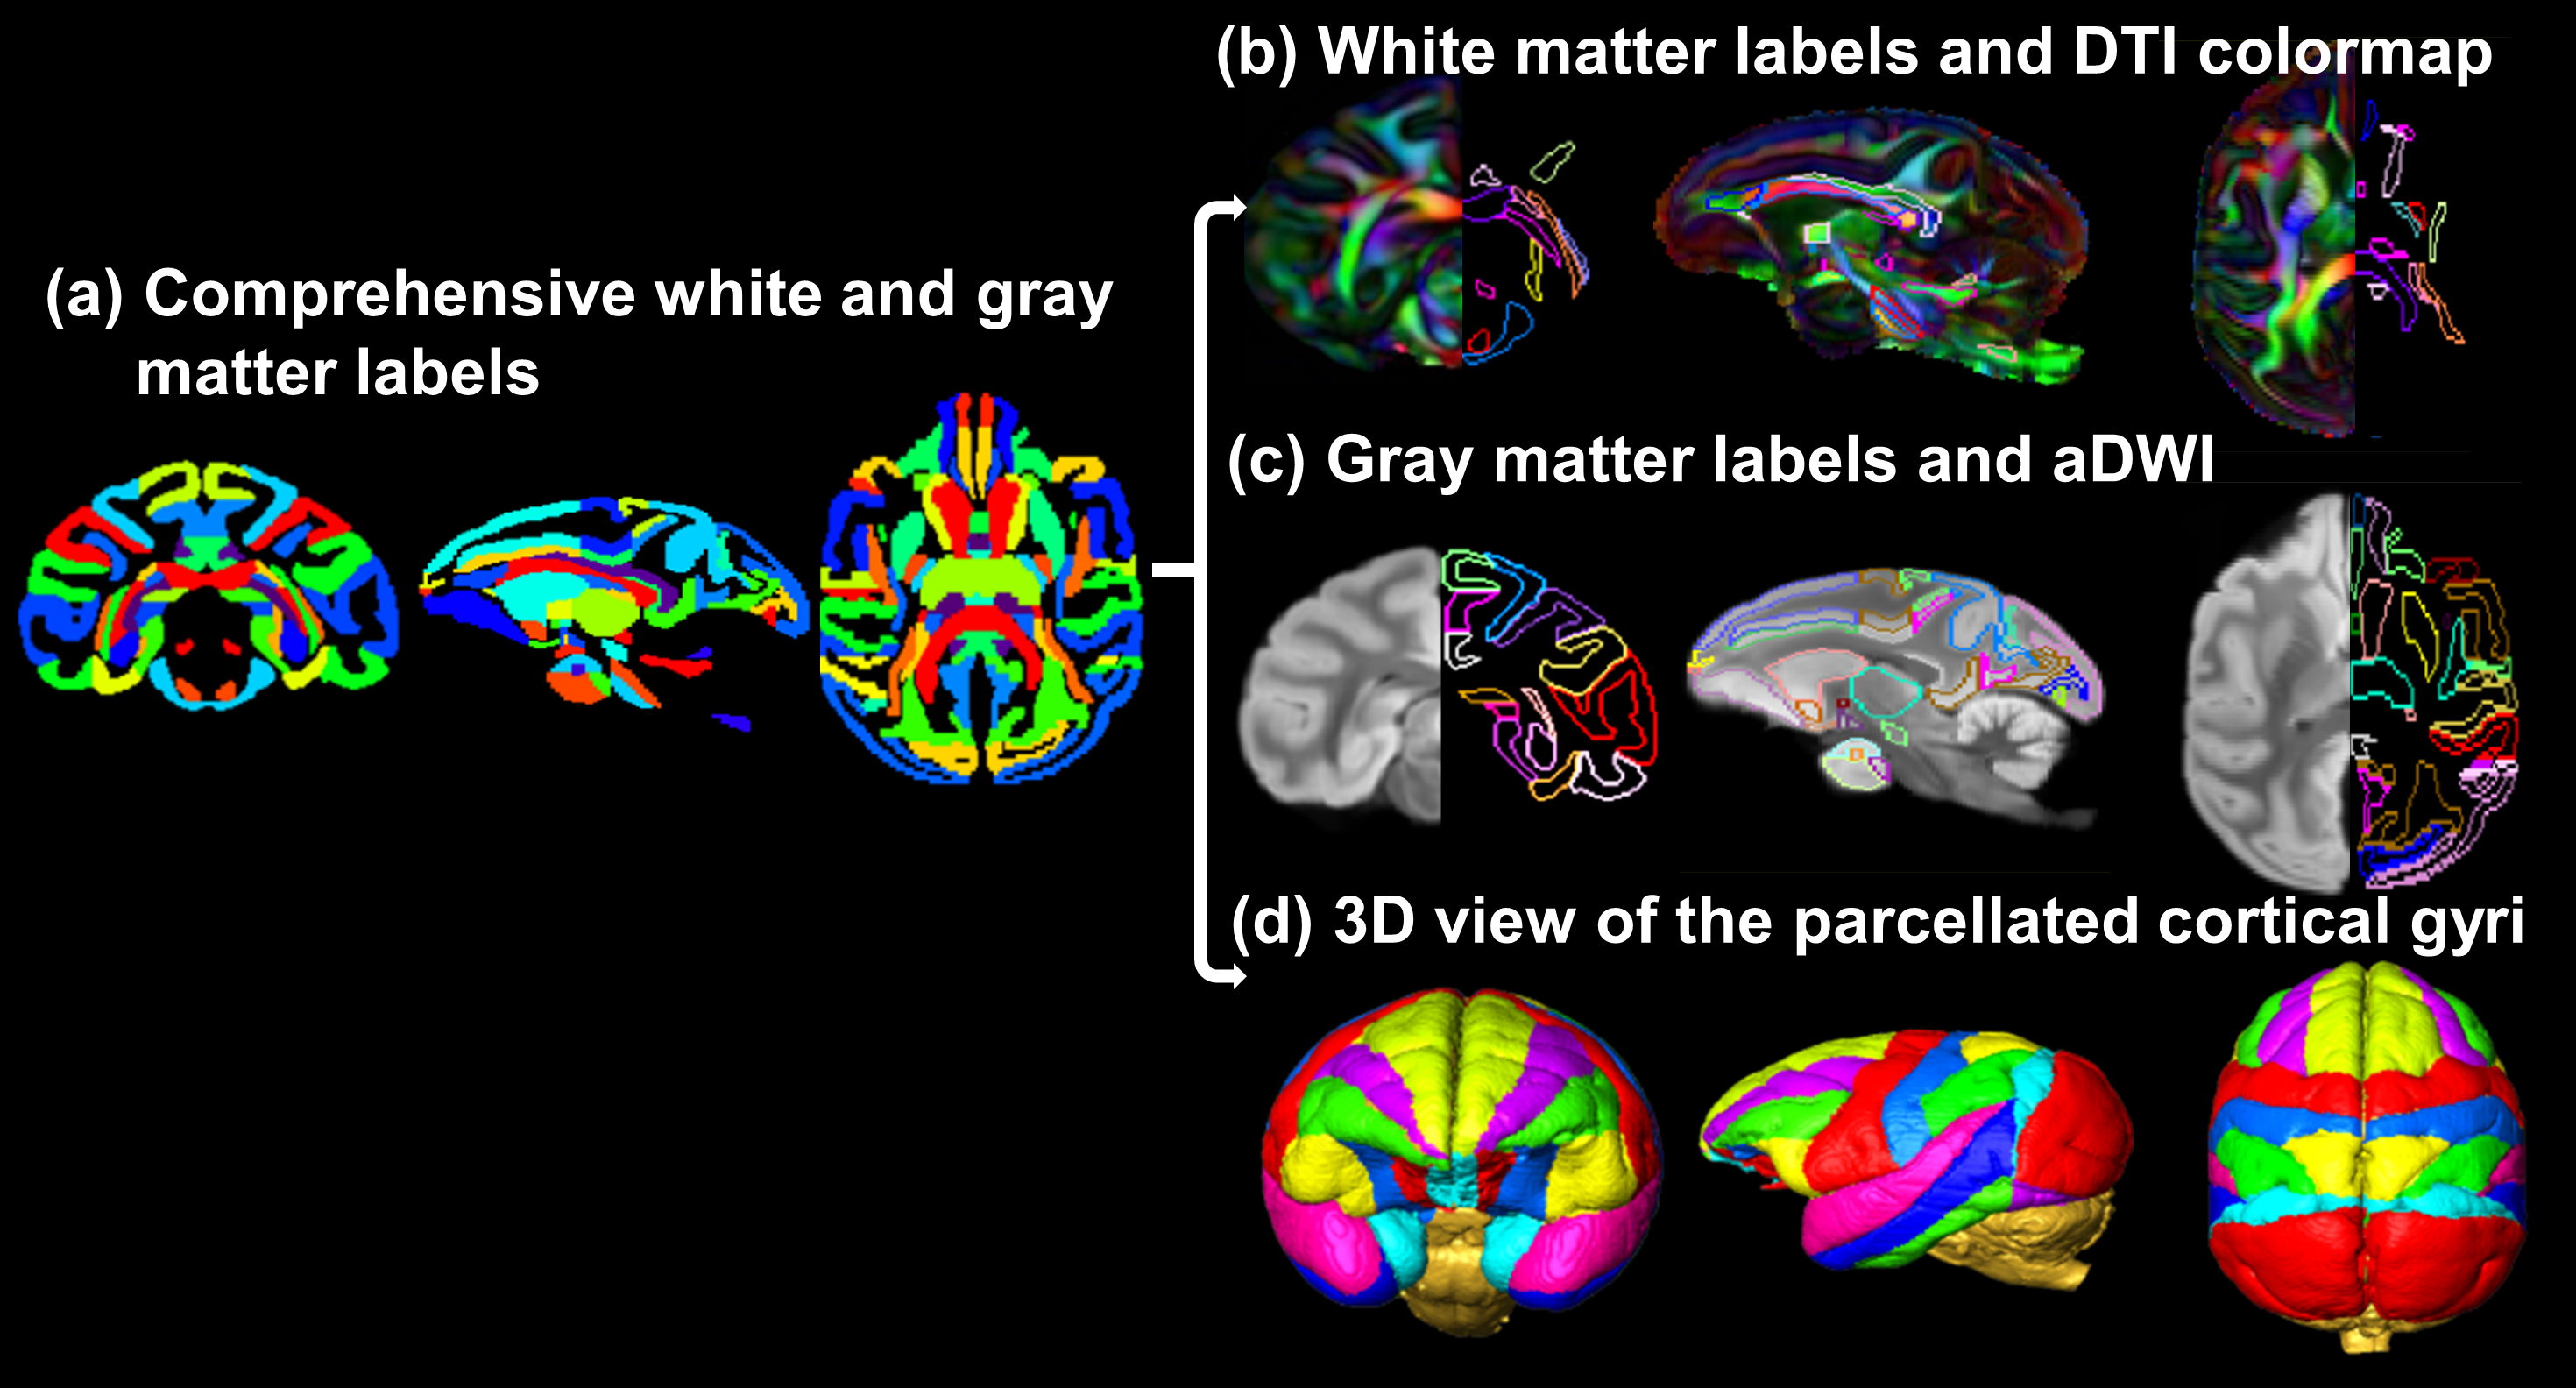
Figure 4: Comprehensive white and gray
matter labels in the axial, parasagittal and coronal orientation. The labels of
both white and gray matter are displayed in a typical axial, parasagittal and
coronal plane in a. In b, the left and right sides of the coronal and axial
planes show the population-averaged orientation-encoded colormaps and their
corresponding white matter tract labels. In c, the left and right sides of the
coronal and axial planes show the population-averaged average
diffusion-weighted images and their corresponding labels of cortical gyri and subcortical
nuclei. The white and gray matter labels are directly overlaid on a
parasagittal plane of DTI colormap and average diffusion-weighted image in b, c,
respectively. The anterior, lateral and superior view of the 3D reconstructed
labeled cortical gyri are displayed in d.