Microstructure/Diffusion-Mediated MRI Signals
1Department of Neuroscience, Medical University of South Carolina, Charleston, SC, United States
Synopsis
Diffusion MRI is highly sensitive to the microstructural properties of biological tissues, such as cellularity and membrane permeability. However, the connections between standard diffusion measures and specific microstructural properties are complex and subtle, making the biological interpretation of changes in diffusion measures associated with disease very challenging. Microstructural modeling has frequently been combined with diffusion MRI to improve interpretability, but the reliability of model predictions is often limited by uncertainties in their underlying assumptions. Here we review these considerations by examining several examples of how microstructure affects commonly employed diffusion measures.
Target Audience
Researchers and clinicians interested in better understanding the relationships between tissue microstructure and diffusion-mediated MRI signals.Objectives
- Understand the physical meaning of the most common diffusion measures that can be estimated with MRI.
- Describe how specific microstructural properties affect different diffusion measures.
- Appreciate the distinction between pure diffusion measures and diffusion-based model parameters.
Introduction
By adding strong “diffusion encoding gradients” to an MRI pulse sequence, MRI signals can be sensitized to the molecular diffusion of water. The main idea is that diffusion in the presence of a magnetic field gradient causes spin dephasing and hence signal loss that depends on the distance the molecules diffuse. Because water molecules typically move on the order of 10 µm during the time interval between spin excitation and signal readout, diffusion MRI (dMRI) is particularly sensitive to microstructural features on this length scale, such cell sizes and shapes. As changes in microstructure occur in a variety of diseases, dMRI has been widely applied in clinical research.1Pure Diffusion Measures
Water diffusion in biological tissues a complex random process that is only fully characterized by the statistical distribution of all possible displacement paths. However, a handful of summary statistics is usually sufficient to describe the main features of the diffusion process. These are “pure” diffusion measures in being defined solely in terms of water molecule displacements without explicit reference to the tissue’s microstructure. As a consequence, pure diffusion measures are applicable to all tissue types and always have clear-cut physical meanings. By the same token, their biological significance is generally obscure without additional knowledge of the specific tissue and disease of interest.
The most commonly used pure diffusion measure is the diffusivity (aka diffusion coefficient), which effectively gives the mean square distance that water molecules diffuse over a set length of time.2 More precisely,
$$D=\frac{\langle x^{2}\rangle}{2t},\tag{1}$$
where $$$D$$$ is the diffusivity and $$$x$$$ is the displacement over a time interval $$$t$$$. The angle brackets indicate an averaging over all water molecules within a voxel, and t is often referred to as the diffusion time. Another pure diffusion measure is the diffusional kurtosis defined by3
$$K=\frac{\langle x^{4}\rangle}{\langle x^{2}\rangle^2}-3.\tag{2}$$
The kurtosis is always zero if the molecular displacements follow a Gaussian probability distribution (as in free diffusion), and more generally it is a standard index for the degree to which the distribution of displacements is non-Gaussian.
Because diffusion is anisotropic in some tissues (e.g., white matter and skeletal muscle), both the diffusivity and kurtosis may depend on the direction being considered. For this reason, it is often useful to define the mean diffusivity as the average of the diffusivity over all possible directions and the mean kurtosis as the average of the kurtosis over all possible directions.
Effects of Microstructure on Pure Diffusion Measures
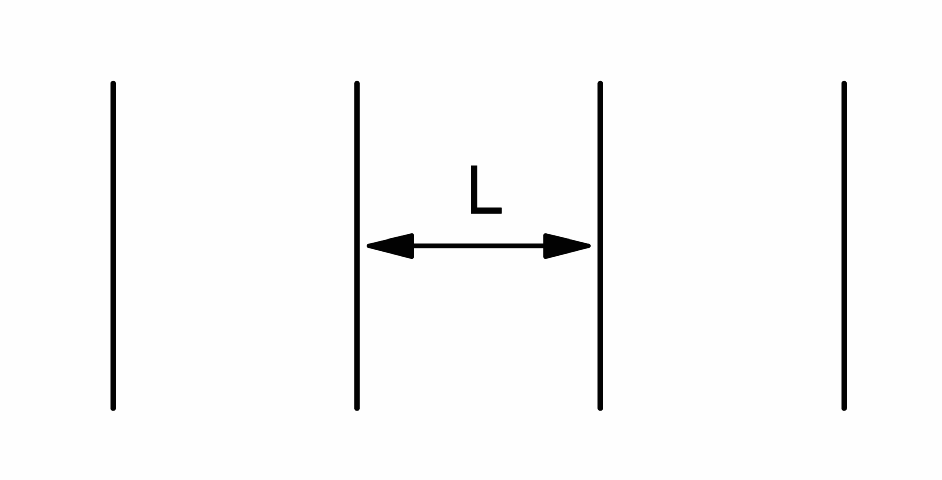
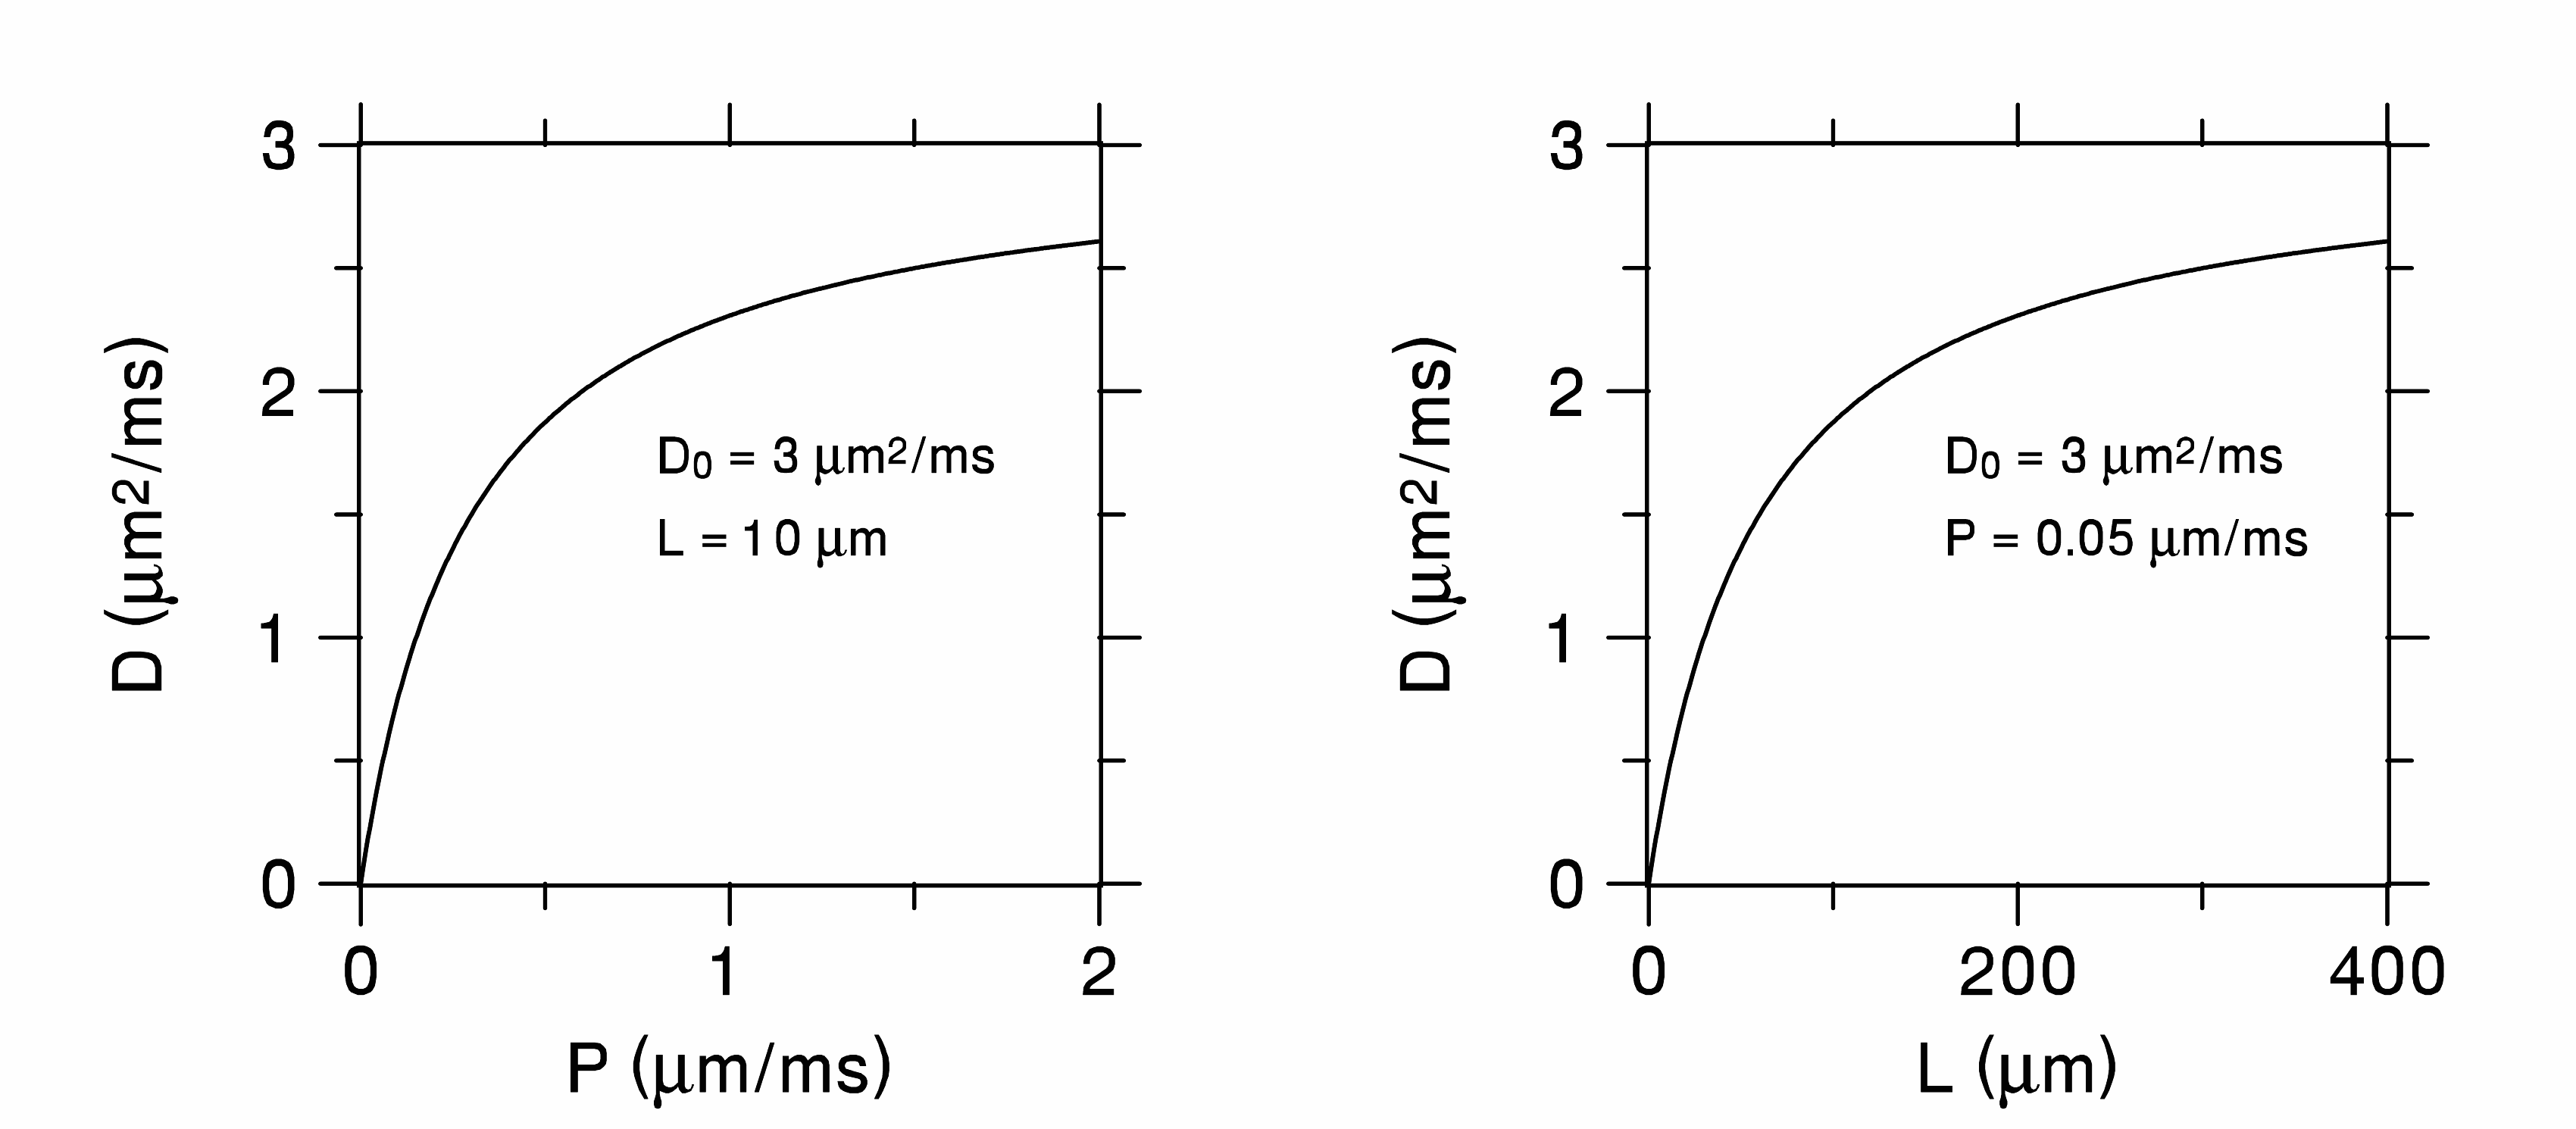
Since the diffusivity is a measure of how far water molecules move on average, it is reduced in tissues, relative to free water, by anything that hinders water motion. This can be macromolecules, organelles, and, most importantly, plasma membranes. A simple example is diffusion in one-dimension between equally spaced membranes, all having the same permeability, $$$P$$$ (see Figure 1). For long diffusion times, the diffusivity of this system is4,5
$$\frac{PLD_{0}}{PL+D_{0}},\tag{3}$$
where is $$$L$$$ the membrane spacing and $$$D_{0}$$$ is the diffusivity of free water. Plots of $$$D$$$ as functions of $$$P$$$ and $$$L$$$ are in shown in Figure 2. For either large $$$P$$$ or $$$L$$$, the diffusivity approaches that of free water, while it goes to zero for small $$$P$$$ or $$$L$$$. Note the ambiguity here: the observation of a reduced diffusivity could be due to either a lower permeability or spacing or some combination of both. Ambiguities of this type occur frequently in trying to ascribe diffusion changes to specific microstructural properties.
As a second example, consider a voxel comprised of two distinct microstructural compartments, $$$A$$$ and $$$B$$$, with diffusivities $$$D_{A}$$$ and $$$D_{B}$$$, respectively. Assume also that diffusion within each individual compartment is Gaussian so that both of the compartmental kurtoses vanish. The total diffusivity of the full voxel is simply the weighted average3
$$D=fD_{A}+(1-f)D_{B},\tag{4}$$
where $$$f$$$ is the water fraction for compartment $$$A$$$, and the total kurtosis is given by
$$K=3f(1-f)\frac{(D_{A}-D_{B})^2}{D^2}.\tag{5}$$
This expression for the kurtosis can be rewritten as
$$K=3\frac{\delta^2D}{D^2}\tag{6},$$ where $$\delta^2D=f(1-f)(D_{A}-D_{B})^2\tag{7}$$ is the variance for the distribution of compartmental diffusivities. Thus the kurtosis is equal to three times the squared coefficient of variation for the intra-voxel diffusivities. The form of Equation (6) actually holds for systems with an arbitrary number of Gaussian compartments, and so the kurtosis can be interpreted as a measure of the heterogeneity of the intra-voxel diffusion environment for these types of models. Even more generally, but less precisely, the kurtosis may be considered as an index for the microstructural “complexity” of a diffusive medium, with free water being simple ($$$K=0$$$) and biological tissues being complex ($$$K>0$$$).3
Model Parameters Derived from Diffusion MRI
In order to make quantitative predictions for microstructural parameters from dMRI data, it is necessary to make a model of how tissue microstructure influences diffusion. Such models are specific to the tissue of interest and are almost always highly idealized, since tissue microstructure is usually far too complicated to represent in detail.6 An example of this is a proposed connection, $$f_{a}=\frac{K_{\tt max}}{K_{\tt max}+3},\tag{8}$$ between the maximal kurtosis, $$$K_{\tt max}$$$, over all possible directions, and the fraction, $$$f_{a}$$$, of dMRI-visible water within white matter axons.7,8 Here dMRI-visible refers to the fact that myelin water usually contributes little to the dMRI signal (at least on clinical scanners) due to its short T2. Although Equation (8) often gives a fair approximation,9 its accuracy is limited by at least two simplifying assumptions. First, in deriving Equation (8) it is supposed that all the axons within each voxel are oriented parallel to a single plane (which need not be specified). Thus, Equation (8) can fail when the pattern of intra-voxel fiber crossings is more complicated than this. Second, Equation (8) also neglects any T2 differences between the intra-axonal and extra-axonal water, which may cause a significant bias.10 This illustrates how specific predictions for microstructural parameters provided by diffusion-based modeling should be interpreted with caution.
Acknowledgements
This work was supported in part by a grant from the National Institutes of Health (R01AG057602).References
- Le Bihan D, Iima M. Diffusion magnetic resonance imaging: what water tells us about biological tissues. PLoS biology. 2015 Jul 23;13(7):e1002203.
- Novikov DS, Kiselev VG. Effective medium theory of a diffusion‐weighted signal. NMR in Biomedicine. 2010 Aug 1;23(7):682-97.
- Jensen JH, Helpern JA. MRI quantification of non‐Gaussian water diffusion by kurtosis analysis. NMR in Biomedicine. 2010 Aug 1;23(7):698-710.
- Crick F. Diffusion in embryogenesis. Nature. 1970 Jan;225(5231):420.
- Yablonskiy DA, Sukstanskii AL. Theoretical models of the diffusion weighted MR signal. NMR in Biomedicine. 2010 Aug 1;23(7):661-81.
- Novikov DS, Kiselev VG, Jespersen SN. On modeling. Magnetic Resonance in Medicine. 2018.
- Fieremans E, Jensen JH, Helpern JA. White matter characterization with diffusional kurtosis imaging. Neuroimage. 2011 Sep 1;58(1):177-88.
- Hui ES, Glenn GR, Helpern JA, Jensen JH. Kurtosis analysis of neural diffusion organization. Neuroimage. 2015 Feb 1;106:391-403.
- Jelescu IO, Zurek M, Winters KV, Veraart J, Rajaratnam A, Kim NS, Babb JS, Shepherd TM, Novikov DS, Kim SG, Fieremans E. In vivo quantification of demyelination and recovery using compartment-specific diffusion MRI metrics validated by electron microscopy. Neuroimage. 2016 May 15;132:104-14.
- Veraart J, Novikov DS, Fieremans E. TE dependent Diffusion Imaging (TEdDI) distinguishes between compartmental T2 relaxation times. Neuroimage. 2017 Sep 19.
Figures