5666
INSPECTOR - A Tool for Teaching Magnetic Resonance Spectroscopy1Biomedical Engineering and Radiology, Columbia University, New York, NY, United States
Synopsis
Magnetic resonance spectroscopy (MRS) is a powerful tool for biomedical research and clinical diagnostics of virtually all disorders that possess distinct metabolic signatures. The importance of literacy in MRS data analysis and interpretation thus cannot be overstated. INSPECTOR is a graphical user interface (GUI)-based software package for MRS data quality assessment, processing, and analysis with visualization capabilities that make it ideal for educational settings. Here I discuss the suitability of INSPECTOR for hands-on learning of MRS processing and quantification strategies.
Purpose
Magnetic resonance spectroscopy (MRS) enables the non-invasive quantification of chemical compounds from living tissues, which makes it a powerful tool for biomedical research and clinical diagnostics of virtually all disorders that possess distinct metabolic signatures. Correspondingly, a basic PubMed search for ‘Magnetic Resonance Spectroscopy’ currently yields more than 200,000 results.
The pursuit of high experimental quality should be complemented by similarly physically meaningful data processing and the reliable extraction of biochemical information. The relevance of fluency in MRS data analysis techniques therefore cannot be overstated.
INSPECTOR [1-3] is a one-stop-shop software program for processing and analysis of in vivo MRS data. I here present INSPECTOR as a tool for teaching and discuss its suitability for interactive, hands-on learning of MRS processing and quantification strategies.
Software
Overview.
INSPECTOR enables processing and analysis for a range of MRS experiments ranging from simple localization to T1 and T2 series, J-difference editing (JDE) and more. It provides access to every detail of the workflow in an intuitive chronological fashion, enabling data to be visualized, quantified, and exported at every step. INSPECTOR is well-suited for visually demonstrating abstract concepts in the classroom and subsequently reproduction them in student exercises, thereby promoting learning effectiveness and first-hand data literacy.
Supported OS and Data.
INSPECTOR has been developed in Matlab (MathWorks, Natick, MA, USA) as a stand-alone executable for use on Windows, MacOS and Linux operating systems. Currently supported input formats include Siemens (.dat, .rda), General Electric (.7), Philips (.raw, .sdat), Bruker (fid, rawdata.job0) and Varian (fid). Data import and export options are also provided for other software packages including NMRWizard (.par)[4], LCModel (.raw)[5] and jMRUI (.mrui)[6].
Graphical User Interface.
INSPECTOR employs a graphical user interface (GUI); students therefore need neither programming experience nor in-depth previous mathematics knowledge.
Manual and Tooltips.
A user manual detailing software functionalities and the MRS techniques to which they are applied is accessible from within the software. In addition, individual GUI components include tooltips upon mouseover, making INSPECTOR ideally suited for both classroom teaching and self-study.
Protocol Files and Student Exercises.
All software parameters are automatically maintained in protocol files that can be loaded to restore all settings to the exact same state as was saved. Besides convenience and reproducibility, this functionality facilitates the setup and documentation of homework assignments as well as the reproduction of usage errors or student questions.
Download and Installation.
INSPECTOR has been made available for teaching in non-commercial academic settings under a free term-limited license and can be downloaded from the Columbia website: innovation.columbia.edu/technologies/cu17130_inspector. No license is needed to download the manual.
Teaching Modules
Data Formats and Handling.
INSPECTOR provides access to all time- and frequency-domain signals from individual receivers, repetitions, or any combinations thereof of both metabolite and water spectra obtained from various MRS sequences (Figure 1).
Artifacts and Corrections.
A dedicated Quality Assessment (QA) Tool displays the details of selected experiment repetitions both before and after the application of spectral corrections, providing immediate insight and feedback on their functionality and relevance (Figure 2).
Spectral Processing.
Optimal spectral processing is essential for meaningful results. INSPECTOR allows flexible online processing of a single MRS spectrum or the concurrent processing and combination of two spectra, e.g. from a JDE experiment (Figure 3).
Spectral Quantification.
INSPECTOR supports MR spectral quantification with a linear combination model (LCM) of basis spectra in a fully customizable and transparent fashion (Figure 4).
Spectral Simulation and Noise.
The addition of predefined noise to basic MRS simulations or a synthesized brain spectrum enables the demonstration of its impact on MRS data appearance and quantification (Figure 5).
Conclusions
INSPECTOR provides extensive data handling, quality management and visualization options that maximize transparency at every step in the MRS processing chain. Together with graphical interface, protocol functionality, export options, and documentation, this software is well-suited for education in MRS data analysis. INSPECTOR is available to academic institutions free of charge, ready to support teachers in their striving for improved teaching effectiveness and students to reach their learning objectives.Acknowledgements
I am very grateful for the many fruitful discussions I have had with colleagues over the years as well as the wealth of constructive comments I received. Special thanks go to the members of my laboratory (http://juchem.bme.columbia.edu/people) for being the first true users of this software. Their feedback and suggestions have been instrumental for the transition of INSPECTOR from personal software to a general tool useful for others.References
1. Prinsen, H., R.A. de Graaf, G.F. Mason, D. Pelletier, and C. Juchem, Reproducibility measurement of glutathione, GABA, and glutamate: Towards in vivo neurochemical profiling of multiple sclerosis with MR spectroscopy at 7T. J Magn Reson Imaging, 2017. 45(1): p. 187-198.
2. Juchem, C. INSPECTOR - Magnetic Resonance Spectroscopy Software. Columbia TechVenture (CTV), license CU17130. http://innovation.columbia.edu/technologies/cu17130_inspector (2016).
3. Juchem, C., INSPECTOR: The New Kid on the Block, in ISMRM Virtual Study Group Meeting - MR Spectroscopy. https://ismrm.adobeconnect.com/_a1156337412/pvzkfszv1l4s/ (ISMRM member login required, 2017).
4. de Graaf, R.A., G.M. Chowdhury, and K.L. Behar, Quantification of high-resolution (1)H NMR spectra from rat brain extracts. Anal Chem, 2011. 83(1): p. 216-24.
5. Provencher, S.W., Automatic quantitation of localized in vivo 1H spectra with LCModel. NMR Biomed, 2001. 14(4): p. 260-4.
6. jMRUI - Software for clinical and biomedical MRS. http://www.jmrui.eu/
Figures
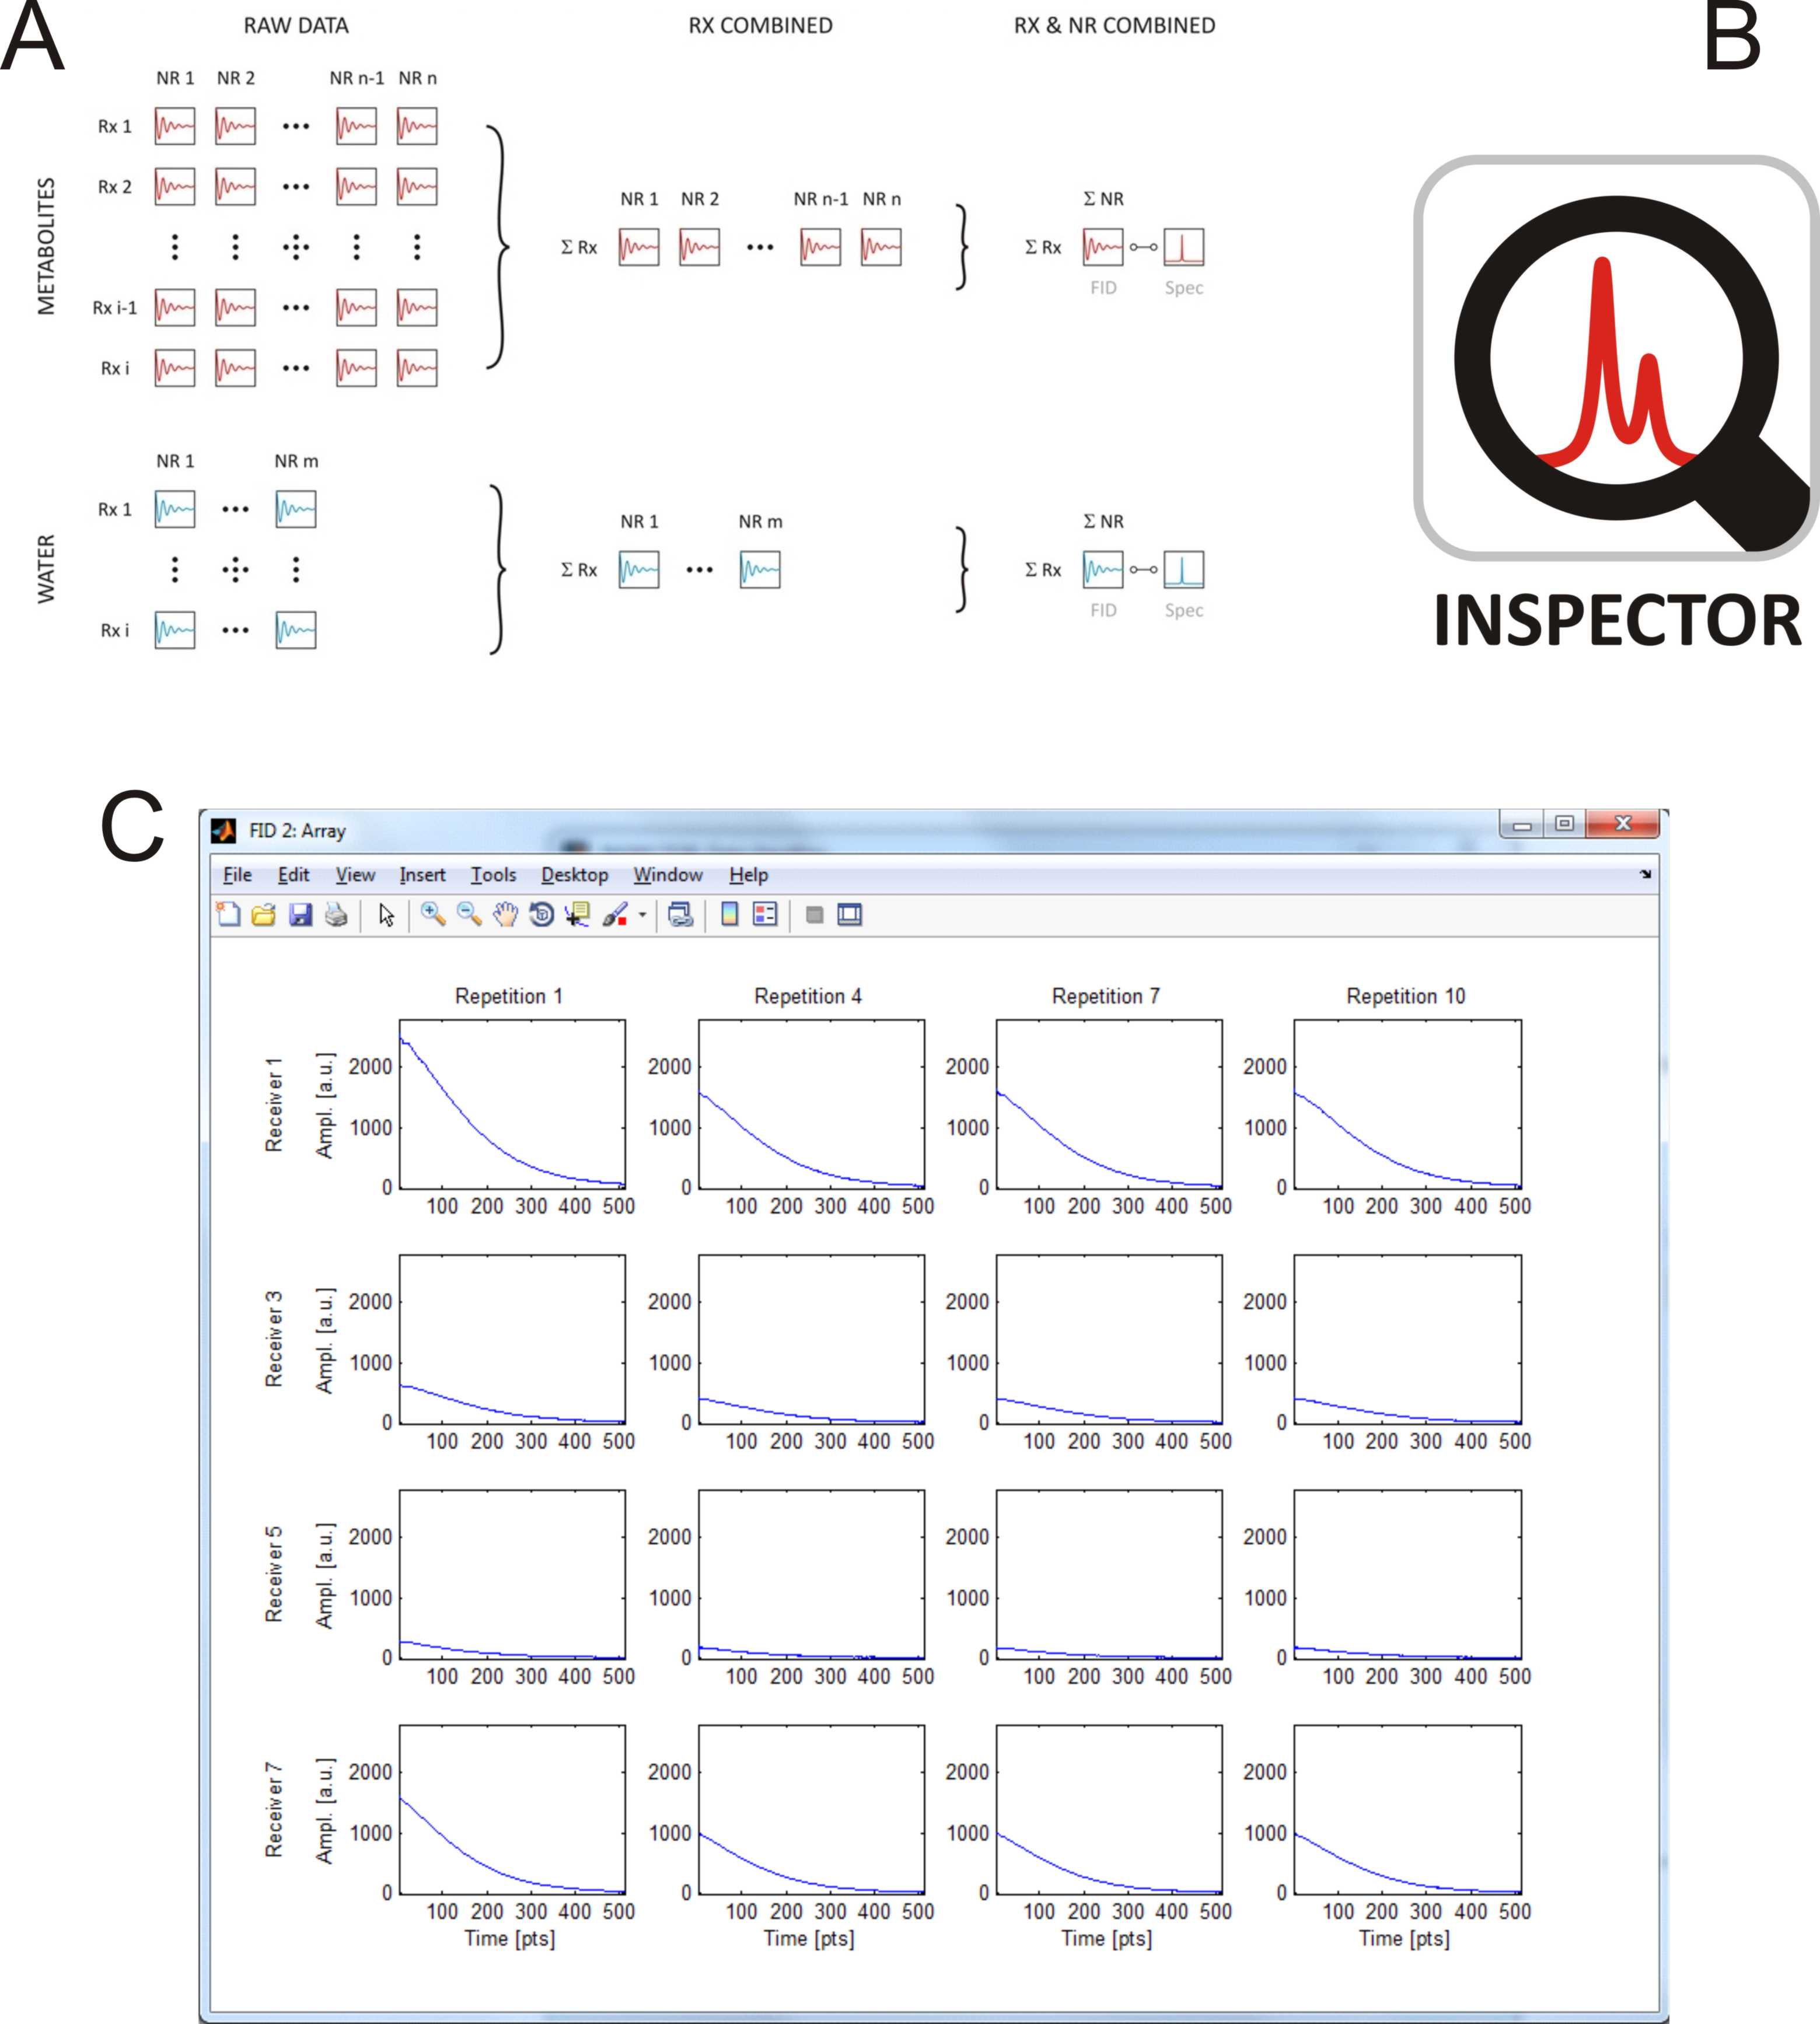
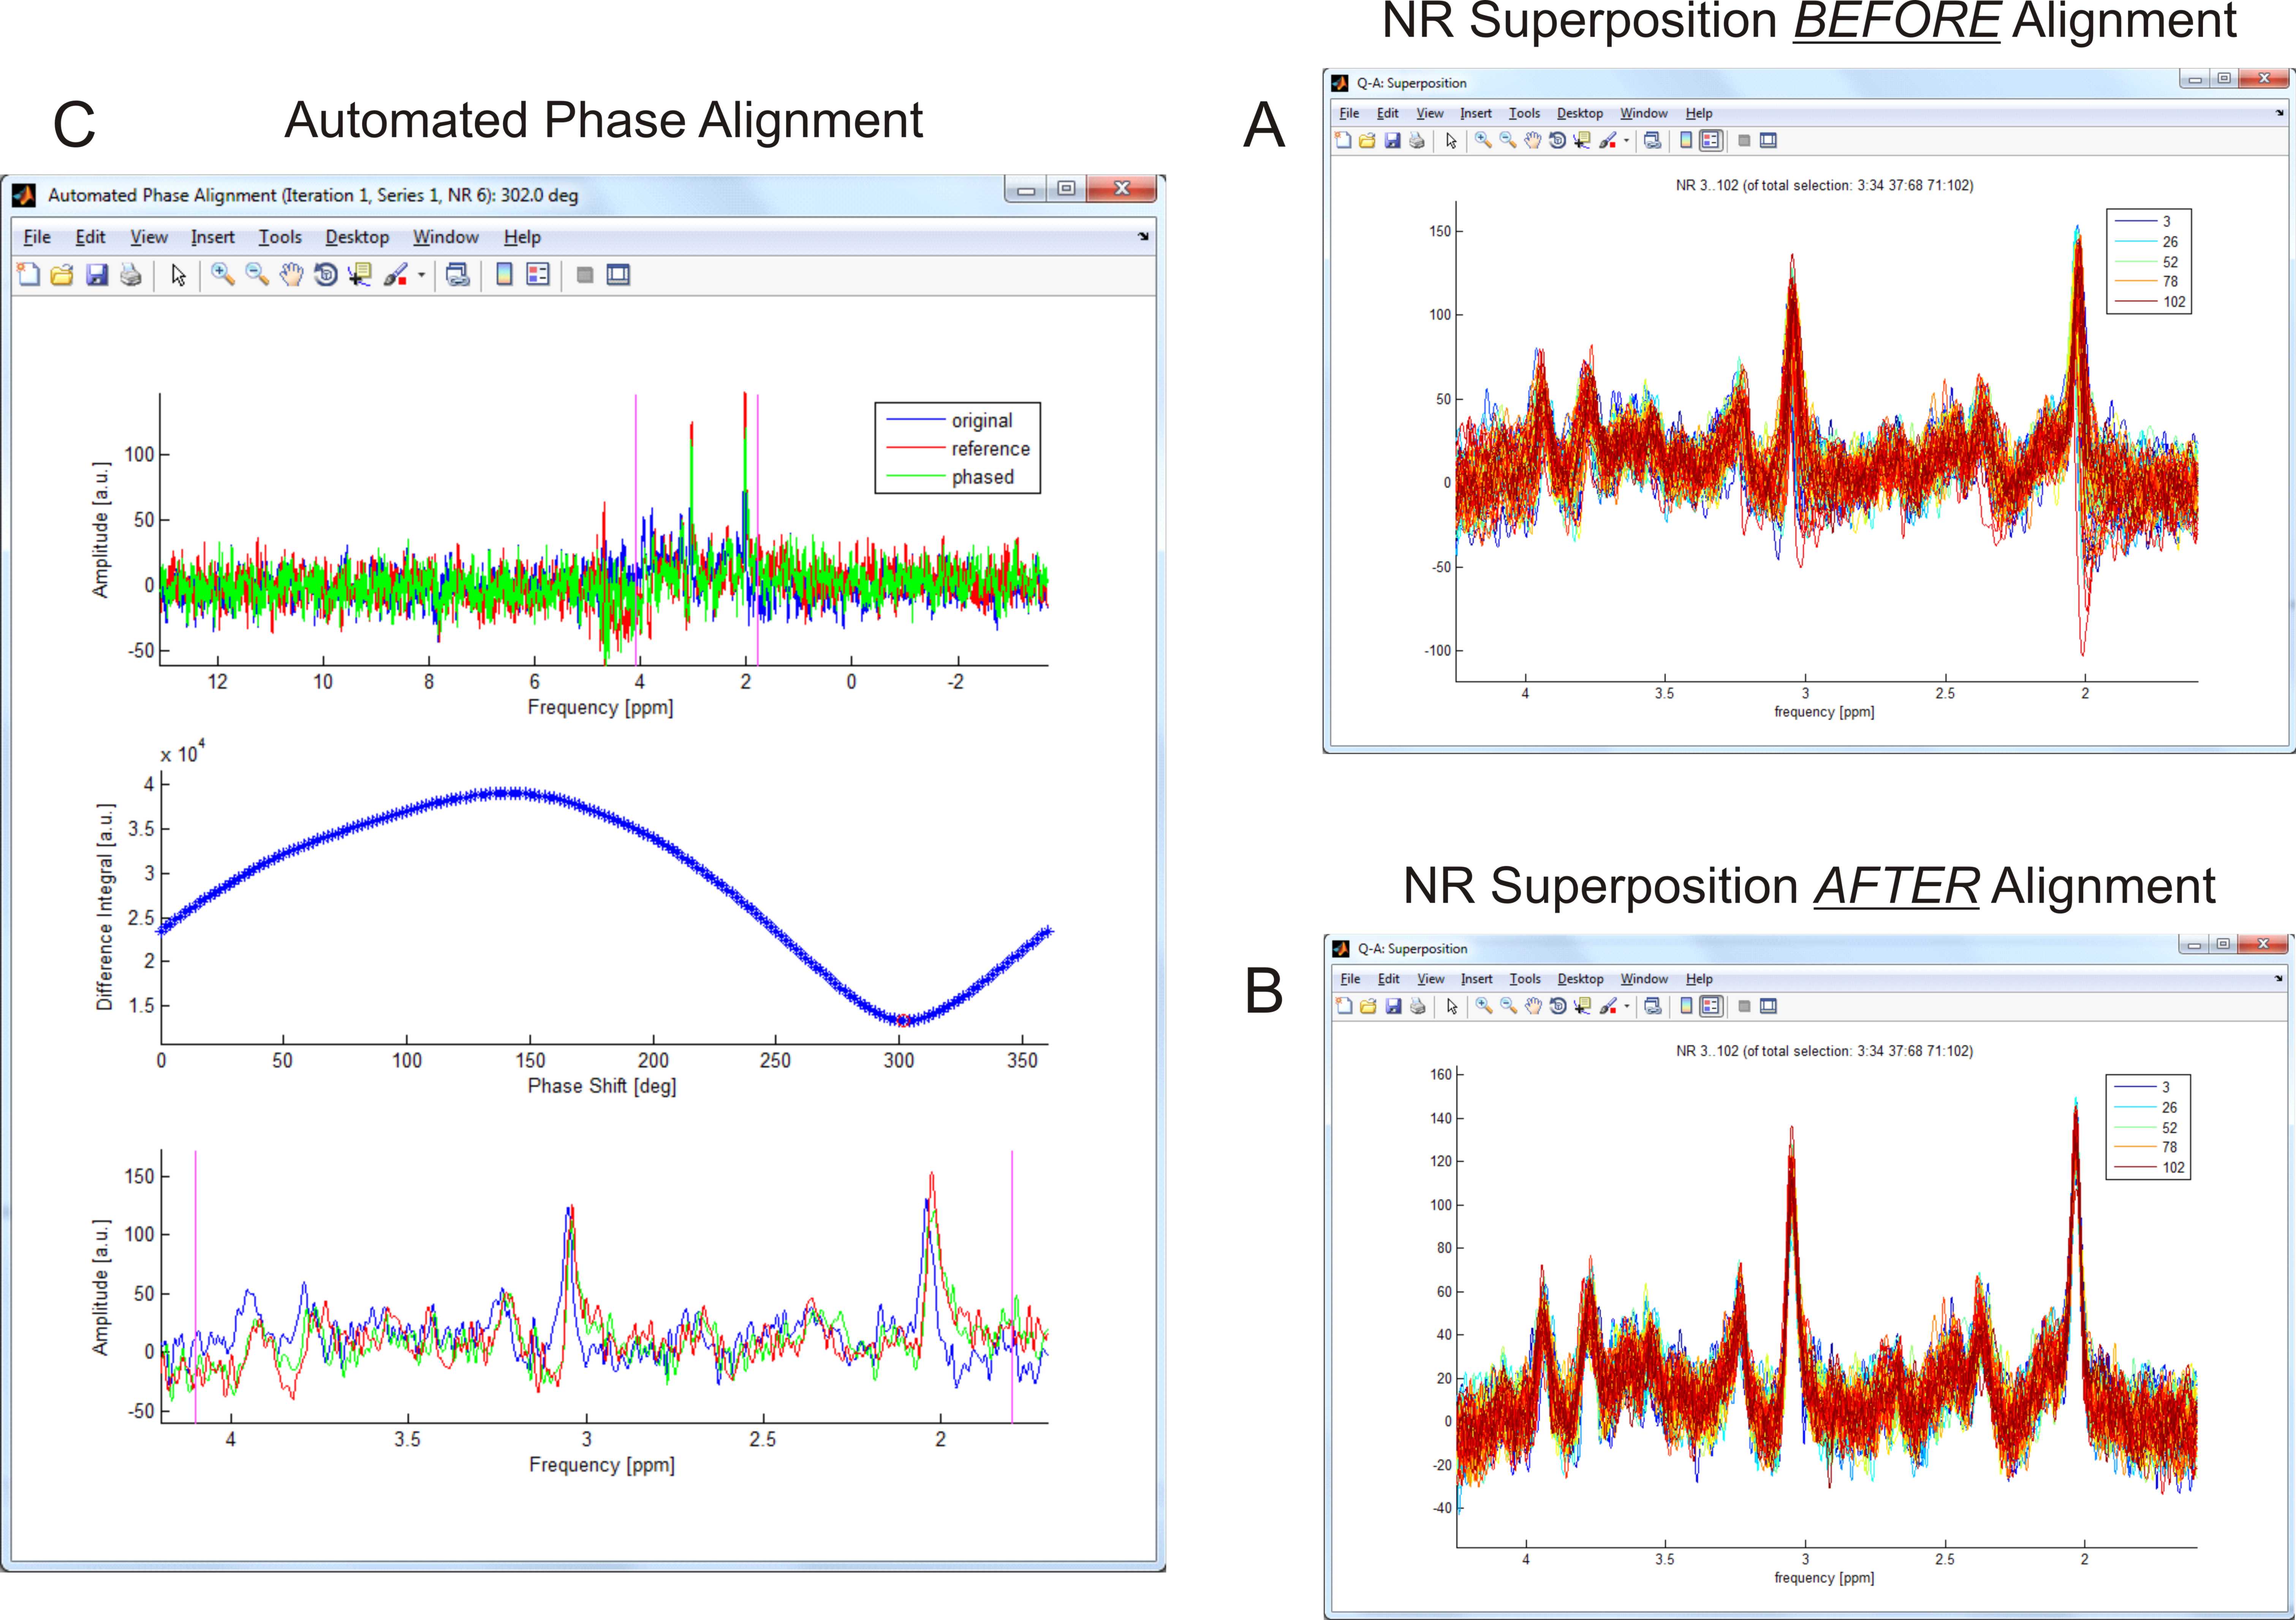
Figure 2: Data Quality and Corrections. The Quality Assessment (QA) tool reveals the relevance of system stability, subject compliance and optimal data processing for the resultant spectral appearance. The visualization of individual MRS repetitions NR before (A) and after (B) the mitigation of respiration-induced phase (C) and frequency (not shown) spread provides an unobstructed view of both impact and quality of the employed correction procedures.
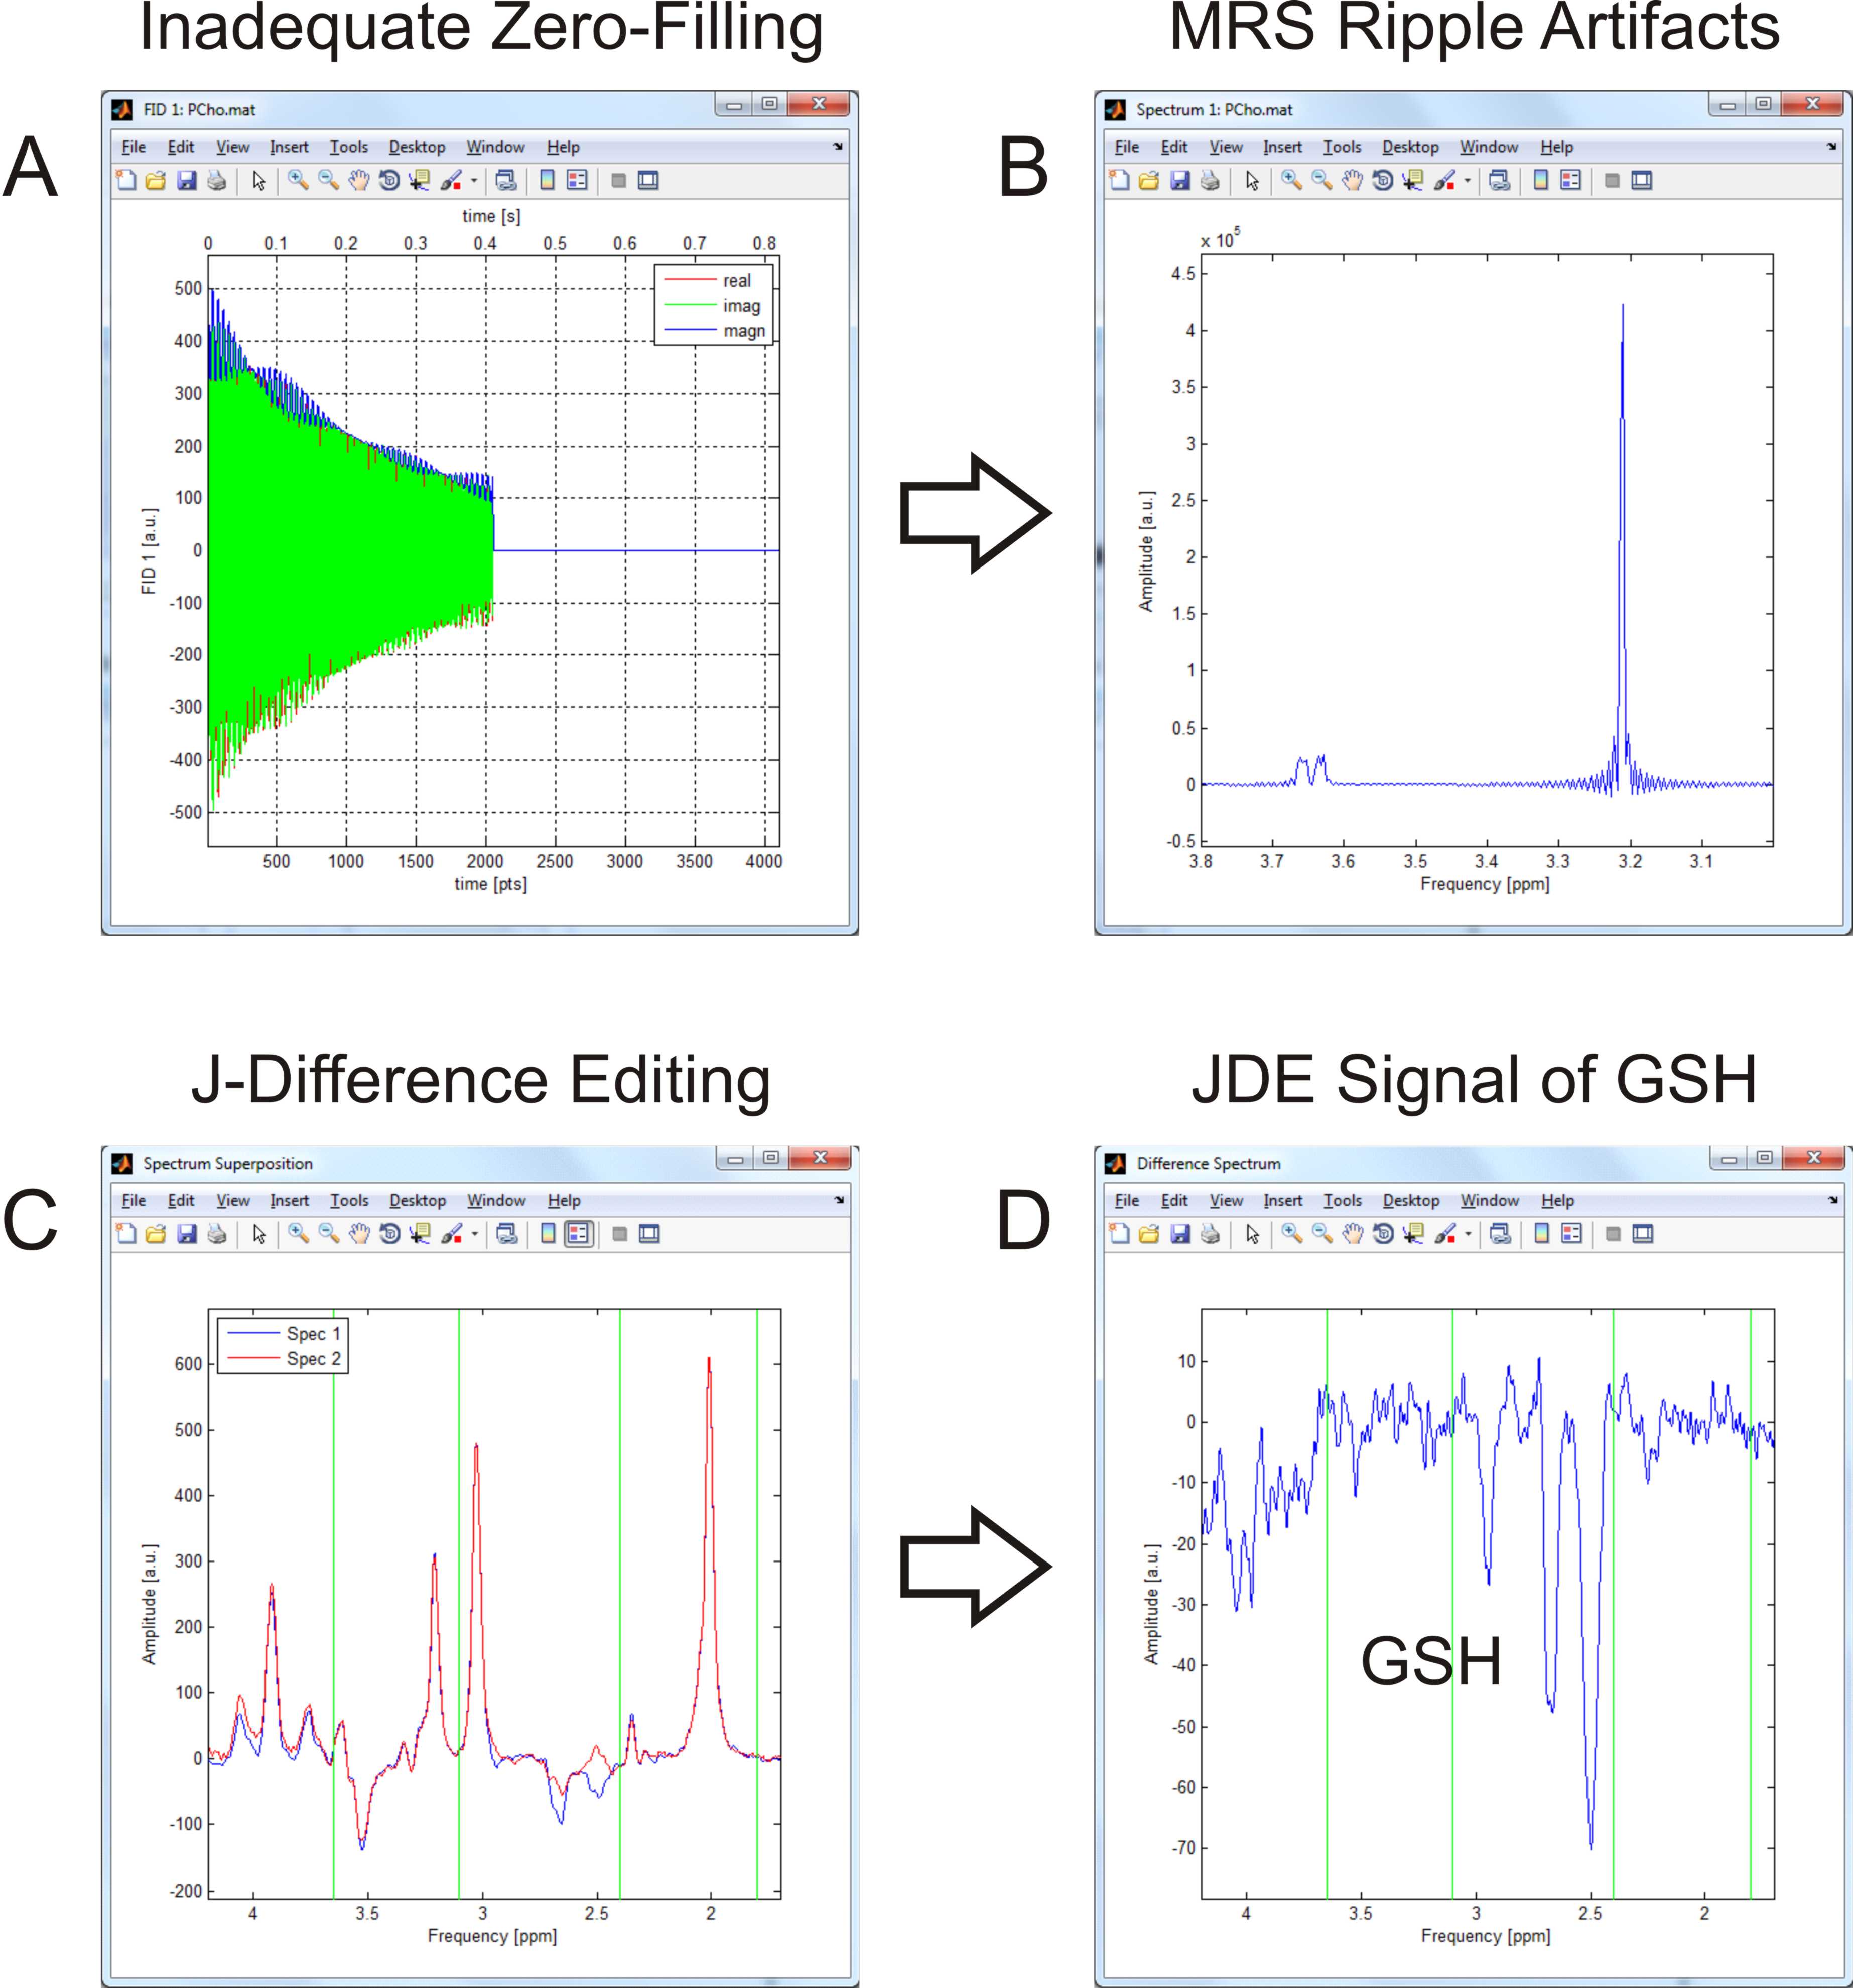
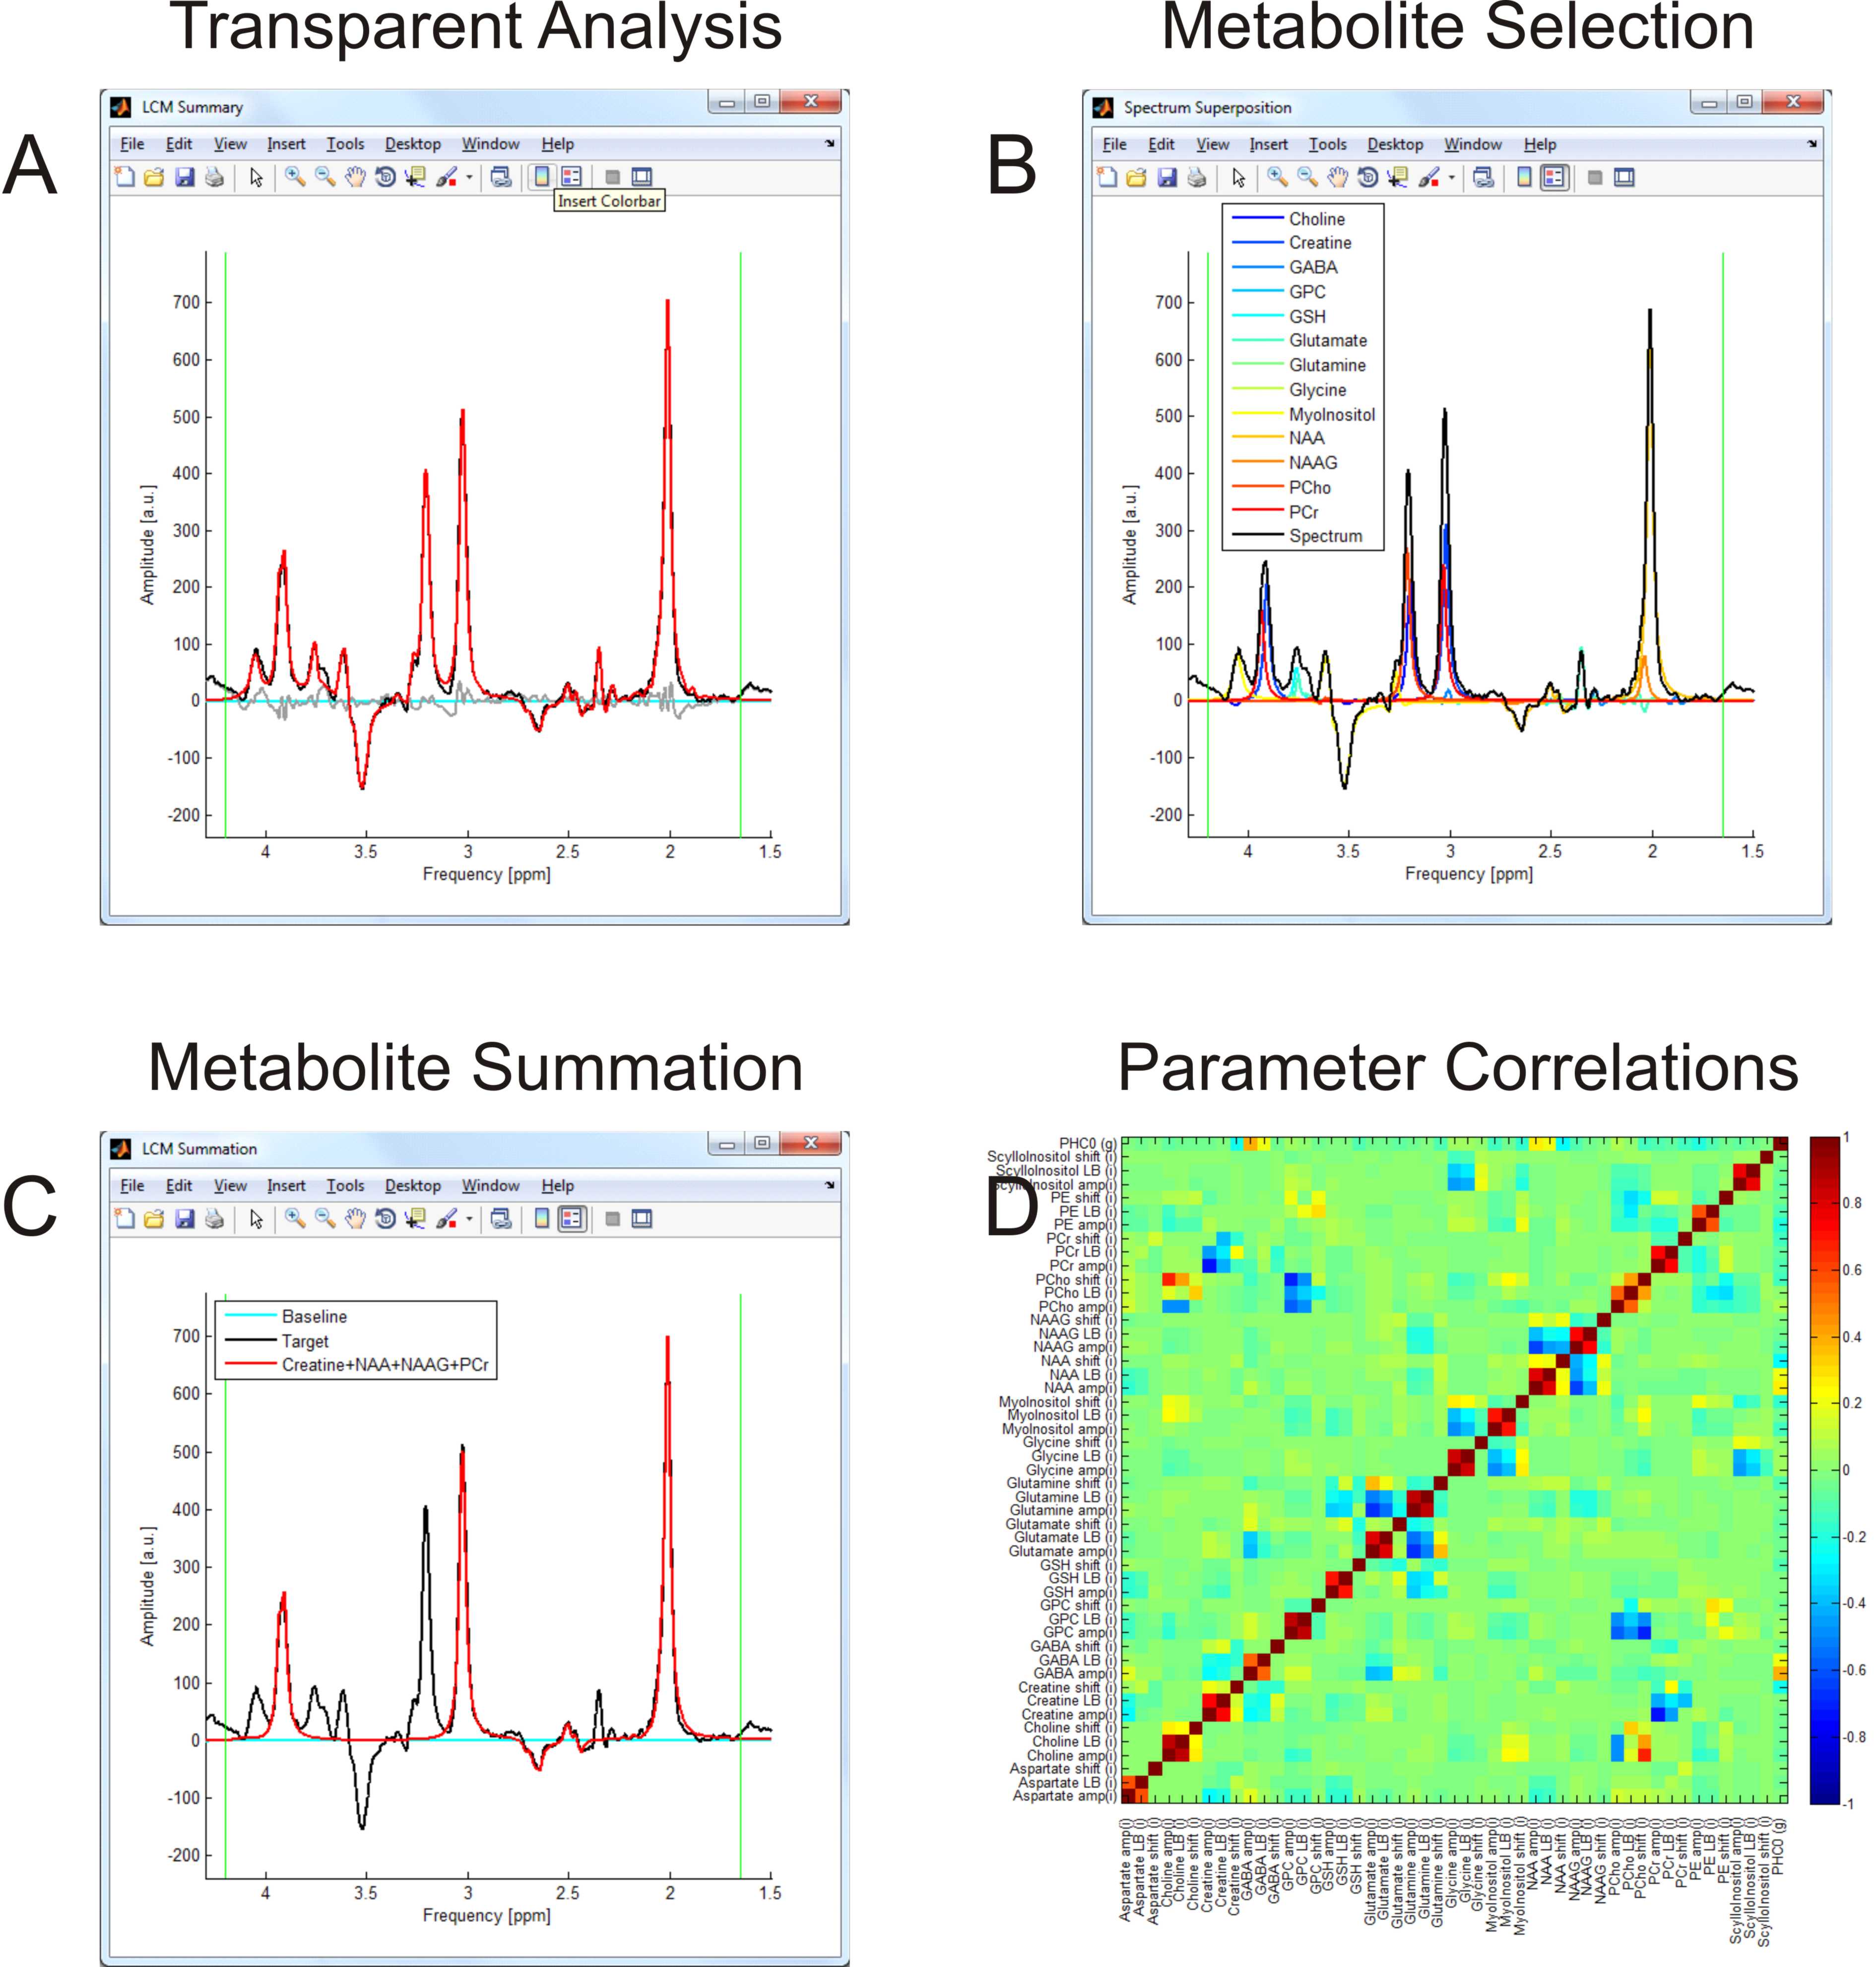
Figure 4: Spectral Quantification. LCM basis sets can be easily created and modified, and subsets flexibly selected. The employed line shape model (Lorentzian, Gaussian, or Voigt) as well as all optimization parameters and boundary conditions are user-defined, leading to a transparent LCM analysis. CRLB of all optimized parameters (not only the fitted amplitudes) are provided along with two additional error estimates (Hessian, Monte-Carlo). The quantification result (A) can be visualized as spectral superposition (B) and further processed at will (C). The correlation matrix including all fit parameters is available and allows a first-hand understanding of LCM confidence considerations (D).
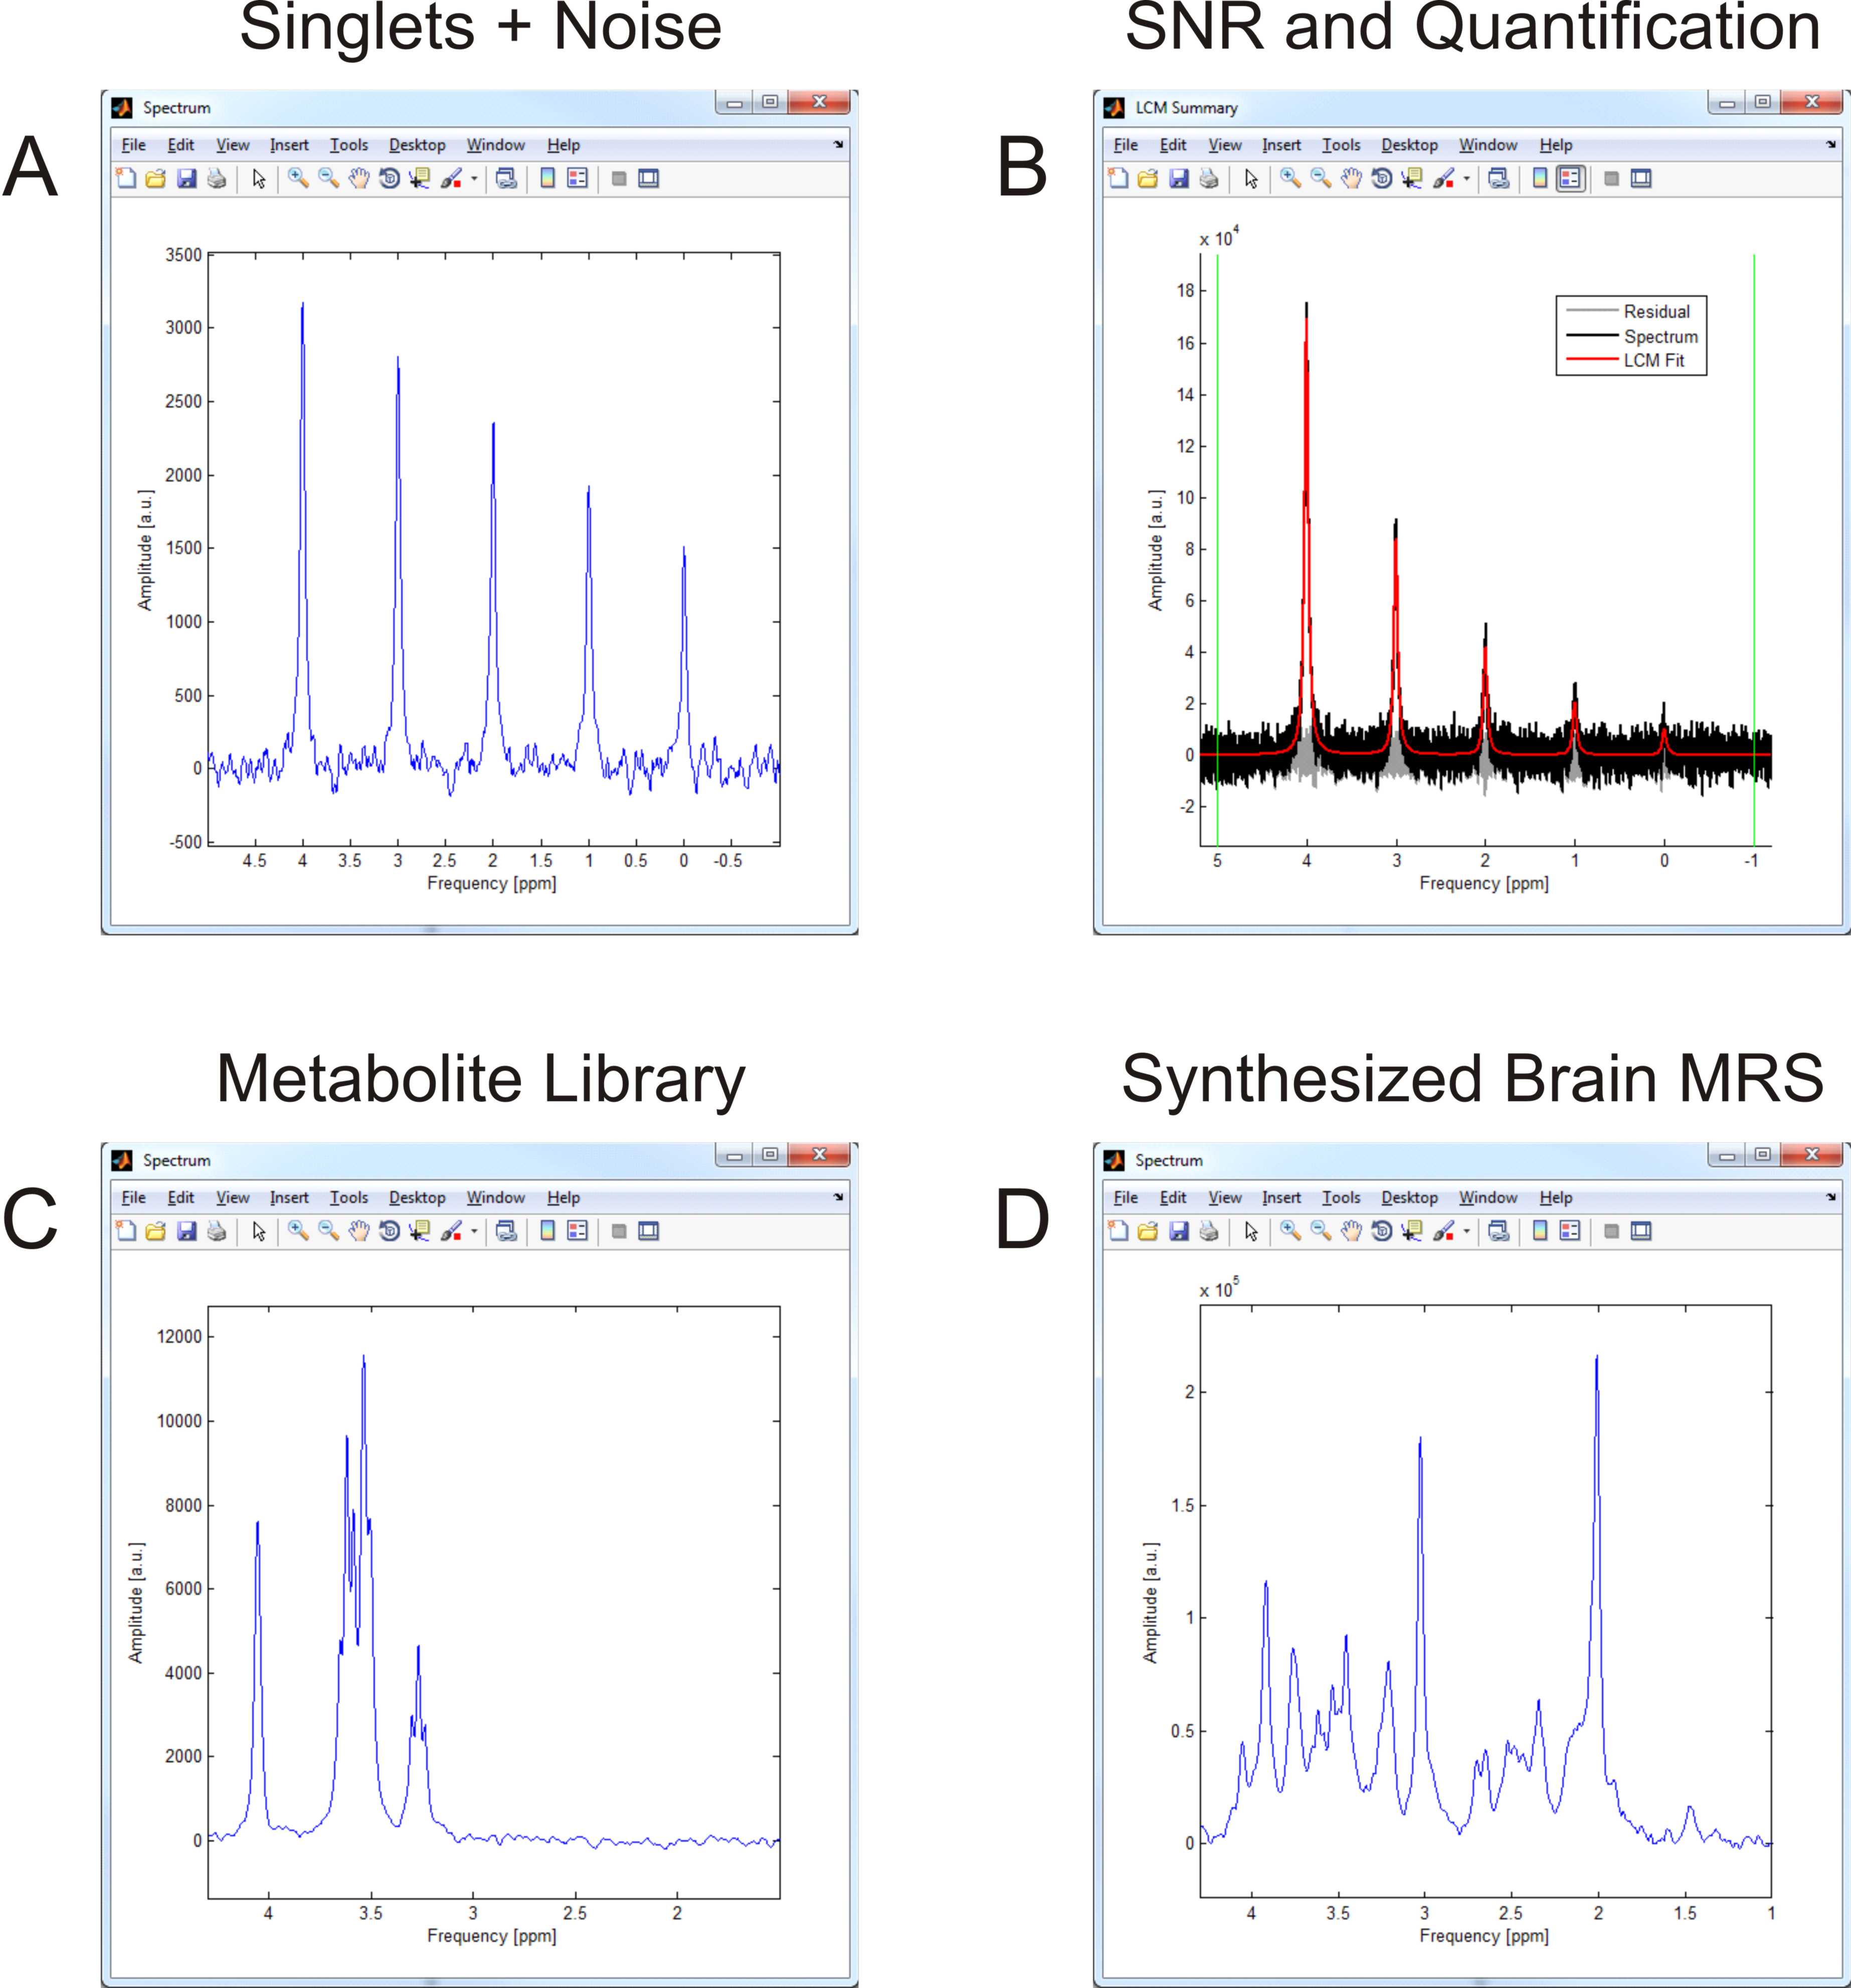
Figure 5: Spectral Simulation and Noise. A) INSPECTOR includes basic simulation capabilities, e.g. for the generation of amplitude-modulated arrays of singlet resonances. B) The potential addition of noise at well-defined power can be used
to demonstrate and discuss its impact on the spectral appearance and
MRS quantification. In addition, a library of common 1H brain metabolites (C) that can be combined to synthesize a metabolite spectrum approximating those encountered in the human brain in vivo (D) is provided.