5665
Quantitative information derived from MRS lineshapes affected by material heterogeneity - principles, applications and future potential in biomedicine1CRMBM, Aix-Marseille University, Marseille, France
Synopsis
Quantifying tissue heterogeneity is a major challenge in biomedical MRS and MRI. We present here a review of several closely related recent methods for deriving, from MRS lineshapes via histograms, quantitative statistical information on heterogeneity, and point out current and future biomedical applications. At present, heterogeneity in parameters such as ion concentrations (H+, Ca2+, Mg2+, Na+) are being targeted, but also thermal heterogeneity (relevant to hyperthermia) has been proven to be accessible to this type of spectral analysis. Future in-vivo studies are expected to benefit from the wider window into the regulation of physicochemical parameters, enabled by the new underlying paradigm.
Purpose
The shapes of MRS resonances, aka NMR lineshapes, have long been subject to detailed analysis 1. Multiple factors determine 1D MRS lineshapes from mobile molecules in homogeneous samples: molecular size and mobility, molecular structure including transient structures (e.g., for complexed molecules at intermediate exchange rates), and scalar spin-spin coupling. In materials that are heterogeneous, e.g., in biological tissue, additional factors may contribute to experimentally observed lineshapes. We focus here on physicochemical parameters, x (e.g., x = pH; or x = temperature, in particular in hyperthermia), that may vary within the observed volume, resulting in multiple microscopic regions characterized by different x values. If x has a significant effect on the chemical shift, δ, of an MRS resonance from that volume, the shape of that resonance will reflect the statistical distribution of x values present; in other words, the underlying heterogeneity is encoded in the lineshape. The purpose of this new approach is to extract from such a resonance multiple quantitative descriptors for a given x, thus providing deeper insight into tissue heterogeneity. We present here a review of several closely related recent methods for deriving quantitative statistical information from such resonance shapes via histograms, and point out current and future biomedical applications.Outline of content
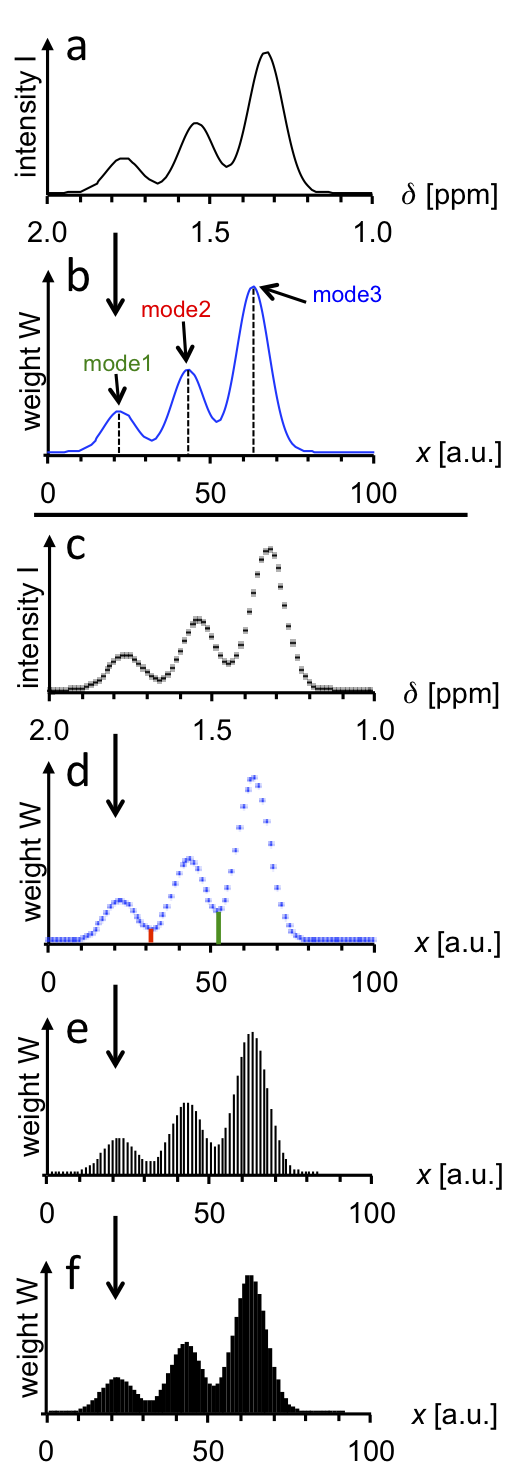
The rationale for obtaining quantitative information on the statistical distribution of parameter values from an MRS lineshape will be presented based on a numerically simulated, idealized trimodal MRS resonance (Fig. 1). The spectral line (a) is first converted into a curve representing the statistical distribution of parameter x (b). Here, a linear relationship between δ and x is assumed; nonlinear relationships would require appropriate intensity (I) adjustments. Since the MRS resonance is digitized (c), the x distribution curve also consists of digital points, xk, from k=1 to k=m (d). Each digital point can be replaced with a vertical line (e) that may serve as the center of a histogram bar. The resulting histogram (f) represents weights (W=Wk) of x values, i.e., their statistical distribution. This is the basis for the calculation of statistical descriptors, notably weighted mean and weighted median, mode(s), range, standard deviation, kurtosis, skewness, entropy, as well as relative sizes of regions characterized by particular x value ranges; the latter are separated by red and green vertical lines in (d)). MRS lineshape contributions from factors other than x (spurious effects) will be dealt with separately. Note that the in-silico model presented here (Fig. 1) is based on an arbitrary δ range from 1 to 2 ppm, covering an arbitrary range of x values from 0 to 100.
Equations for statistical descriptors of x value distributions were derived from analogous equations available for conventional histograms. For weighted mean, skewness and kurtosis, the final equations are 2:
weighted mean: $$$\overline{x}=\frac{\sum_{k=1}^{m}(x_k\times W_k)}{\sum_{k=1}^{m}W_k}$$$
skewness: $$$G1_{x}=\frac{n}{(n-1)(n-2)}\sum_{k=1}^{m}W_k(\frac{x_{k}-\overline{x}}{s})^{4}$$$
kurtosis: $$$G2_{x}=\frac{n(n+1)}{(n-1)(n-2)(n-3)}\sum_{k=1}^{m}W_k(\frac{x_{k}-\overline{x}}{s})^{4}-\frac{3(n-1)^{2}}{(n-1)(n-3)}$$$;
with $$$s=\sqrt{\frac{\sum_{k=1}^{m}W_k({x_{k}-\overline{x}})^{2}}{n-1}}$$$, and $$$n=\sum_{k=1}^{m}W_k$$$
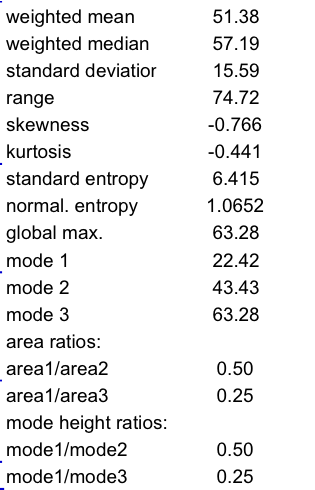
The relative flatness (by comparison to a single Gaussian) and asymmetry of the distribution shown in Fig. 1 are clearly reflected by the negative kurtosis and skewness values, respectively (Table 1). The relative heights and areas of the modes fit well with the amplitude ratios used in the design of this curve (mode1:mode2:mode3 = 1:2:4). All calculations can be performed using an EXCEL spreadsheet. Further simulations have been performed for complete validation (data not shown).
Summary
Statistical algorithms are used to extract, for heterogeneous materials, quantitative information on the distribution of values of a given parameter, by deriving statistical descriptors from an MRS lineshape sensitive to the parameter in question. This technique has been previously presented for the special cases of intra and extracellular pH 2 (31P MRS) and thermal heterogeneity 3 (1H MRS). Ongoing work is geared toward extending this approach to any parameter x that alters the chemical shift of a suitable MRS resonance in a predictable and unique manner. Additional applications relevant to in-vivo analysis in experimental animals and humans include, but are not limited to, heterogeneity of intracellular ion concentrations such as magnesium(II) (using the ATP-β peak in 31P MRS 4), calcium(II) and sodium(I) (using TF-BAPTA 5 and FCrown-1 6 fluorine peaks, respectively, in 19F MRS). The latter three MRS resonances have previously been shown to be useful in in-vivo measurements of single ion concentrations, but have not been used to characterize statistical distributions of ion concentrations. Future in-vivo studies are expected to benefit from the wider window into the regulation of physicochemical parameters enabled by this novel paradigm.Acknowledgements
Support from the Centre National de la Recherche Scientifique, UMR 7339, is greatfully achnowledged.References
1. Cheshkov DA, Sinitsyn DO, Sheberstov KF, et al. Total lineshape analysis of high-resolution NMR spectra powered by simulated annealing. J. Magn. Reson. 2016;272:10–19.
2. Lutz NW, Le Fur Y, Chiche J, et al. Quantitative in-vivo characterization of intracellular and extracellular pH profiles in heterogeneous tumors: a novel method enabling multiparametric pH analysis. Cancer Res 2013;73:4616–4628.
3. Lutz NW, Bernard M. Multiparametric quantification of thermal heterogeneity within aqueous materials by water 1H NMR spectroscopy: paradigms and algorithms. PLOS ONE 2017;12:e0178431.
4. Gupta RK, Gupta P, Yushok WD, et al. On the noninvasive measurement of intracellular free magnesium by 31P NMR spectroscopy. Physiol. Chem. Phys. Med. NMR 1983;15:265–80.
5. London RE, Rhee CK, Murphy E, et al. NMR-sensitive fluorinated and fluorescent intracellular calcium ion indicators with high dissociation constants. Am J Physiol 1994;266:C1313-22.
6. Smith GA, Kirschenlohr HL, Metcalfe BW, et al. A new 19F NMR indicator for intracellular sodium. J Chem Soc Perkin Trans 1993;2:1205–1209.
Figures