5663
Configuration Model1Department of Radiology, Klinikum rechts der Isar, Technical University of Munich, Munich, Germany
Synopsis
Extended phase graphs (EPG) accurately describe the appearance of echoes and their respective amplitudes for virtually any MR sequence. Due to the common definition of EPG states, however, there are shortcomings when it comes to quantify susceptibility effects and the relevance of echo pathways. This Educational E-Poster dicusses the origin of these limitations and how they can be resolved within the closely related microscopic configuration model (CM).
Purpose
Extended phase graphs (EPG) are indispensable for the qualitative and quantitative description of echo generation in presence of gradients. In the most common interpretation1, the associated EPG states are motivated by non-local dephasing patterns and formally defined via voxel-scale Fourier integrals. This approach, however, impedes the proper inclusion of susceptibility effects and the quantification of echo pathways in the reconstructed signal.
In this Educational E-Poster, we present the closely related (albeit lesser known) configuration model (CM), which does not suffer from these limitations. Relying on a microscopic representation of phase graphs, the Bloch(-Torrey) equations are solved and the transition to the voxel scale is postponed. We present a multi-dimensional CM variant, which applies to arbitrary sequences.
Outline of Content
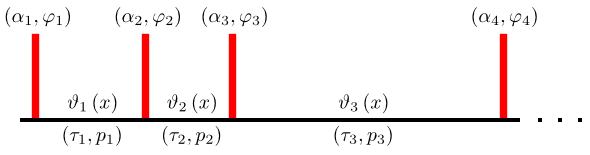
We consider an arbitrary (periodic or non-periodic) sequence of instantaneous RF pulses, separated by time intervals $$$\left(\tau_j,p_j\right)$$$ of duration $$$\tau_j$$$ and net gradient moment vector $$$p_j$$$, as shown in Figure 1. Within the configuration model, we write the magnetization vector density (immediately after any RF pulse or time interval) in the form $$m\left(x\right)\;= \;\sum_{n\in\mathbb{Z}^d}\,e^{in\vartheta\left(x\right)}\,m^{(n)}\left(x\right)$$ where $$$d$$$, the dimension of the configuration model, is equal to the number of different intervals $$$\left(\tau_j,p_j\right)$$$, appearing in the sequence. The vector element $$$\vartheta_j\left(x\right)$$$ is just the phase accumulated during interval $$$\left(\tau_j,p_j\right)$$$: $$\vartheta_j\left(x\right)\;=\;\omega\left(x\right)\tau_j\;-\;p_j\,x$$ $$$\omega\left(x\right)$$$ denotes the local off-resonance frequency.
We will show that these definitions lead to a consistent formalism, in which the Bloch(-Torrey) equations are converted into recursions for the configuration vector density $$$m^{(n)}\left(x\right)$$$. Similar to EPG, the associated transitions can be visualized via magnetization pathways. Unlike EPG, however, this applies to the local magnetization vector density $$$m\left(x\right)$$$, i.e. to individual isochromats. The final step to the voxel scale can thus be achieved by standard means (e.g. convolution with a point spread function) from which the selection rules for the contributing configuration orders (and their specific sensitivity to susceptibility effects) emerge automatically.
The configuration model is applicable to arbitrary sequences or sequence blocks, whether under idealized or realistic conditions. In order to familiarize ourselves with this concept, we will discuss a variety of topics, such as
- stimulated echoes and CPMG condition
- finite RF pulse effects for short TR
- difference between crusher and spoiler gradients
- susceptibility effects
- diffusion and collective motion
- (design of) RF pulses ($$$\pm$$$ relaxation)
- ...
A free configuration model toolkit (CoMoTk) for Matlab, along with various example applications and detailed background information, is available on https://github.com/cganter/CoMoTk (QR code in Figure 2).
Summary
Theoretical understanding and numerical simulation of MR sequences benefit considerably from a suitably chosen representation. Here, the configuration model provides a unique and rigorous link between microscopic spin dynamics and the reconstructed voxel signal.Acknowledgements
References
1. Weigel M. Extended phase graphs: Dephasing, RF pulses, and echoes - pure and simple. J. Magn. Reson. Imaging 2015;41:266–295.Figures