5662
Spectrum of Ovarian Diseases with Hypo-signal on Fat Suppressed T2WI (FS T2): Radiologic-pathologic CorrelationXU HAN1, MEI-YU SUN1, MENG-YAO WANG1, and RUI FAN1
1The First Affiliated Hospital of Dalian Medical University, Dalian, China
Synopsis
To assess the ovarian tumors with hypo-signal on fat suppressed T2WI and to summarize their MRI features, which can expand the spectrum of disease.
Purpose
To aid in the correct interpretation of FS T2-hypointense ovarian lesions and the value of distinguish ovarian disease with hypo-signal on FS T2WI.Methods
Organizing the ovarian disease of our hospital since 2007 and observing the lesions with hypointense on FS T2WI. We classify and summarize the lesions according to pathological components.Results
We review the spectrum of ovarian diseases that present with hypo-signal on FS T2WI(Figure 1-6). Blood, fibrous tissue and mix cell components are well-known factors associated with ovarian disease with low FS T2 signal. Blood component is typical for endometrial cyst and hemorrhage cyst.Fibrous tissue component can be seen with fibroma,ovarian fibrothecoma and adenofibroma whereas mix cell component is common in Brenner tumor,teratoma and ovarian metastases.Endometriotic cysts (chocolate cysts) in a 35-year-old woman presents with ill defined cystic mass in bilateral adnexal regions with marked right hydrosalpinx (Figure 1).On FS T2WI(a), the bilateral endometriotic cysts demonstrate hypo-signal intensity relative to myometrium. Furthermore, the left one (∆∆) shows even lower intensity than the right one(↑). It suggests that the cysts are consist of bleeding in different periods(f). The cysts show high signal intensity on both T1WI(b) and FS T1WI(c). Low signal intensity can be seen on DWI(d).Non-enhancement can be seen on contrast-enhanced FS T1WI(e). Hemorrhagic corpus luteal cyst in a 45-year-old woman (Figure 1).A well-circumscribed solitary cyst(↑↑) in right ovary with heterogeneous signals.FS T2 shows hypo-signal(g).On T1WI(h) and FS T1WI(i),it is slightly hyper-signal relative to myometrium. DWI demonstrates restricted diffusion(j).Contrast-enhanced FS T1WI shows perpheral wall enhancement in the hemorrhagic cyst(k). Photomicrograph demonstrates blood component in corpus luteum(l).Fibroma in a 52-year-old woman(Figure 2).FS T2WI shows a mass(↑) with predominantly hypo-signal intensity(a). T1WI demonstrates the mass with intermediate signal intensity similar to that of muscle(b). It is a finding that is characteristic of an ovarian fibroma. Contrast-enhanced FS T1WI shows mild enhancement (c). Histopathological examinations reveal an ovarian hyalinized fibroma(d). Fibrothecoma in a 58-year-old woman(Figure 2).FS T2WI shows a predominantly low signal intensity solid mass(↑↑) with partially cystoid(*) in right adnexal region(e) and the mass demonstrates low signal as well as on TIWI(f). FS T1WI shows hyperintense which representing without fat component(g). Mild-to-moderate enhancement is seen in solid component on contrast-enhanced FS T1WI, yet the cystic part is not(h).The uterus is enlarged, an abnormal finding in postmenopausal women with fibrothecoma.Fibrothecomas and fibromas display a relatively specific appearance on MR images. Fibrothecomas not only composed of fibrous component but theca folliculin component(i). Cystic degeneration will be more common in fibrothecoma than fibroma. Serous adenofibroma in a 66-year-old postmenopausal woman(Figure 3). FS T2WI demonstrates a hypo-signal mass with nodule(*).(a).On T1WI, the mas(arrows)is heterogeneously hypointense(b).The area which shows slightly low signal on both T1WI and FS T2WI representing fibrous tissue.This area is not enhanced on contrast-enhanced FS T1WI whereas the nodule shows moderately enhancement(c). Photomicrograph demonstrates shows adenous duct dilation and fiber induration(d).Fibromas and adenofibromas are not related. Fibromas have no epithelial component while adenofibroma is believed to be of epithelial and stromal origin.Mature teratoma in a 39-year-old woman(Figure 4).T1WI demonstrates a high-signal-intensity cystic mass in the right ovary(arrows)with low signal attached mural nodule(c). FS T2WI(a,b) and FS T1WI(d) demonstrates the mass with markedly decreased signal intensity compared with the T1WI(*), which is the characteristics of the fat component.The mural nodule shows hypointensity on T1WI(c) and FS T1WI(d) whereas FS T2WI(a) shows hyperintensity.Cyst wall enhancement on contrast-enhanced FS T1WI.Microscopically, the mass composes of lipid, sudoriferous glands and vessels(f) .Bilateral metastatic adenocarcinoma from rectal carcinoma in a 67-year-old woman(Figure 5).An important diagnostic criteria is a history of primary tumor.FS T2WI shows bilateral heterogeneous signal solid masses(arrow) with multiple patchy hypointense areas and cystic component(a).It is slightly hyperintense on T1WI(b).FS T1WI shows punctiform marked hypointense(c)that is proved calcifications in histology (f).DWI demonstrates restricted diffusion(d). The solid components of masses show moderate enhancement on enhanced FS T1WI(e). The right mass is larger than the left one.Discussion and Conclusions
Realize the spectrum of ovarian diseases with low signal on FS T2WI and identify the components have significant impact on timely and accurate radiological diagnosis and differentiate this condition from its mimickers. It is also contribute to preoperative histologic prediction and clinical treatment.Acknowledgements
No acknowledgement found.References
No reference found.Figures
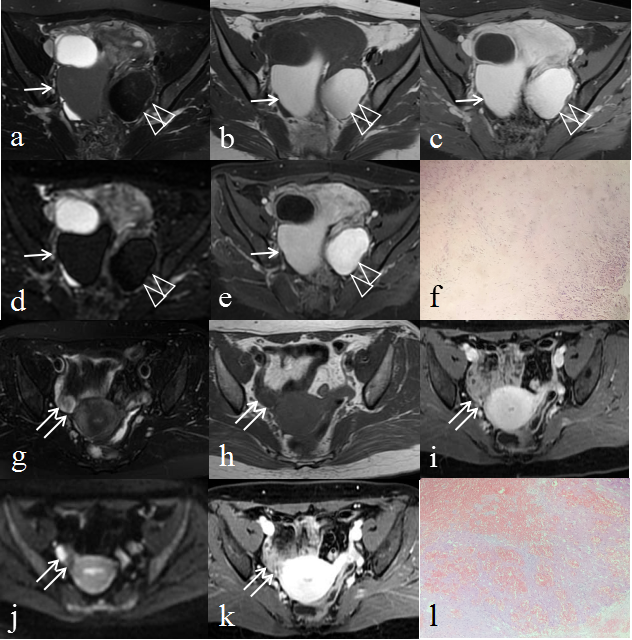
Figure 1. Endometriotic cysts (chocolate cysts) in a 35-year-old woman.(a)Axial FS T2WI. (b)Axial T1WI. (c)Axial FS T1WI. (d)Stir DWI. (e)Axial Contrast-enhanced FS T1WI. (f)Histology(H&E stain 100×). Hemorrhagic corpus luteal cyst in a 45-year-old woman.(g)Axial FS T2WI. (h)Axial T1WI. (i)Axial FS T1WI. (j)DWI(b=600). (k)Axial Contrast-enhanced FS T1WI. (l)Histology(H&E stain 100×).
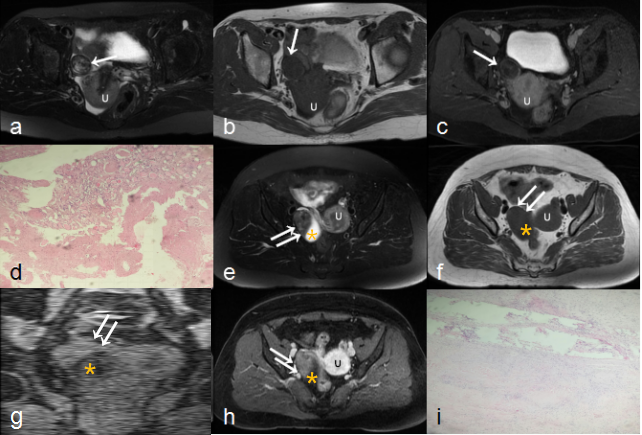
Figure 2. Fibroma in a 52-year-old woman.(a)Axial FS T2WI. (b)Axial T1WI. (c)Axial Contrast-enhanced FS T1WI. (d)Histology(H&E stain 100×). Fibrothecoma in a 58-year-old woman.(e)Axial FS T2WI. (f)Axial T1WI. (g)Coronal FS T1WI. (h)Axial Contrast-enhanced FS T1WI. (i)Histology(H&E stain 100×). U=uterus
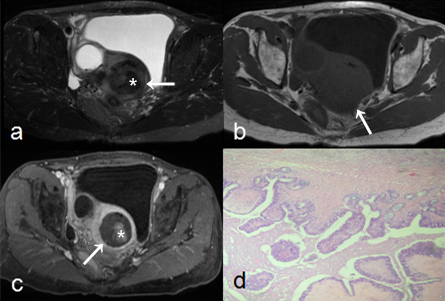
Figure 3. Serous adenofibroma in a 66-year-old postmenopausal woman. (a)Axial FS T2WI. (b)Axial T1WI. (c)Axial Contrast-enhanced FS T1WI. (d)Histology(H&E stain 100×).
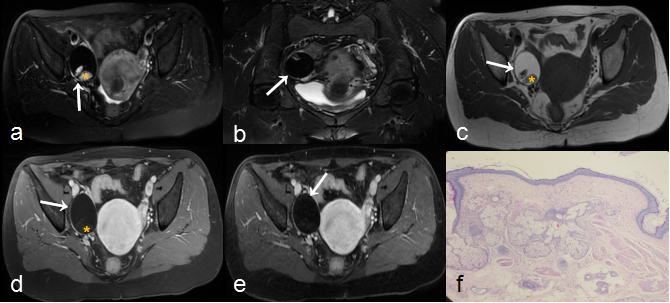
Figure 4. Mature teratoma in a 39-year-old woman.(a)Axial FS T2WI. (b)Coronal FS T2WI. (c)Axial T1WI. (d)Axial FS T1WI. (e)Axial Contrast-enhanced FS T1WI. (f)Histology(H&E stain 100×).
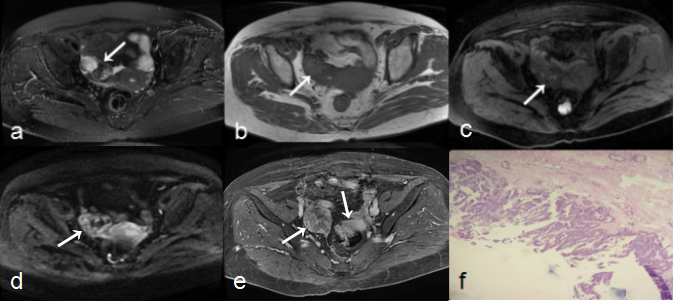
Figure 5. Bilateral metastatic adenocarcinoma from rectal carcinoma in a 67-year-old woman.(a)Axial FS T2WI. (b)Axial T1WI. (c)Axial FS T1WI. (d)DWI(b=600). (e)Axial Contrast-enhanced FS T1WI. (f)Histology(H&E stain 100×).