5655
Calibration strategies for quantitative 2D EPI pCASL analysis1Diagnostic Physics, Oslo University Hospital, Oslo, Norway, 2Institute of Physics, Unversity of Oslo, Oslo, Norway
Synopsis
This study evaluates different methods of calibrating pseudo-continuous ASL images for quantification of cerebral blood flow in the brain; homogeneity correction strategies and the dual inversion recovery background suppression efficacy of 2D-EPI pCASL were examined.
Purpose
This study evaluates different methods of calibrating pseudo-continuous ASL (pCASL) images for quantification of cerebral blood flow (CBF) in the brain; homogeneity correction strategies and the dual inversion recovery (IR) background suppression (BS) efficacy of 2D-EPI pCASL were studied.Methods
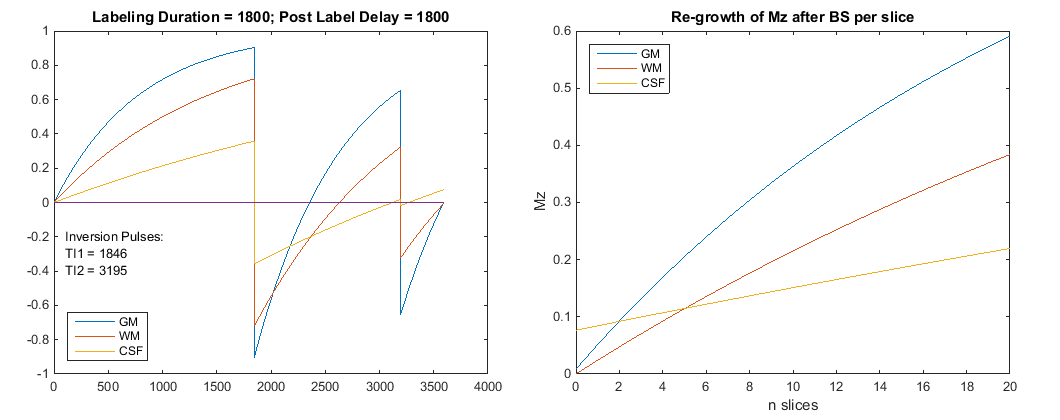
Healthy volunteers were scanned in a 8-channel head coil on a 3T Philips Achieva MR scanner using high-resolution 3D-T1 and pCASL (LD=PLD=1800 ms [1]) series with/without dual IR (TI1/TI2 = 1846ms / 3195ms) based BS; 2D GRE-EPI readout (TR/TE/FA = 4.4s / 12ms / 90°); 20 oblique-axial 5.5 mm slices (0.5 mm gap); 40 NSA.
Coil sensitivity (CS)-maps were calculated by dividing 3D GRE images separately acquired with head coil by ones acquired with body coil [2]. One pair of pCASL series with BS were homogeneity corrected with the CS-map for comparison with the use of the vendor’s own algorithm (CLEAR). For ASL quantification separate M0 series (5 avg.) with long TR were acquired. CBF maps were calculated from different combinations of BS and inhomogeneity correction using FSL (v5.0.4) functions including MCFLIRT [3], oxford_asl and asl_calib [4]. Background suppression by the use of two IR-pulses for the given ASL preparation scheme was simulated in Matlab.
Comparison of pCASL signal amplitude using different correction regimes was compared in terms of a paired t-test between label and control image pairs across all dynamic scans. Binary pixel-by-pixel significance maps were then generated identifying all pixels with significant intensity difference between label and control images based on a one sided (control>label) t-test with a cutoff p=0.05, Bonferroni corrected. Statistical maps were generated in the nordicICE software package [5].
Results
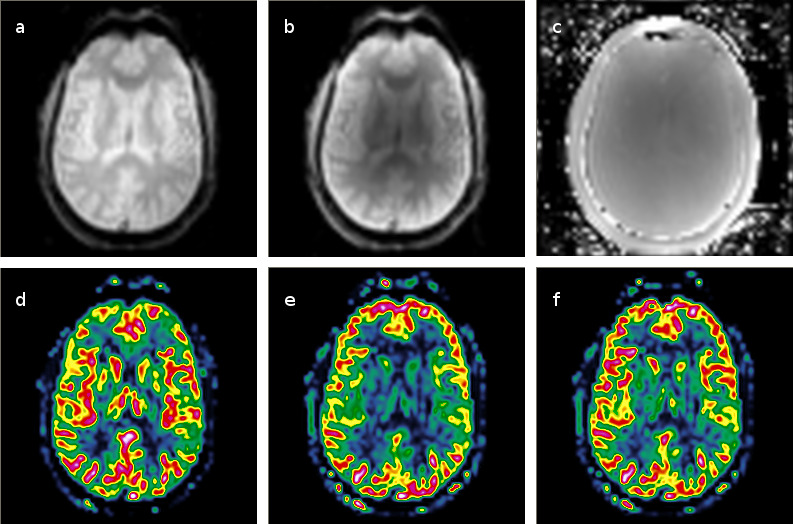
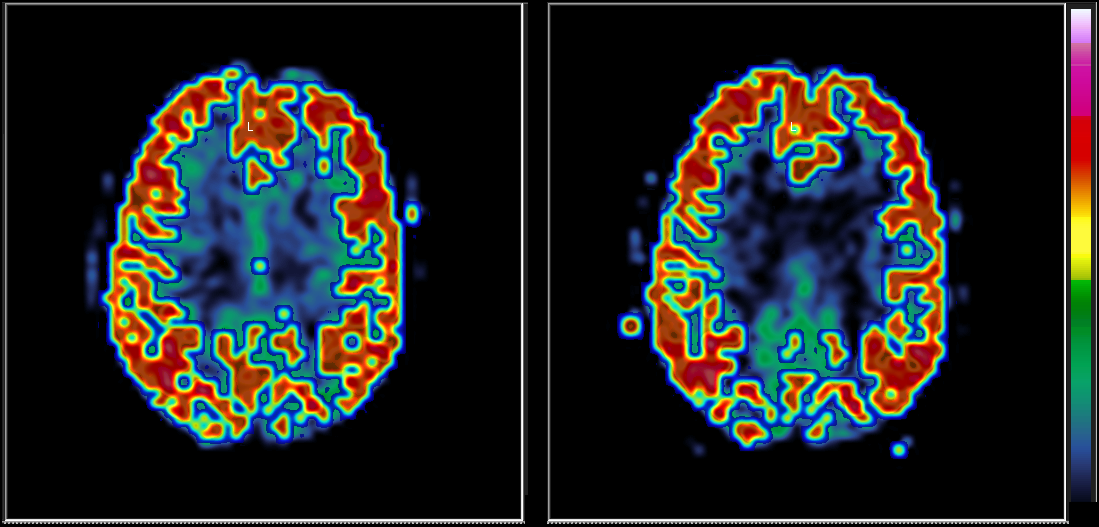
As seen in Figure 1, CLEAR gives superior ASL quality compared to the calculated coil sensitivity map particularly in the center of the head, whereas the lack of using a sensitivity map seem to underestimate deeper brain tissue perfusion. Temporal variance analysis supported this, although the relative efficacy over the brain varied, and the cortical voxels which stood for most of the statistically significant ASL signal were largely unaffected by the choice of sensitivity correction method (Figure 2).
In a simulation of our 2D ASL with BS optimized for the first image slice (Figure 3), full suppression only applied to the first slices, deteriorating with slice to 58/38/14 % of M0 for WM/GM/CSF, respectively.
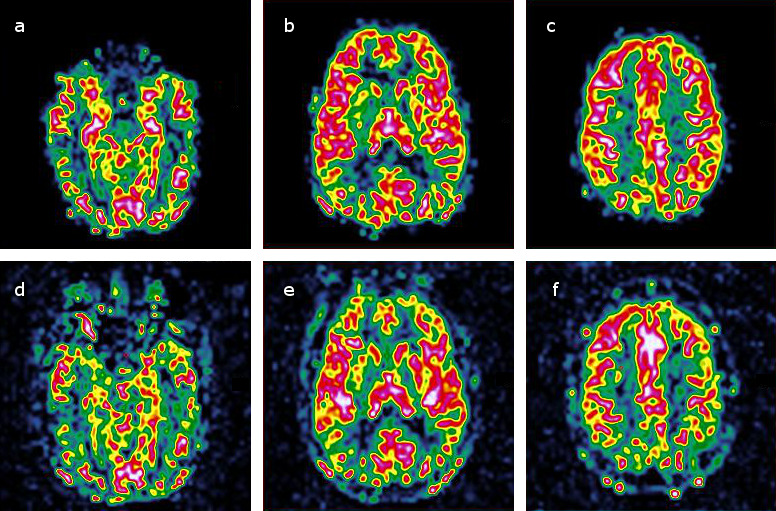
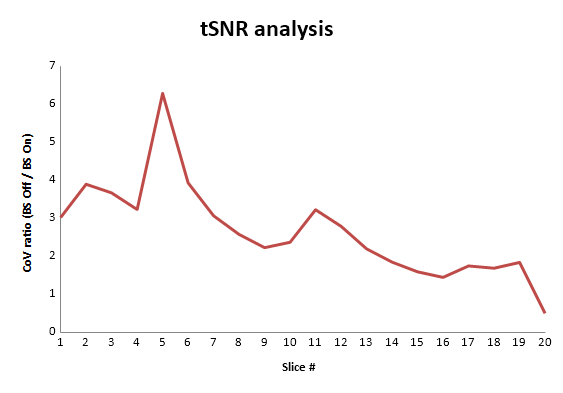
Without BS, CBF images have more background noise, but the CBF maps have comparable quality and perfusion values (Figure 4). In figure 5 is shown how the temporal Coefficient of Variance as a measure of time series noise is higher without BS but drops off with higher slice positions as BS deteriorates over the EPI acquisition time.
Discussion/Conclusion
The vendor’s coil sensitivity correction method is important to apply when multi-channel coils (>8 elements) are used, but a separately acquired CS-map according to Wu et al [2] can also be used, as long as perfusion in the deeper brain tissue isn’t studied. Calibration scan based homogeneity correction should be applied in ASL but internal calibration may be used if BS is not employed. Pixelwise calibration with comparable M0 or ASL control images (without BS) may additionally reduce image artefacts.
CBF maps and values appeared comparable with and without BS, although BS did have a positive effect particularly on image slices proximally to the labelling plane.
Acknowledgements
We thank Henk-Jan Mutsaerts for collaboration with the ASL analysis.References
- Alsop et al, MRM 2014
- Wu et al, Neuroimage 2011
- Chappell et al, IEEE 2009
- Di Cataldo et al, IEEE 2011
- NordicNeuroLabs, Bergen, Norway
Figures