5654
Serial Quantitative Brain T1 Hyper-intensity Changes in Pediatric Patients Before and After Switching from Linear to Macrocyclic MRI Contrast Agents.1Radiology, Phoenix Children's Hospital, Phoenix, AZ, United States
Synopsis
The purpose of this study is to investigate the effect of switching from a linear to a macrocyclic GBCA on T1 signal enhancement in unenhanced T1-weighted brain images of pediatric patients. As in previous studies, significant signal intensity differences were observed in patients in the dentate nucleus and globus pallidus following serial administrations of a linear GBCA. In this study, a significant reduction in these signal intensities was also observed in these patients following several subsequent doses of a macrocyclic GBCA.
Purpose
This study quantified serial changes in brain T1 hyperintensities in a cohort of pediatric patients who received multiple doses of a single macrocyclic GBCA following a period of previously receiving multiple doses of a single linear GBCA.Introduction
The deposition of gadolinium in the brain from multiple gadolinium based contrast-enhanced MRI examinations has been reported in several recent studies [1-4], demonstrating a significant increase in signal intensity in the dentate nucleus (DN) and globus pallidus (GP) in unenhanced T1 weighted MRI acquisitions. These findings were supported by mass spectroscopy studies showing increased gadolinium concentration in the DN and GP postmortem for patients who received multiple doses of gadolinium based contrast agents (GBCA) [4]. Radbruch et al. compared DN and GP T1 signal enhancement between patients who underwent multiple linear GBCA MRI examinations with those who underwent multiple macrocyclic GBCA MRI examinations [3]. The current study investigates T1 signal enhancement in the DN and GP for pediatric patients who have received multiple MRI examinations using both linear and macrocyclic GBCA.Methods
This internal review board approved retrospective pilot study involving 8 patients, each of whom received multiple MRI examinations (range: 5-41 exams) with a linear contrast agent followed by multiple examinations (range: 3-9 exams) with a macrocyclic contrast agent over the course of their medical treatment (duration from first to most recent exam: 1.1-13.2 years). The patients were between 0.9 and 14.4 years of age at the time of their first linear GBCA exam. Regions of interest were drawn in the dentate nucleus and the globus pallidus on unenhanced T1 weighted images acquired at 1.5T and 3.0T. The signal intensities of these two structures were normalized by that of the corpus callosum genu. Signal intensity ratios from these patients were measured at first linear exam, last linear exam, first macrocyclic and last macrocyclic exam. These results were compared to patients who exclusively received macrocyclic GBCA of similar dosages.Results and discussion
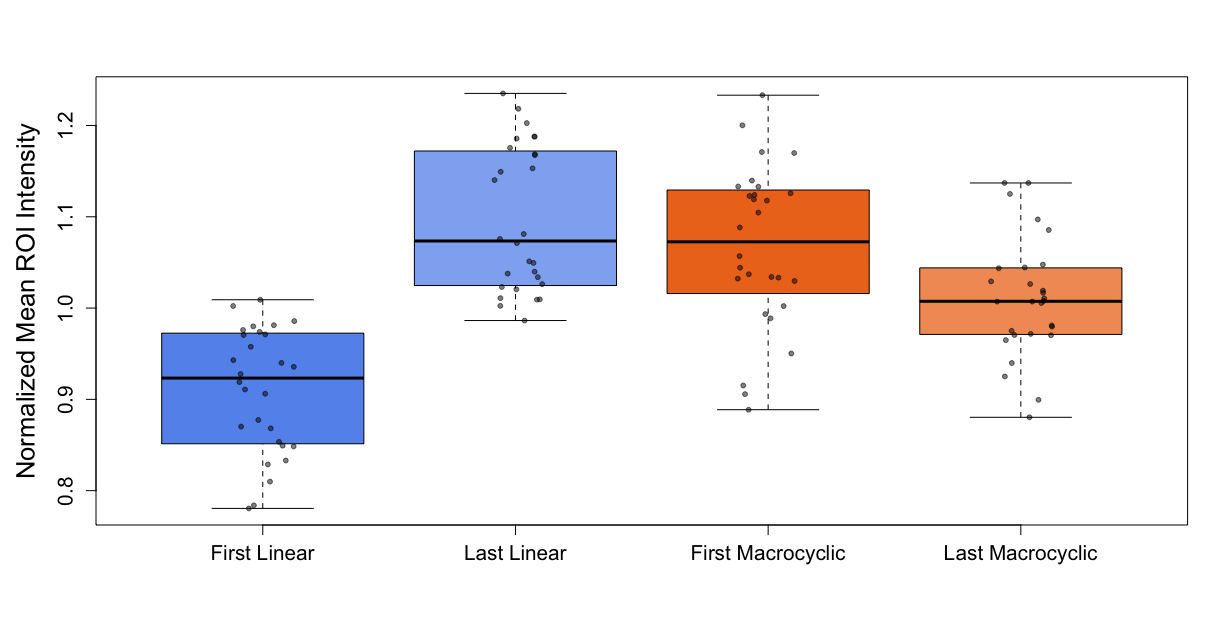
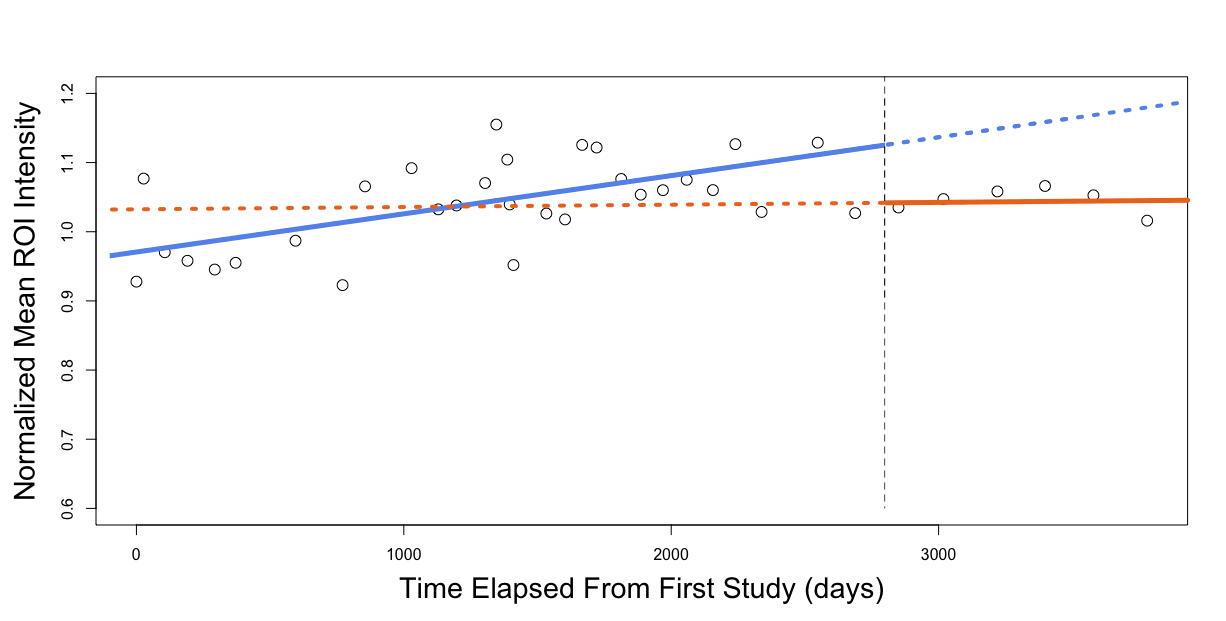
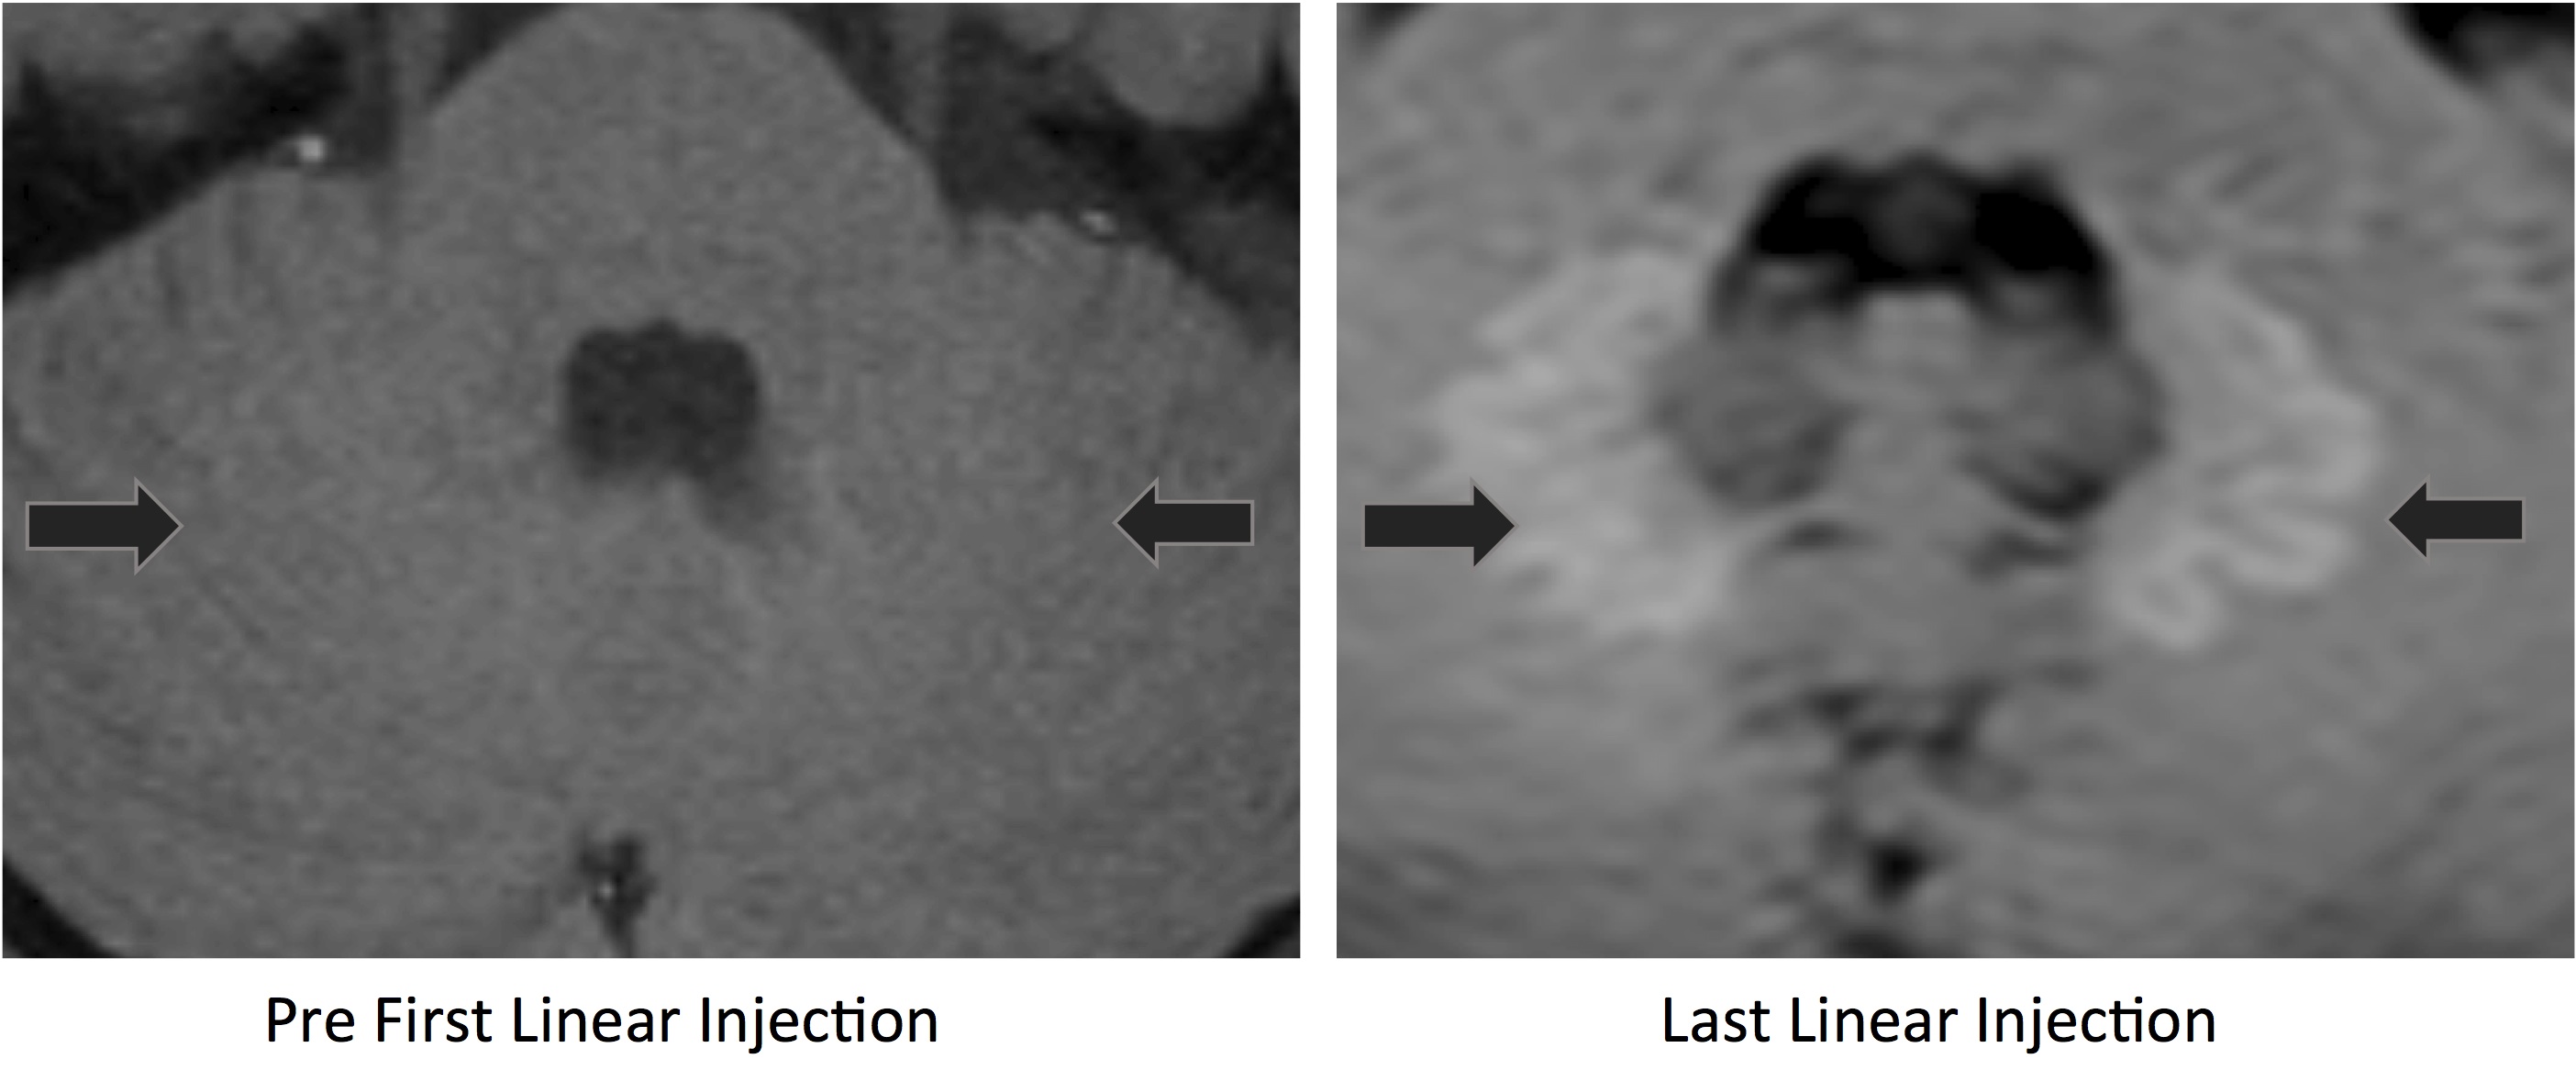
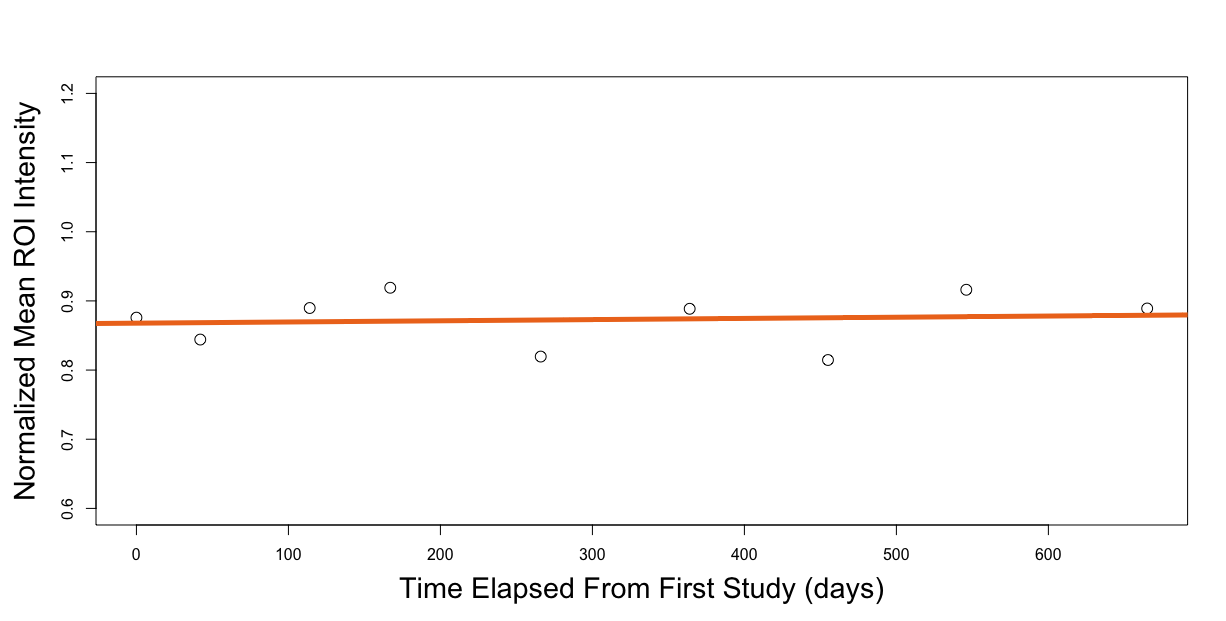
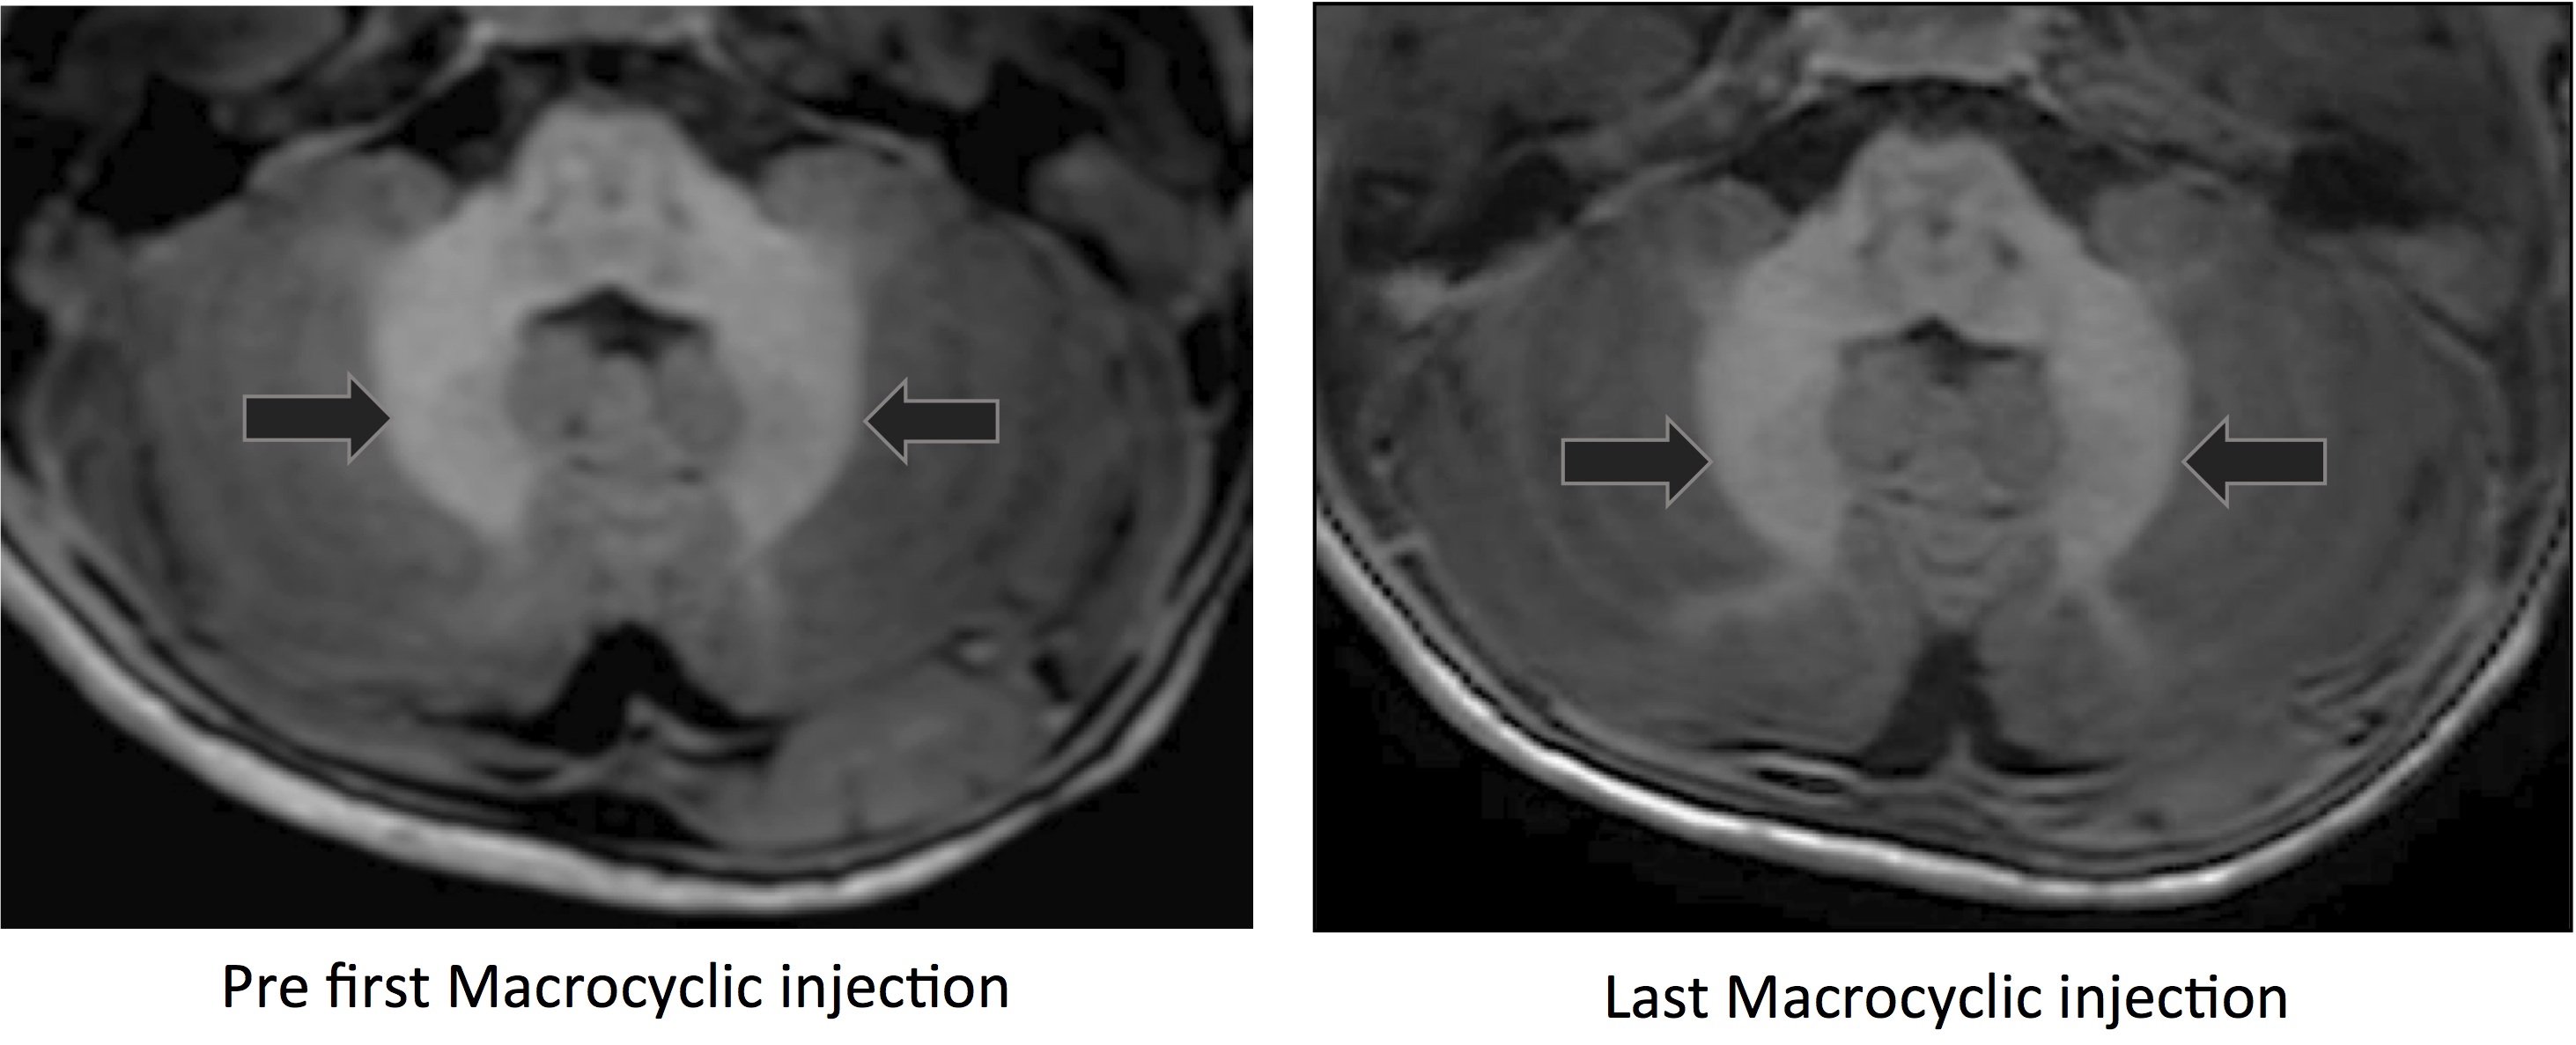
Signal intensity ratios increased between the first and last Linear GBCA MRI exam (P<0.0001) with minimal change between last Linear and the first Macrocyclic GBCA MRI exam (P=0.08). There was also a change between first Macrocyclic and last Macrocyclic MRI exam (P<0.001) in all patients receiving GBCA as shown in figure 1. The degree of signal intensity enhancement did correlate with statistical significance to the cumulative number or volume of GBCA administrations between first Linear and last Macrocyclic GBCA MRI exam each patient received. Figure 2 shows the mean normalized signal intensity measured in ROIs from the left and right DN and GP in a patient who received a total of 35 linear GBCA injections and 6 macrocyclic GBCA injections. Example images for the first and last linear contrast injections are shown in figure 3. Figure 4 shows the mean normalized signal intensity measured in ROIs from the left and right DN and GP in a patient who received 9 macrocyclic GBCA injections. Example images for the first and last macrocyclic contrast injection are shown in figure 5.Conclusion
This pilot study extends prior studies at our institution investigating the T1 hyperintense brain signal changes occurring in pediatric patients receiving multiple doses of GBCAs during the course of their treatment and surveillance MR imaging. In a cohort of patients who initially received multiple serial doses of a single linear GBCA, as expected from prior study and from similar studies in adults and children, the brain T1 signal intensity ratios of the globus pallidus and dentate nucleus increased. This study is the first known of its kind however to then follow the same cohort of pediatric subjects as they then switched to receiving a single macrocyclic agent for subsequent multiple additional doses of GBCA. The brain T1 signal intensity ratios of the globus pallidus and dentate nucleus measured during the time period of macrocyclic GBCA administration then was observed to decrease. The cause of these signal intensity changes is believed to the result of tissue concentration changes of retained intracranial GBCA. This is an active area of debate and investigation and this pilot study adds more information regarding the dynamic processes that may be occurring when macrocyclic GBCAs replace linear GBCAs in patients receiving multiple serial contrast enhanced MRI examinations.Acknowledgements
References
[1] http://www.ismrm.org/mr-safety-links/gadolinium-retention-updates-and-resources/
[2] Hu, H.H., Pokorney, A., Towbin, R.B. et al. Increased signal intensities in the dentate nucleus and globus pallidus on unenhanced T1-weighted images: evidence in children undergoing multiple gadolinium MRI exams. Pediatr Radiol (2016) 46: 1590. https://doi.org/10.1007/s00247-016-3646-3
[3] Radbruch A, et al. Gadolinium retention in the Dentate nucleus and globus Pallidus is Dependent on the class of contrast agent. RSNA Radiology. (2015)
[4] Kanda T, et al. Gadolinium-based Contrast Agent Accumulates in the Brain even in Subjects without Severe Renal Dysfunction: Evaluation of Autopsy Brain Specimens with Inductively Coupled Plasma Mass Spectroscopy. RSNA Radiology. (2015)
Figures