5647
Linear B1-Dependent Correction of Quantitative in vivo T2 Maps Acquired with Fast Spin Echo Techniques1Brain Imaging Center (BIC), Goethe University, Frankfurt/Main, Germany, 2Department of Neuroradiology, Goethe University, Frankfurt/Main, Germany
Synopsis
A method is proposed for correcting the effects of stimulated echoes in T2 mapping based on fast spin echo sequences. In contrast to existing techniques, the proposed method does not require a priori knowledge of the radio frequency pulse profiles. A linear relationship between uncorrected apparent T2 (T2app) and corrected T2 values with B1-dependent regression parameters was found which facilitates the conversion of T2app into T2 maps. In vivo results show that corrected T2 values correspond closely to reference values and have an improved consistency across protocols.
Introduction
Quantitative mapping of the transverse relaxation time T2 is usually based on fast spin echo (SE) techniques such as turbo SE (TSE) or multi-echo SE (MESE). Imperfect radio frequency (RF) pulse profiles and inhomogeneities of the transmitted RF field (B1) cause deviations of the excitation and refocusing angles from the ideal values of FAex=90° and FAref=180°. This yields stimulated and secondary echoes during the echo train which distort the acquired signal decay curve Sacq(TE), thus leading to erroneous apparent T2 (T2app) values upon mono-exponential fitting. As a result, apparent T2 values are study dependent, showing a broad range across studies from 77 to 100ms and 85 to 132ms for white and grey matter, respectively1,2. Furthermore, peak positions in T2 histograms have been shown to be vendor dependent3, ranging from 97 to 120ms. Here, a correction technique is described which is based on signal simulations, similar to existing methods4,5, but does not require a priori knowledge of the RF pulse profiles.Methods
Correction Method: The correction comprises two steps, employing numerical simulation of signal decay curves Ssim(TE) in fast SE sequences:
$$$ S_{sim}(TE=n\cdot ES)=S("RF",FA_{ex},FA_{ref},ES,n,B1,T1,T2) $$$ [Eq. 1]
Here, "RF" comprises all RF pulse profiles, ES is the echo spacing and n is the echo number.
Step 1: Determination of pulse profiles
For each protocol, Sacq(TE) is measured on a gel phantom with known T1 and T2 in regions where B1 is approximately 1.0. Subsequently, decay curves Ssim(TE) are simulated for the phantom T1 and T2 and B1=1, using different combinations of excitation and refocusing pulse profiles. The Ssim(TE) best matching Sacq(TE) is identified, yielding the approximate pulse profiles.
Step 2: Finding the relationship between T2app and T2
Using these pulse profiles, Ssim(TE) is simulated for different T2 and B1 values and T2app is determined via mono-exponential fitting. For each B1, a linear relationship is fitted:
$$$ T2(T2app) = K1(B1)+K2(B1)\cdot T2app $$$ [Eq. 2]
K1(B1) and K2(B1) are then fitted according to:
$$$ K1(B1)=P1(1)\cdot (B1-1)^{2}+P1(2)\cdot (B1-1)+P1(3) $$$ [Eq.3a]
$$$ K2(B1)=P2(1)\cdot (B1-1)^{2}+P2(2)\cdot (B1-1)+P2(3) $$$ [Eq. 3b]
MR protocols: Experiments were performed on a 3T whole body scanner, equipped with a body TX-coil and an 8-channel phased-array head RX-coil. Unless stated otherwise, for all protocols, the geometrical parameters were: FOV=256x176mm2, resolution=1x1mm2, 9 axial slices (thickness/gap: 2.5mm/2.5mm).
T2-Mapping:
"TSE17" protocol: ES=17.1ms, TE=[17,86,103,120,188]ms, duration: 5:50min.
"MESE35" protocol: ES=35ms, TE=[35,70,105,140,175,210]ms, duration: 5:56min.
T2-Reference: SE-EPI, resolution=2x2mm2, 11 slices (thickness/gap: 2mm/2mm), TE=[50,90,120]ms, 2 averages, duration: 5:20min.
B1-Mapping: As described previously6, resolution=4x4mm2, 45 slices (5mm, no gap), duration: 47s.
Phantom Experiment: The phantom was a glass sphere filled with agarose gel doped with 0.11mmol/L Gd-DTPA. For both TSE17 and MESE35, approximate pulse profiles were derived as described above. The relationship between T2app and T2 was fitted according to Eq.[2] for T2 values between 40 and 100ms and B1 values between 0.8 and 1.2, and the parameter arrays P1 and P2 were determined according to Eq.[3].
In Vivo Experiment: Measurements were performed on six healthy subjects who gave written informed consent before participation. For each subject, T2 measurements via TSE17 and MESE35, T2 reference measurement and B1 mapping were performed. T2app maps were fitted and converted into corrected T2 maps via Eqs.[2,3], using the parameters obtained from the phantom experiment.
Results
Phantom Experiment: For P1 and P2, the following values were found:
TSE17: P1=[45.8, 1.91, 2.48]ms; P2=[-2.41, -0.344, 0.730]
MESE35: P1=[-57.8, -4.85, -4.84]ms; P2=[-1.73, -0.183, 0.903]
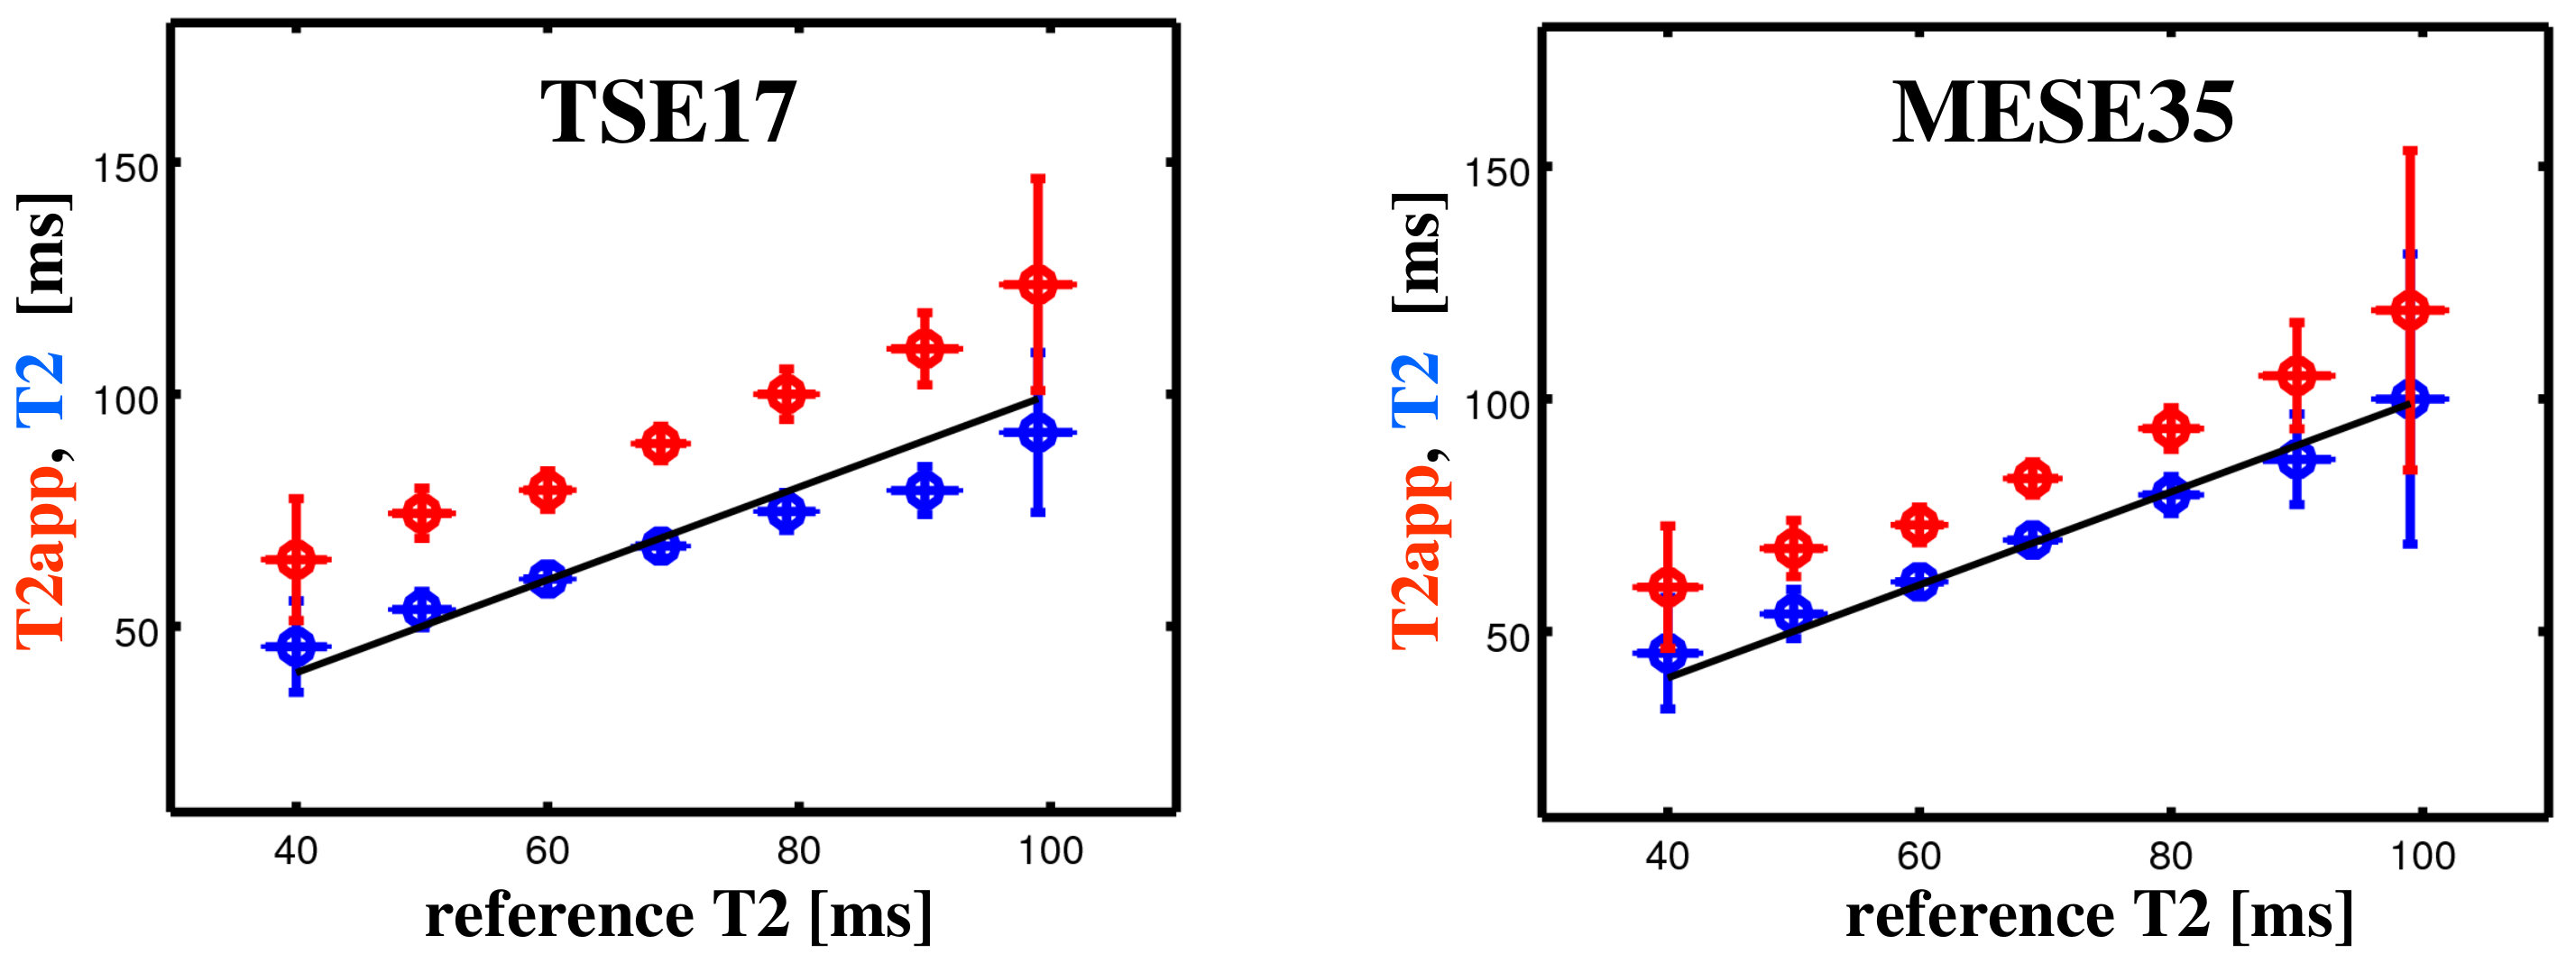
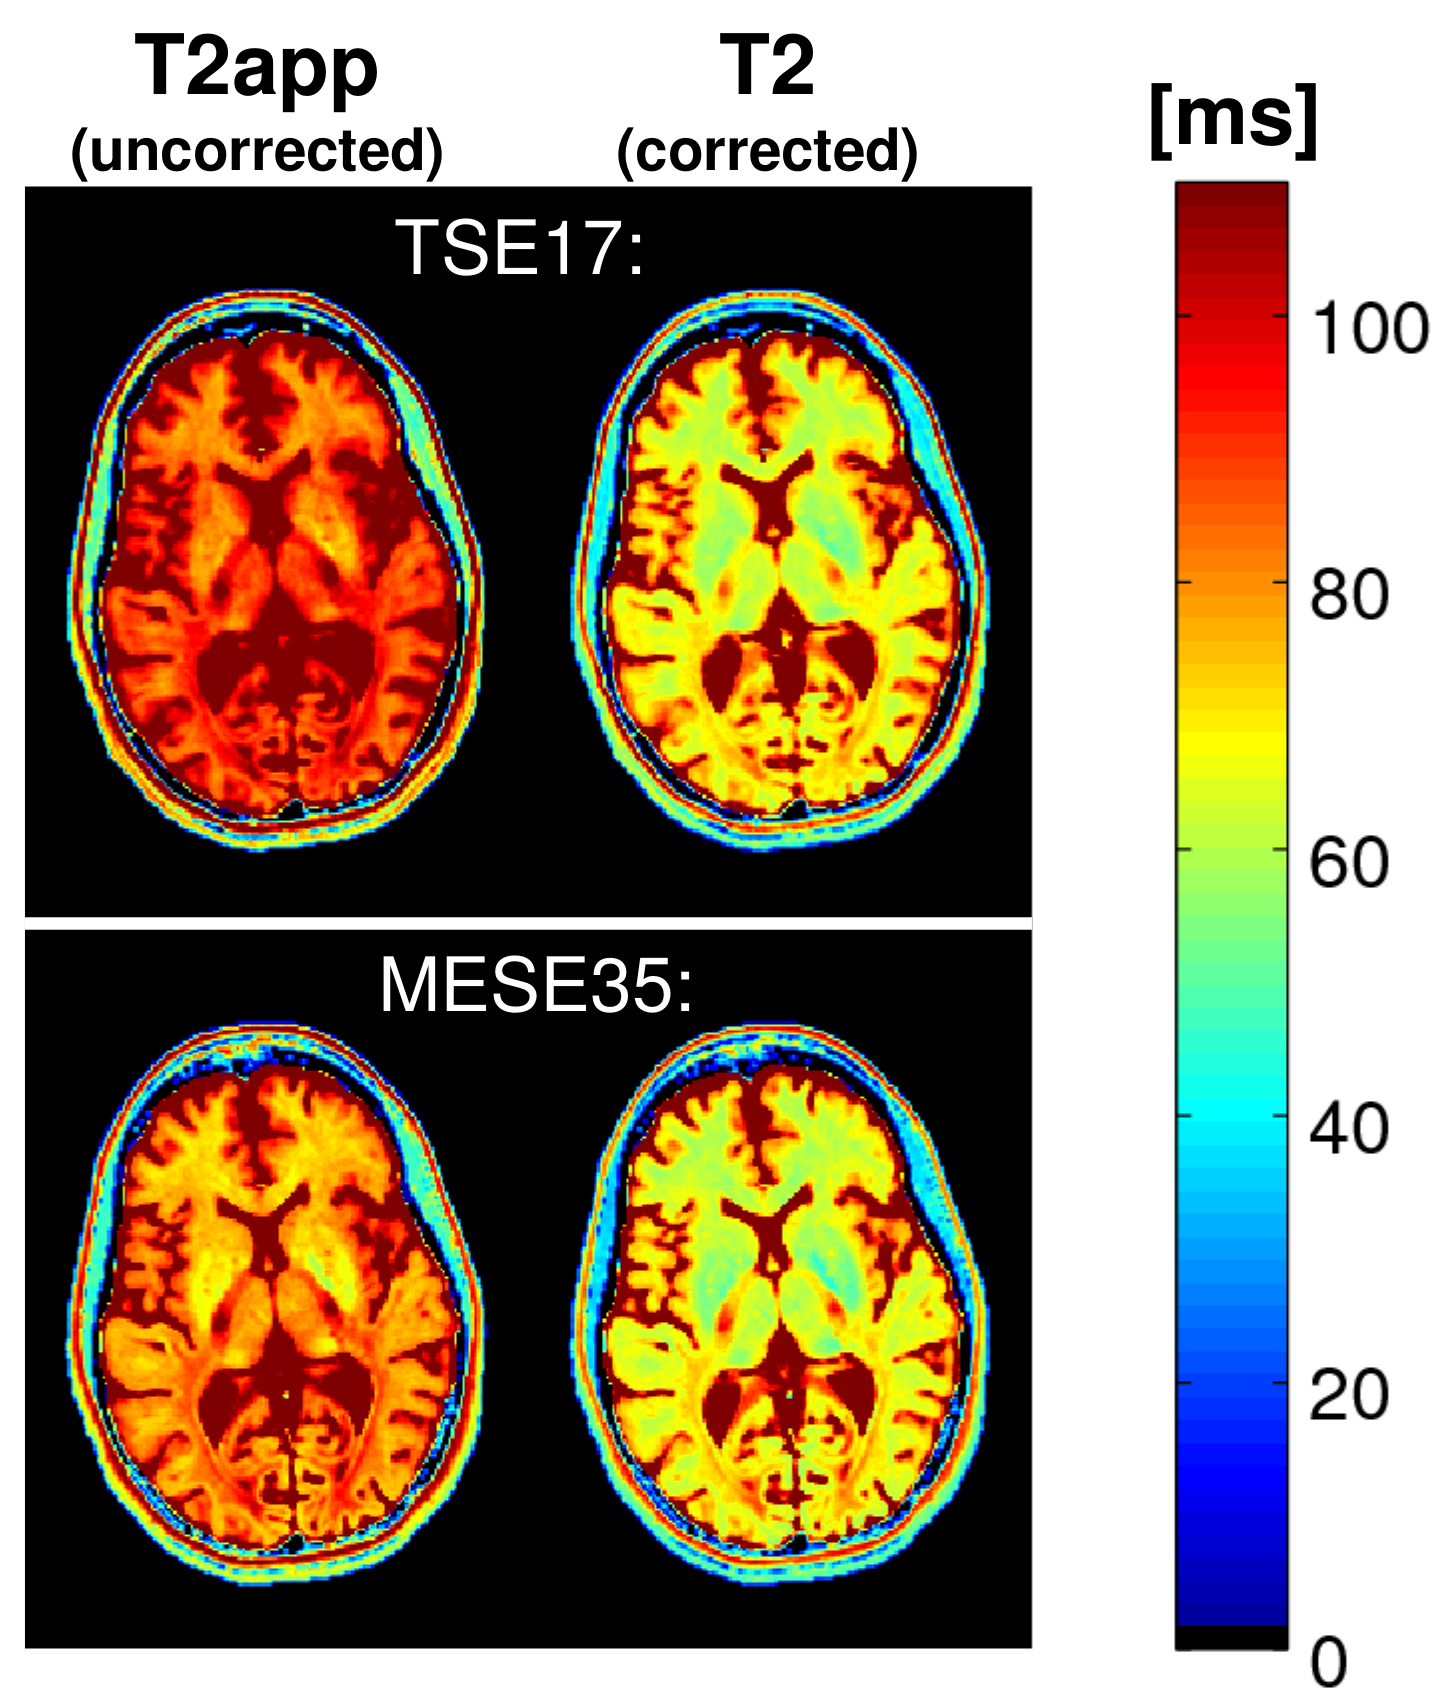
In Vivo Experiment: Figure 1 shows uncorrected T2app (red) and corrected T2 values (blue) versus reference values, pooled over all subjects, acquired with TSE17 (left) and MESE35 (right). For orientation, a straight line denoting equality is included. In contrast to T2app, corrected T2 values match the reference values. Figure 2 shows uncorrected T2app (left) and corrected T2 maps (right) of a healthy subject, acquired with the protocols TSE17 (top) and MESE35 (bottom). The corrected T2 maps look nearly identical, in contrast to the T2app maps.
Discussion
The proposed method for correcting the effects of stimulated echoes in T2 mapping based on fast SE sequences does not require a priori knowledge of RF pulse profiles, which are derived from a phantom experiment. A linear relationship between T2app and corrected T2 values was found. To increase the method's accuracy, the B1 dependence was included in the regression parameters as B1 is normally elevated in deep brain regions7 and influenced by the subject's position inside the RF-coil. In vivo results show that in contrast to T2app, corrected T2 values match closely the reference values and are consistent across protocols. Please note that the method only yields an "effective" T2, since it does not take into account the multi-exponential behavior of transverse relaxation in brain tissue8.Acknowledgements
No acknowledgement found.References
1. Hirsch NM et al., Technical considerations on the validity of blood oxygenation level-dependent-based MR assessment of vascular deoxygenation. NMR Biomed 2014;27:853-862
2. Kumar R et al., Development of T2-relaxation values in regional brain sites during adolescence. Magn Reson Imaging 2011;29:185-193
3. Bauer CM et al., Whole brain quantitative T2 MRI across multiple scanners with dual echo FSE: applications to AD, MCI, and normal aging. NeuroImage 2010;52:508-514
4. McPhee KC and Wilman AH, T2 quantification from only proton density and T2-weighted MRI by modelling actual refocusing angles. NeuroImage 2015;118:642-650
5. Petrovic A et al., Closed-Form Solution for T2 Mapping with Nonideal Refocusing of Slice Selective CPMG Sequences. Magn Reson Med 2015;73:818-827
6. Volz S et al., A fast B1-mapping method for the correction and normalization of magnetization transfer ratio maps at 3 T. NeuroImage 2010;49:3015-326
7. Nöth U et al., Quantitative in vivo T2 mapping using fast spin echo techniques – A linear correction procedure. NeuroImage 2017;157:476-485
8. MacKay A et al., In vivo visualization of myelin water in brain by magnetic resonance. Magn. Reson. Med. 1994;31:673–677
Figures