5646
An investigation into the effect of body composition on the agreement between whole-body fat mass determined by MRI and air-displacement plethysmography.1Department of Clinical Physics and Bioengineering, University Hospitals Coventry and Warwickshire, Coventry, United Kingdom, 2Research and Development Department, University Hospitals Coventry and Warwickshire, Coventry, United Kingdom, 3Department of Physics, University of Warwick, Coventry, United Kingdom
Synopsis
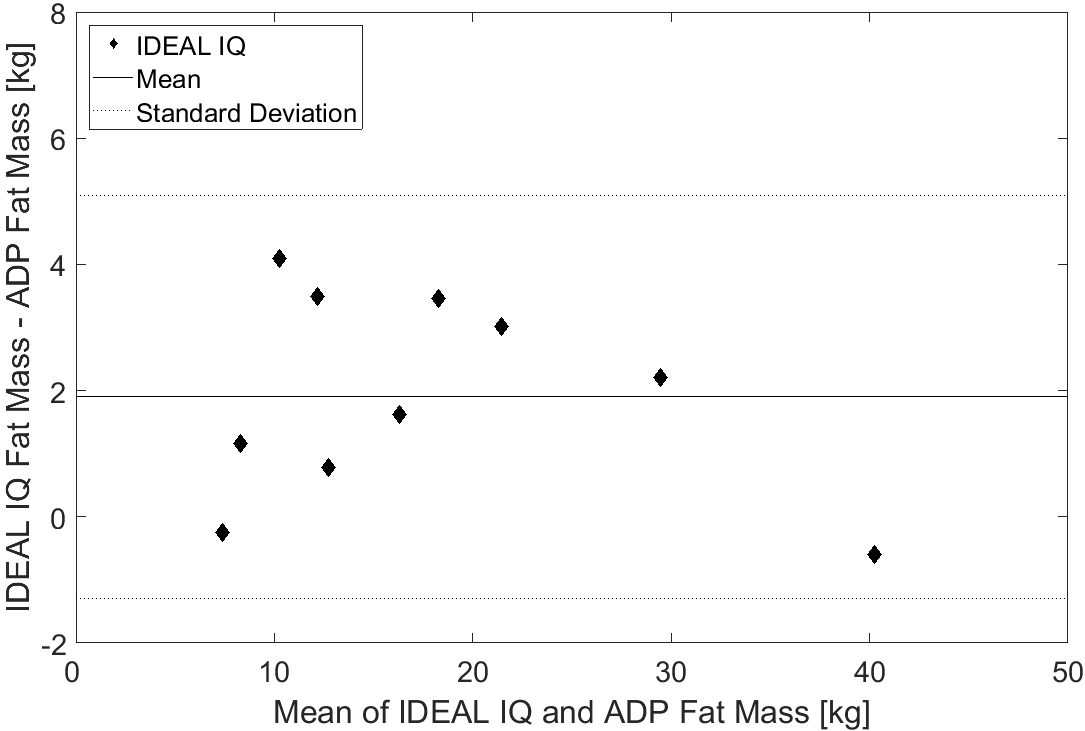
The agreement between whole-body fat mass determined using MRI and air-displacement plethysmography (ADP) was investigated for a range of non-pathological body mass indexes (BMIs). The whole-body fat mass was determined for ten volunteers by two methods: firstly by ADP using a BODPOD®; and secondly using two different MRI sequences (LAVA-flex and IDEAL IQ). The whole-body fat mass determined by both MRI protocols showed good agreement with, but were consistently higher than, the ADP determination (mean difference: LAVA-flex=4±3kg; IDEAL IQ=2±3kg). In addition, analysis of Bland-Altman plots showed no change in the differences between the MRI and ADP fat mass with BMI.
Introduction
Techniques for measuring the volume and distribution of body fat have been developed primarily to aid the management of obesity related diseases and their comorbidities1,2. Whilst the prevalence of these is increasing, so too are eating disorders and extreme exercise regimes associated with body dysmorphic disorders3 for which we believe the fat measurement techniques have not been validated. Total body fat is commonly estimated using a multi-compartment model from body density, where the body volume is determined by air-displacement plethysmography (ADP)4. The aim of this work was to perform whole-body fat mass determination using MRI and compare this with total body fat mass estimates from ADP. This was done on human subjects with body mass indexes (BMIs) covering the range of non-pathological BMIs, to estimate the agreement of total body fat mass determination between the two methods and the effect of body composition on that agreement. In a previous comparison between the two techniques5 a higher range of BMIs was studied (29.5±3.8kg/m2) at a different field strength.Methods
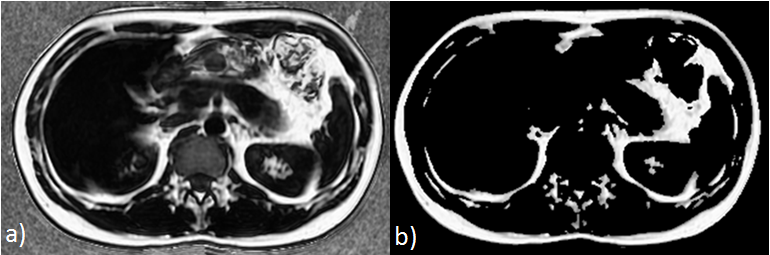
MRI measurements were made on locally fabricated fat-in-gelatine test objects and on ten volunteers on a GE Discovery 750w 3T scanner (GE Healthcare, UK). Twelve test objects, with fat percentages ranging from 0% to 100%, were made from lard, gelatine and surfactant and housed in Universal Containers. The ten volunteers, with a range of BMI:20.4-29.7kg/m2; average BMI:23.8±3.7kg/m2, comprised of five males (average age:33±12, average BMI:24.6±4.1kg/m2) and five females (average age:27±8, average BMI:23.0±3.7kg/m2), were imaged using a 21 element head and neck coil, 16 element anterior array body surface coil, 40 element spine array coil and 36 element peripheral vascular coil. All measurements were performed using two different three-dimensional gradient echo Dixon based protocols6, LAVA-flex (an extended two-point Dixon method) and IDEAL IQ (a three-point Dixon method), with the following parameters: LAVA-flex - TE/TR=2.0/4.9ms, flip angle=12°, receiver bandwidth=558Hz/pixel, FOV=48cm, slice thickness=8mm, matrix size=300x224; IDEAL IQ - TE/TR=3.2/8.4ms, flip angle=4°, receiver bandwidth=1116 Hz/pixel, FOV=44cm, slice thickness=8mm, matrix size=192x188. Percentage fat images were calculated from ‘fat-only’ (f) and ‘water-only’ (w) images (Figure 1) on a voxel-by-voxel basis using the following formula: $$$\%fat=\frac{100*f}{f+w}$$$. Consistent with previous work7, voxels calculated to contain a percentage fat above half of the maximum percentage fat in each slice were considered to be fat. The total fat mass was then calculated as the total number of fat voxels multiplied by the voxel volume and an assumed density of fat (0.9007kg/m3). Subjects underwent ADP measurements on the same day as the MRI measurements. ADP was performed in the BODPOD® Body Composition System (COSMED USA), and the whole-body fat mass estimated using a multi-compartment model4.Results and Discussion
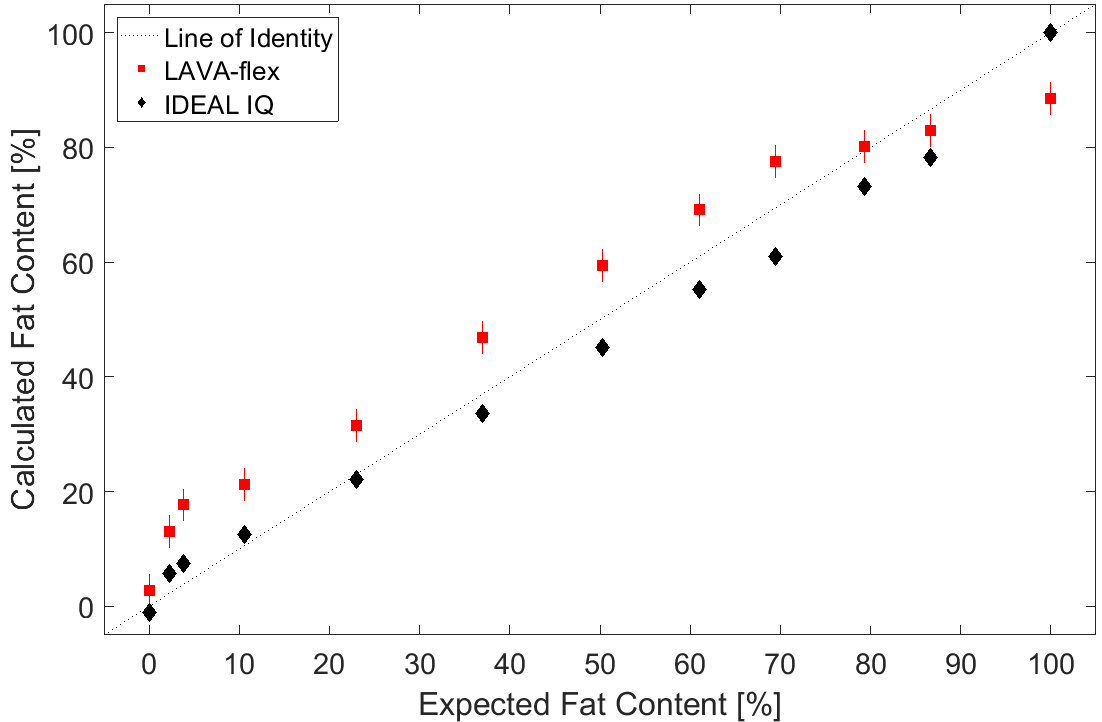
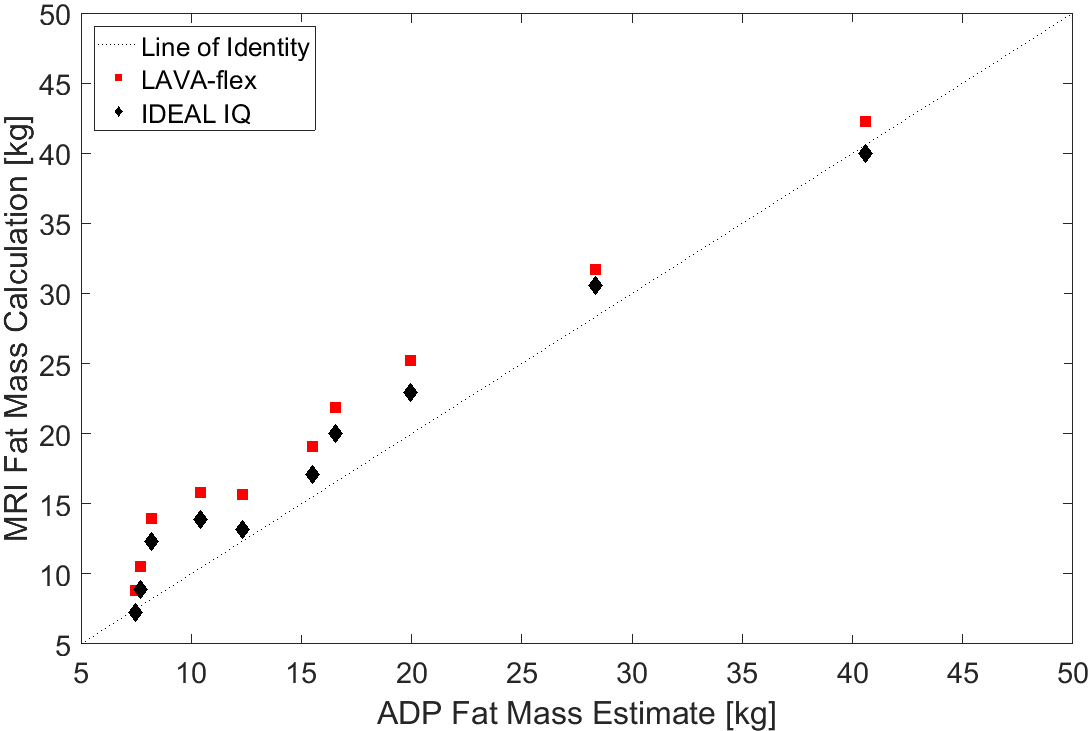
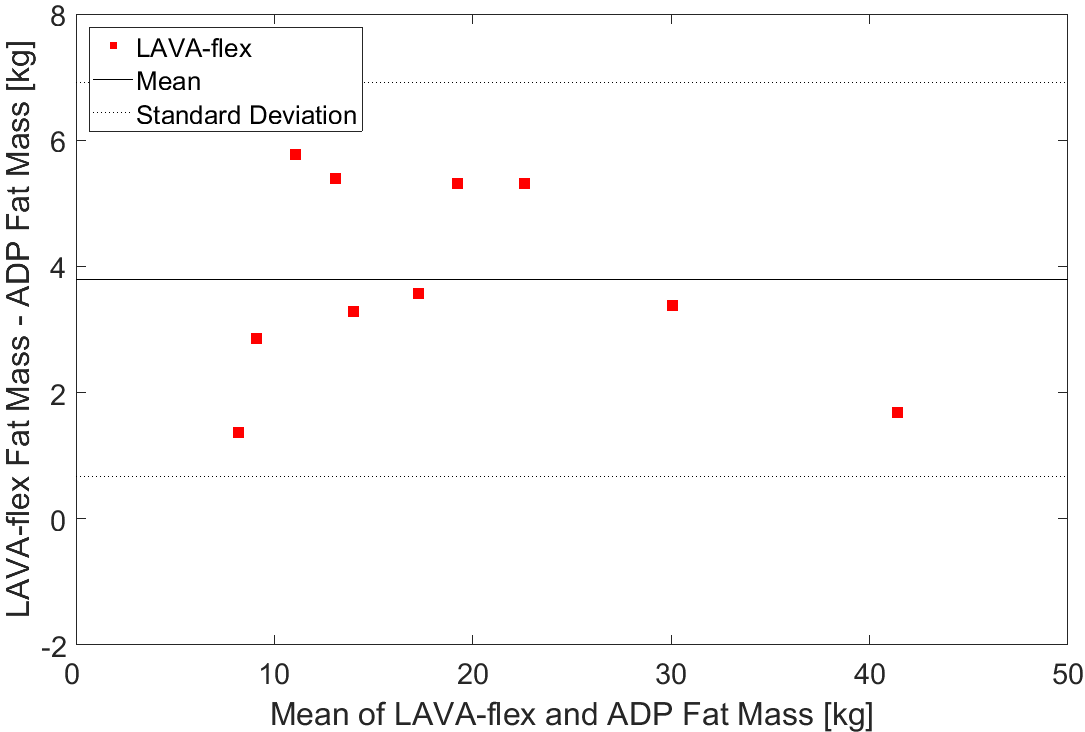
The percentage fat calculations made on the test objects showed high correlations with the expected fat percentage for both protocols (Figure 2): LAVA-flex (r=0.99, p<0.001); IDEAL IQ (r=1.00, p<0.001). The LAVA-flex protocol gave a higher fat percentage at all fat concentrations except for 100% fat compared with the IDEAL IQ protocol, where the measurement was approximately 11% lower. The whole-body MRI fat mass calculations showed high correlations with the ADP estimates (Figure 3) for both sequences (r=0.99, p<0.001). However, consistent with previous work5, calculating a fat mass using a single assumed fat density throughout the body yielded, a larger value for total body fat mass compared with the ADP estimate of body fat mass (Figures 4 and 5). The mean difference between the LAVA-flex protocol and the ADP estimation (4±3kg) was larger than the mean difference between the IDEAL IQ protocol and the ADP estimation (2±3kg), corresponding to approximately 5% and 2.5% of total body mass respectively. These findings are consistent with those in the test objects where the MRI calculated fat mass using the LAVA-flex protocol was systematically larger in value compared to the IDEAL IQ protocol calculated fat mass. This difference was probably due to the inclusion of more ‘fat’ voxels as a result of the lower maximum fat percentage measured by the LAVA-flex protocol. The difference between the fat mass calculated from either MRI protocol and the ADP fat mass estimate was not affected by the subject’s BMI (runs test, p>0.05).Conclusion
This work has shown that there is good agreement between whole-body MRI using Dixon sequences and ADP in estimating whole-body fat mass over a wide range of non-pathological BMIs. It has further shown that mean differences are independent of BMI.Acknowledgements
The authors acknowledge the support of Eddie Ng’Andwe, Alison Campbell and the staff of the MRI Department and Human Metabolic Research Unit in making the measurements. We also wish to thank Simon Dezonie from GE Healthcare for his help with the initial protocol set-up.References
1. Ulijaszek, S. Obesity: Preventing and Managing the Global Epidemic. Report of a WHO Consultation. WHO Technical Report Series. 2003;894:252.
2. Wilson, D. Obesity. The report of the British Nutrition Foundation Task Force. British Journal of Sports Medicine. 2000;34(1):73-74.
3. França, K. et al. Body dysmorphic disorder: history and curiosities. Wiener Medizinische Wochenschrift. 2017.
4. Siri SE. Body composition from fluid spaces and density: analysis of methods. In: Brozek J, Henschel A, eds. Techniques for measuring body composition. Washington, DC: National Academy of Sciences, National Research Council. 1961:223–34.
5. Ludwig, U. et al. Whole-body MRI-based fat quantification: A comparison to air displacement plethysmography. Journal of Magnetic Resonance Imaging. 2014;40(6):1437-1444.
6. Bray, T. et al. Fat fraction mapping using magnetic resonance imaging: insight into pathophysiology. The British Journal of Radiology. 2017;344.
7. Poonawalla, A. et al. Adipose tissue MRI for quantitative measurement of central obesity. Journal of Magnetic Resonance Imaging. 2012;37(3):707-716.
Figures