5641
Simultaneous mapping of R2*, T1, and proton density fat fraction for the liver: single breath-hold acquisition with multi-echo spoiled gradient echo and compressed sensing1Department of Radiology, University of Yamanashi, Chuo, Japan, 2GE Healthcare Japan, Hino, Japan
Synopsis
In this study, we developed multi-parameter mapping including T1, R2*, and proton density fat fraction with a single breath-hold, to evaluate liver disease and liver function. Six-echo spoiled gradient echo sequence with dual flip angles was used to acquire a 12-set MRI volume dataset. To shorten the scan time, undersampling and multi-contrast compressed sensing reconstruction were used. Quantitative values were validated by performing phantom and volunteer studies.
INTRODUCTION
T1 mapping for the liver is a promising approach to evaluate liver fibrosis and function1,2,3. Recently, look-locker-based, two-dimensional T1 measurement methods have been used for the liver3,4. However, accurate and robust T1 measurements remain challenging because fat and iron accumulation in the liver cause measurement bias4,5. Therefore, implementation of proton density fat fraction (PDFF) and R2* estimation is of interest to overcome these biases. In addition, a three-dimensional T1 map is required because of the heterogeneous distribution of fat, iron, and fibrosis in the liver.In this study, quantitative mapping of PDFF, R2*, and T1 was proposed by using a dual flip angle (DFA) and multi-echo spoiled gradient (SPGR) echo sequence. Acquisition with a single breath hold (~20 s) was achieved with multi-contrast compressed sensing (CS). T1 was measured using the DESPOT-16. The experimental studies validated the measurements of PDFF, R2*, and T1 by the proposed method, compared with conventional PDFF and magnetic resonance (MR) spectroscopy.METHODS
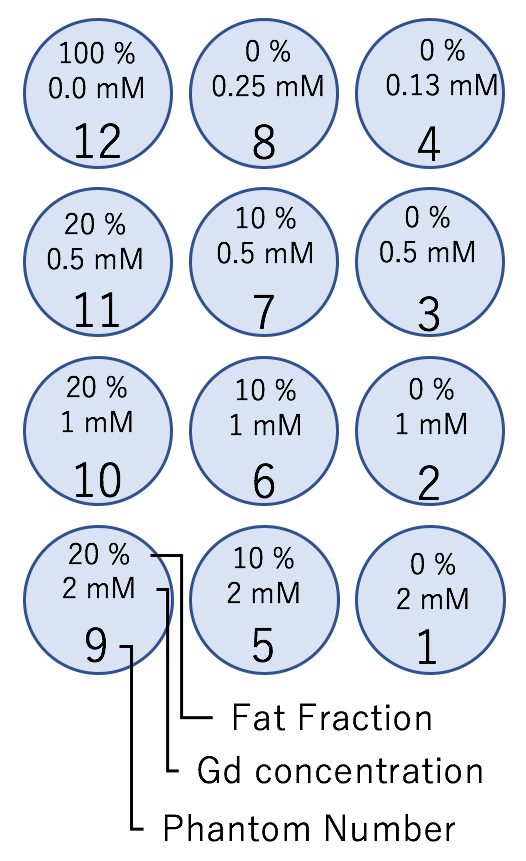
Phantom and volunteer studies were performed using a 3-Tesla clinical MR system (Discovery MR750; GE Healthcare, Waukesha, WI) with a whole-body coil and 32-channel torso array. The hand-made phantoms consisted of 10 acrylic containers (inner diameter = 30 mm, outer diameter = 40 mm, height = 35 mm), each filled with agarose gel mixed with gadolinium and peanut oil, as shown in Fig. 1. One patient was recruited after approval from our institutional review board.
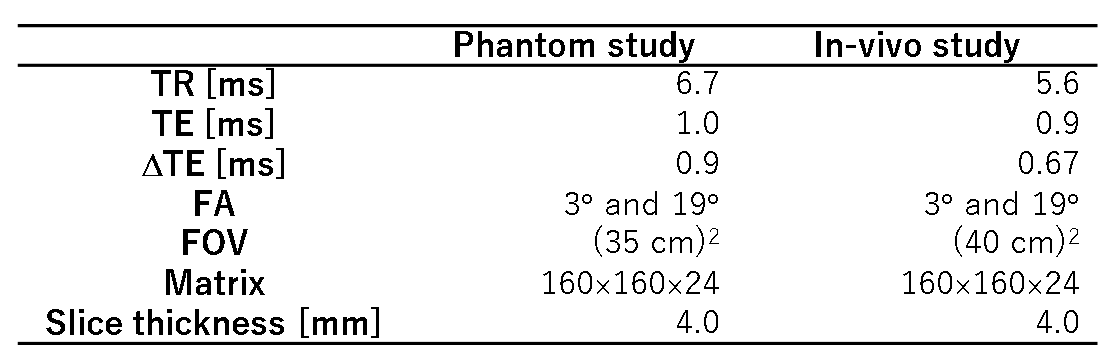
DFA multi-echo SPGR sequences (flip angle (FA) = 3° and 19°) were used for the acquisition. To achieve accurate T1 mapping, the set of FAs was optimized using a method proposed by Deoni et al6. The MR images were acquired in four-dimensional space ($$$x, y, z, t$$$), where $$$x$$$, $$$y$$$, $$$z$$$, and $$$t$$$ were the readout, phase encode, slice encode, and echo time (TE), respectively. The sequence parameters for the studies are shown in Table 1.
Multi-contrast CS reconstruction was implemented with the variable density Cartesian trajectory (reduction factor = 4.5). The MR images were obtained by solving the equation below:
$$X = {\rm arg} \min_{x} \parallel AX-y \parallel^2 + \lambda\parallel \mathcal{F}_{t}X \parallel_{TV},$$
where $$$X$$$ is the MR image to be reconstructed, $$$y$$$ is the acquired k-space dataset, $$$A$$$ is the observation matrix, $$$\parallel x \parallel_{TV}$$$ is the total variation (TV) operator, and $$$\mathcal{F}_{t}$$$ is the Fourier transform along the TE dimension, respectively. $$$A$$$ is expressed as $$$A= PFTS$$$, where $$$S$$$ is the sensitivity map of the receiver, $$$T$$$ is the spatial phase variation, $$$\mathcal{F}$$$ is the Fourier transform, and $$$P$$$ is the undersampling operator. The TV operator was defined as follows:
$$\parallel \mathcal{F}_{t} X \parallel_{TV} = \sum_i^N\sqrt{(\nabla_x(\mathcal{F}_{t}X))^2 + (\nabla_y(\mathcal{F}_{t}X))^2 + (\nabla_z(\mathcal{F}_{t}X))^2},$$
where $$$N$$$ is the number of the voxel and $$$\nabla_x$$$, $$$\nabla_y$$$, and $$$\nabla_z$$$ are the finite difference operators along $$$x$$$, $$$y$$$, and $$$z$$$. The equation was solved using the split Bregman method7.The PDFF and R2* mapping, and water–fat separation were performed using the iterative least-squares with multi-peak model proposed by Yu et al8. The T1 map was calculated using the separated water images and DESPOT-16.For the comparison of the mapping results, PDFF, R2*, and water T1 were measured with the Dixon-based clinical sequence (IDEAL-IQ, GE Healthcare, Waukesha, WI) and multi-TR/TE single-voxel stimulated echo acquisition mode9 (STEAM; TR varied from 150 to 2000 ms, TE varied from 10 to 110 ms, FA= 90°, voxel size=(2 cm)3, 32 spectra).
RESULTS and DISCUSSION
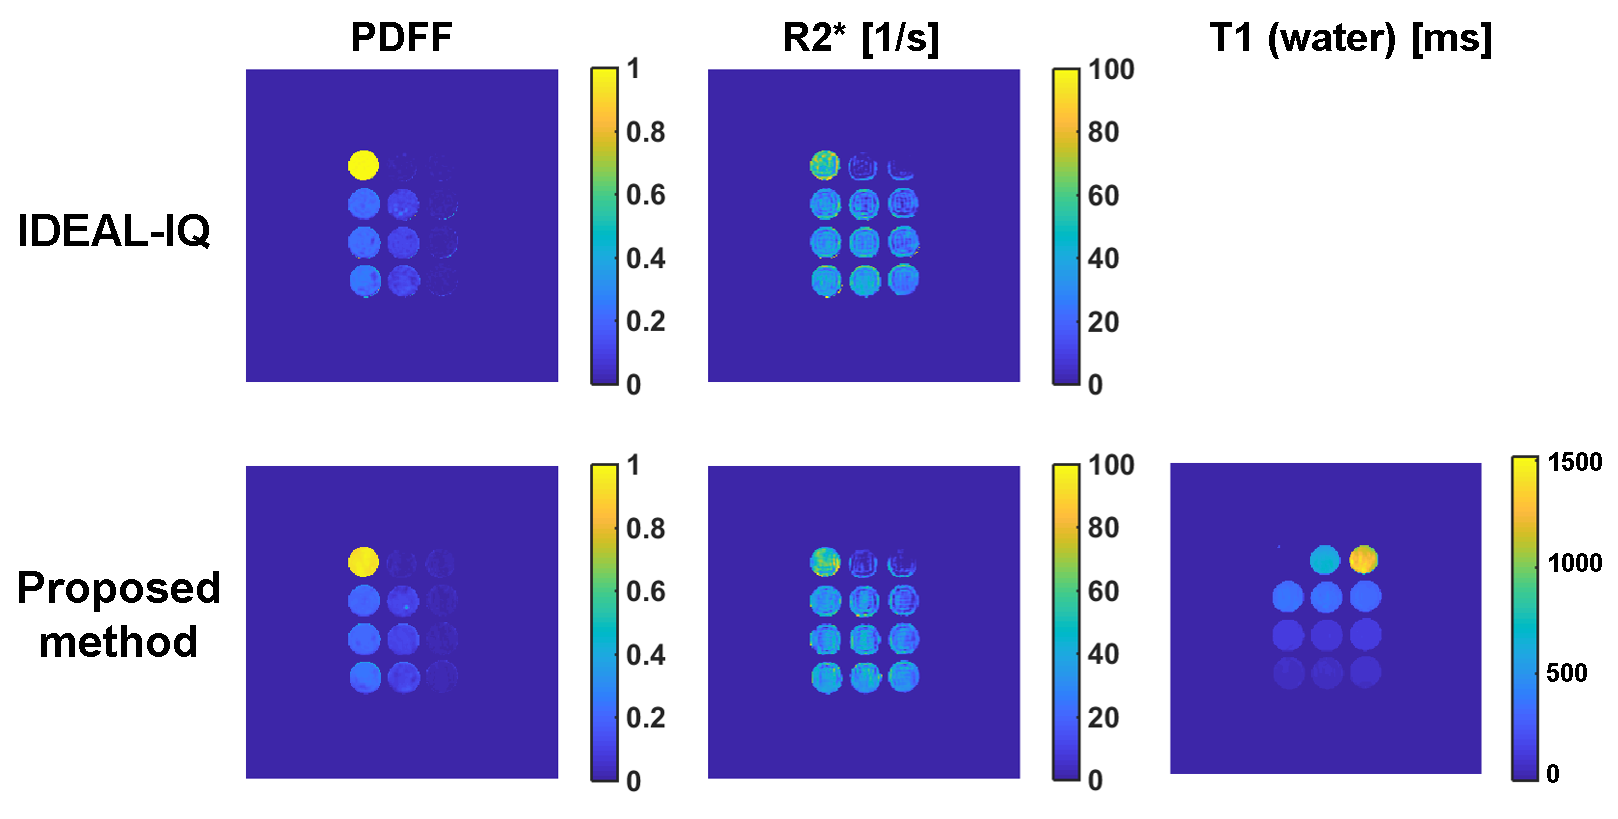
Fig. 2 shows the PDFF and R2* maps of the phantoms measured using the IDEAL-IQ sequence and the proposed method (Fig. 2 a–d), and the T1 map using the proposed method (Fig. 2 e). The values of PDFF, R2*, and T1 agreed well among the 3 methods (Fig. 3 a–c).
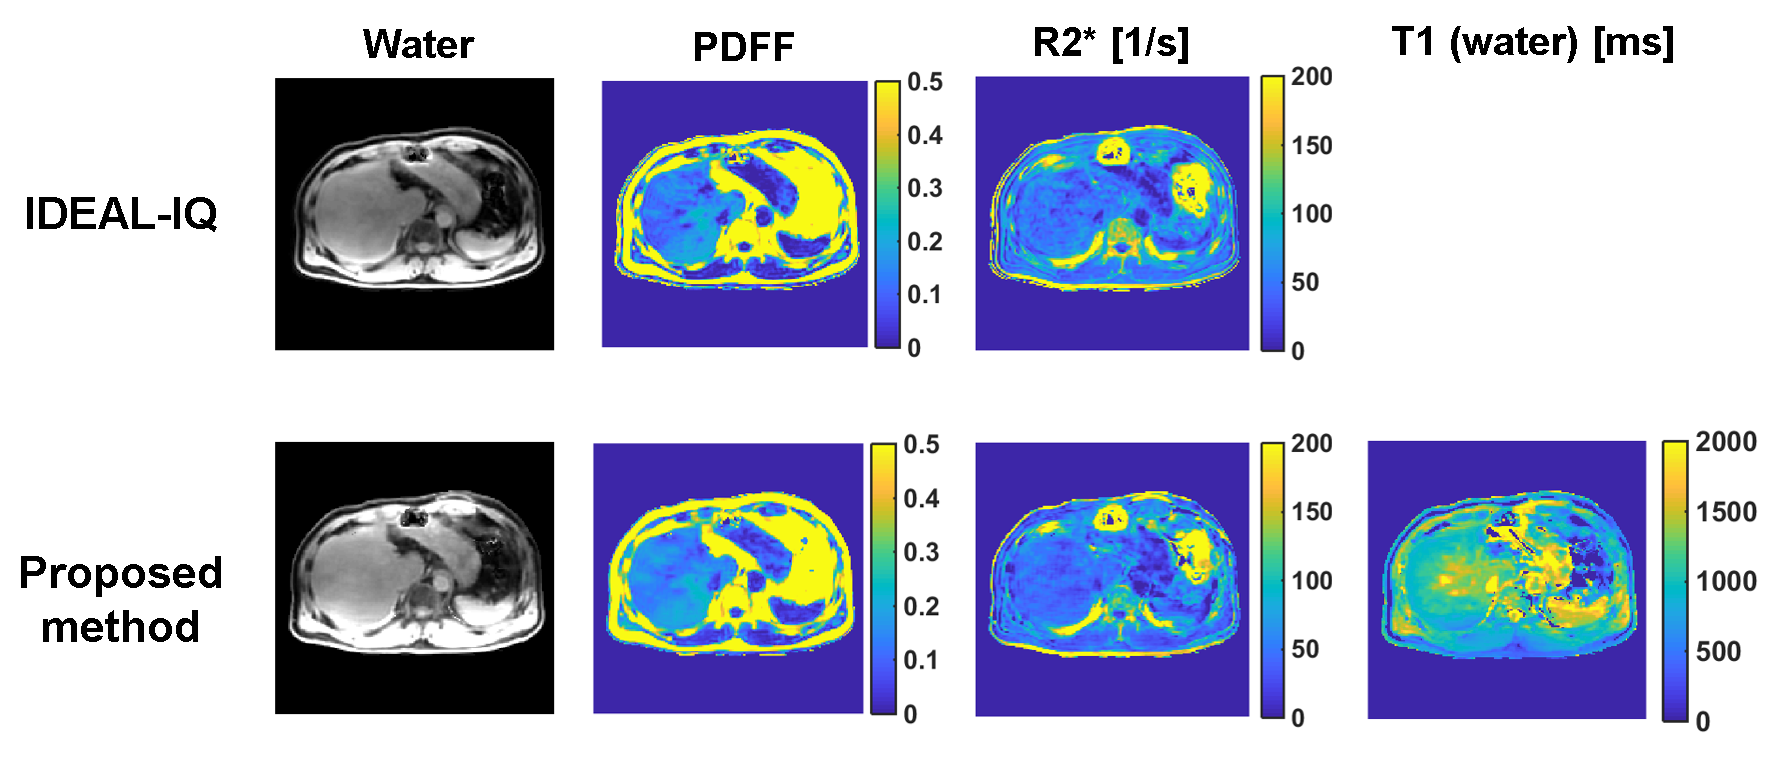
Quantitative maps, and water images for the volunteer study are shown in Fig. 4. The quantitative values (PDFF = 11.9 ± 4.5 [%], R2* = 45.9 ± 10.3 [1/s], T1 = 1163 ± 212 [ms]) of PDFF, R2*, and T1 in the right lobe were similar to those measured with the IDEAL-IQ sequence (PDFF = 11.0 ± 3.6 [%], R2* = 43.5 ±8.7 [1/s]) and STEAM (PDFF = 10.3 [%], T1 =1170 [ms]). A limitation of this study was a potential bias in T1 due to the iron accumulation in the liver. It may be corrected using the R2* map in future studies3.
CONCLUSION
In this study, we proposed a three-dimensional SPGR sequence to obtain T1, R2*, and PDFF maps with a single breath-hold. Multi-contrast CS was used to shorten the acquisition time. The phantom and volunteer studies demonstrated the accuracy of our method.Acknowledgements
No acknowledgement found.References
1. Katsube T, et al. Invest Radiol. 2011;46(4):277-283.
2. Haimerl M,et al. PLoS One. 2013;8(12):e85658.
3. Banerjee R, et al. J Hepatol. 2014;60(1):69-77.
4. Mozes FE, et al. J Magn Reson Imaging. 2016;44(1):105-111.
5. Hernando D, et al. Magn Reson Med. 2013;70(5):1319-1331.
6. Deoni SCL, et al. Magn Reson Med. 2003;49(3):515-526.
7. Goldstein T, et al. SIAM J Imaging Sci. 2009;2(2):323-343.
8. Yu H, et al. Magn Reson Med. 2008;60(5):1122-1134.
9. Hamilton G, et al. J Magn Reson Imaging. 2015;42(6):1538-1543.
Figures