5638
STimulated Echo based Mapping (STEM) of T1, T2 and Apparent Diffusion Coefficient1Radiology, University of Wisconsin Madison, Madison, WI, United States, 2Medical Physics, University of Wisconsin Madison, Madison, WI, United States, 3Biomedical Engineering, University of Wisconsin Madison, Madison, WI, United States, 4Global MR Applications & Workflow, GE Healthcare, Menlo Park, CA, United States
Synopsis
This study proposed an approach for joint estimation of T1 and T2 relaxation as well as quantitative diffusion parameters. The proposed approach has been evaluated in quantitative relaxation-diffusion phantom, in-vivo brain
Introduction
Joint estimation of relaxation and quantitative diffusion parameters may enable improved diagnosis and treatment evaluation in multiple MRI applications, including brain1-3, skeletal muscle4-6, and prostate imaging7-9. Although several methods have been proposed for simultaneous T1, T2 and ADC mapping2-3, a reliable approach for simultaneous mapping of these three parameters is still lacking. In this study, a method for STimulated-Echo based Mapping (STEM) of T1, T2 and ADC is proposed.
Methods
Signal model: The STE-DW imaging sequence10 is used because of its capability to modulate T1-weighting, T2-weighting and diffusion-weighting by varying the mixing time (TM), echo time (TE), and b-value, respectively. The acquired signal can be modeled as$${S=A(1-e^{-\frac{TR_{eff}}{T1}})e^{-\frac{TM}{T1}}e^{-\frac{TE}{T2}}e^{-bADC},(Eq.1)}$$where$$TR_{eff}=TR-TM-\frac{TE}{2}.(Eq.2)$$The proposed method includes:1) acquiring multiple STE images with various values of TM, TE, and b, and 2) jointly estimating T1, T2 and ADC maps using voxel-wise non-linear least-squares fitting with the signal model shown in Eq.1. Proton density-weighted images A are also estimated simultaneously.
Phantom experiment: A twelve-vial T1/T2/diffusion phantom was constructed by mixing acetone (as a signal source) with various concentrations of DI water (to modulate the ADC of acetone) and MnCl2 (to modulate both T1/T2 of acetone)11. Images were acquired on a 3T scanner (GE Healthcare, Waukesha, WI) with a 32-channel torso coil. The proposed STEM acquisition was obtained with four TM-TE combinations, each with six b-values. Additionally, reference T112, T2 and ADC maps were acquired (see details in Table 1(a)). Signals from STEM images were fitted to the model (Eq.1) for each voxel using non-linear least-squares, providing quantitative maps of T1, T2, and ADC. Measurements were made from each quantitative map using a 1cm2 ROI within each vial.
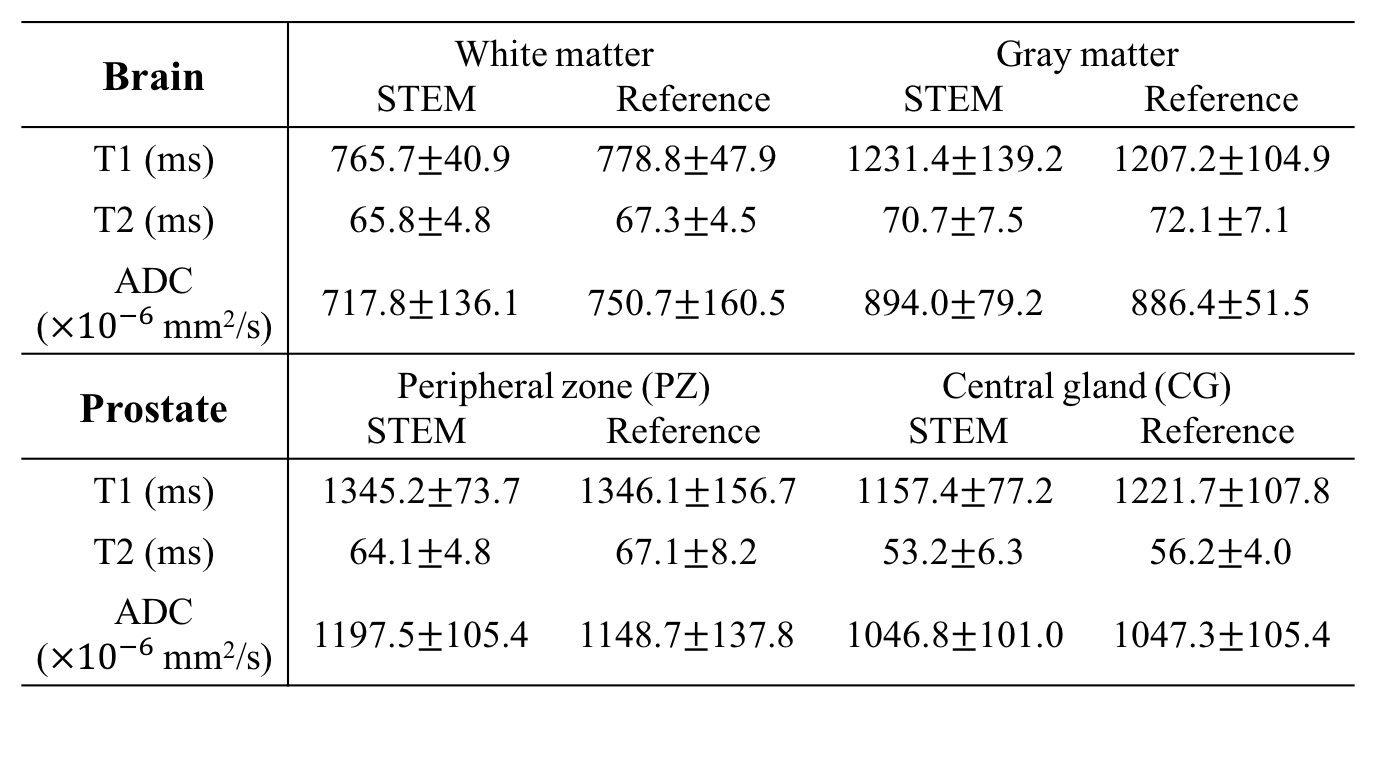
In-vivo experiments: After IRB approval and informed written consent, healthy volunteers (n=6) were scanned with an eight-channel head coil for brain mapping and a 32-channel torso coil for prostate mapping in the 3T scanner. In each organ, joint mapping of T1, T2, and ADC was performed using the proposed STEM method. In addition, reference maps of T1 and T2 were obtained separately using standard methods (Table 1). The ADC maps from a single STE-DWI acquisition (TE=40ms,TM=100ms) instead of Spin-Echo DWI were used as the reference to match the diffusion time of the proposed method under restricted diffusion. Histograms of pixel-wise quantitative measurements covering the entire slice were plotted in two different brain imaging slices. Similar histograms were applied to prostate images but only covering the prostate area. Co-localized ROIs were drawn in the brain (white matter ROI~1cm2, gray matter ROI~40mm2), and in the prostate (peripheral zone (PZ) ROI~40mm2, and central gland (CG) ROI~40mm2).
Results
Fig.1 shows the T1, T2 and ADC maps and measurements in the diffusion phantom. Fig.2 shows representative quantitative maps for two different slices of the brain with histograms from the entire slice. Representative maps in the prostate are presented in Fig.3, where the histograms are drawn from only the prostate area. Table 2 lists the averaged ROI measurements from volunteers in the brain and the prostate.
Discussion
In this study, a STimulated Echo based Mapping (STEM) method has been proposed for joint quantitative T1, T2 and ADC mapping. The overall T1, T2 and ADC measurements have been shown to be accurate in phantom experiments, brain imaging and prostate imaging. Importantly, the proposed method presents several challenges as well as opportunities. Joint estimation from STEM may introduce some estimation bias compared to the reference sequences because partial volume effects may result in b-value dependent T1 and T2 measurements14. However, the ability to characterize signals from each voxel over three parametric dimensions (T1, T2, and ADC) may also provide an opportunity to separate different intra-voxel signal components. Further, the proposed signal model can be extended in various ways, eg: with more sophisticated diffusion models, including diffusion kurtosis, IVIM, or DTI models. Additional challenges of STEM are similar to other DW-EPI techniques, including inter-acquisition motion and geometric distortion. The acquisition time in this preliminary study is sometimes longer than the reference DESPOT113 method. This is mainly because we are currently oversampling the TM-TE-b space for feasibility evaluation. In addition, the acquisition time will increase with denser sampling of the three-dimensional TM-TE-b space and longer TM. Different approaches may be used to accelerate this method, including protocol optimization, undersampling along the three-dimensional TM-TE-b space15 and implementing multi-band/multi-slice acquisitions during the mixing time.
Conclusion
A STimulated Echo based Mapping (STEM) approach for accurate joint estimation of T1, T2 and ADC maps is proposed and evaluated in phantom, brain and prostate imaging. The proposed approach has the potential to enable multi-dimensional tissue characterization in clinically feasible acquisition times.
Acknowledgements
This study is supported by NIH-NIDDK Wisconsin Multidisciplinary K12 Urologic Research Career Development Program K12DK100022 (PD: D. Bjorling). The authors would like to acknowledge research support from GE Healthcare.References
[1] Ma, D., Gulani, V., Seiberlich, N., Liu, K., Sunshine, J. L., Duerk, J. L., & Griswold, M. A. (2013). Magnetic resonance fingerprinting. Nature, 495(7440), 187.
[2] Jiang, Y., Ma, D., Wright, K., Seiberlich, N., Gulani, V., & Griswold, M. A. (2013). Simultaneous T1, T2, diffusion and proton density quantification with MR fingerprinting. Magn. Reson. Imaging, 38(1), 173-9.
[3] Gras, V., Farrher, E., Grinberg, F., & Shah, N. J. (2017). Diffusion‐weighted DESS protocol optimization for simultaneous mapping of the mean diffusivity, proton density and relaxation times at 3 Tesla. Magnetic resonance in medicine, 78(1), 130-141.
[4] Li, K., Dortch, R. D., Welch, E. B., Bryant, N. D., Buck, A. K., Towse, T. F., ... & Park, J. H. (2014). Multi‐parametric MRI characterization of healthy human thigh muscles at 3.0 T–relaxation, magnetization transfer, fat/water, and diffusion tensor imaging. NMR in Biomedicine, 27(9), 1070-1084.
[5] Saab, G., Thompson, R. T., & Marsh, G. D. (1999). Multicomponent T2 relaxation of in vivo skeletal muscle. Magnetic resonance in medicine, 42(1), 150-157.
[6] Morvan, D., & Leroy-Willig, A. (1995). Simultaneous measurements of diffusion and transverse relaxation in exercising skeletal muscle. Magnetic resonance imaging, 13(7), 943-948.
[7] Gibbs, P., Tozer, D. J., Liney, G. P., & Turnbull, L. W. (2001). Comparison of quantitative T2 mapping and diffusion‐weighted imaging in the normal and pathologic prostate. Magnetic resonance in medicine, 46(6), 1054-1058.
[8] Foltz, W. D., Wu, A., Chung, P., Catton, C., Bayley, A., Milosevic, M., ... & Haider, M. A. (2013). Changes in apparent diffusion coefficient and T2 relaxation during radiotherapy for prostate cancer. Journal of Magnetic Resonance Imaging, 37(4), 909-916.
[9] Kershaw, L. E., Hutchinson, C. E., & Buckley, D. L. (2009). Benign prostatic hyperplasia: Evaluation of T1, T2, and microvascular characteristics with T1‐weighted dynamic contrast‐enhanced MRI. Journal of Magnetic Resonance Imaging, 29(3), 641-648.
[10] Bammer, R. (2003). Basic principles of diffusion-weighted imaging. European journal of radiology, 45(3), 169-184.
[11] Wang, X., Reeder, S. B., & Hernando, D. (2017). An acetone‐based phantom for quantitative diffusion MRI. Journal of Magnetic Resonance Imaging.
[12] Barral, J. K., Gudmundson, E., Stikov, N., Etezadi‐Amoli, M., Stoica, P., & Nishimura, D. G. (2010). A robust methodology for in vivo T1 mapping. Magnetic resonance in medicine, 64(4), 1057-1067.
[13] Deoni, S. C., Peters, T. M., & Rutt, B. K. (2005). High‐resolution T1 and T2 mapping of the brain in a clinically acceptable time with DESPOT1 and DESPOT2. Magnetic resonance in medicine, 53(1), 237-241.
[14] Kim, D., Doyle, E. K., Wisnowski, J. L., Kim, J. H., & Haldar, J. P. (2017). Diffusion‐relaxation correlation spectroscopic imaging: A multidimensional approach for probing microstructure. Magnetic Resonance in Medicine.
[15] Benjamini, D., & Basser, P. J. (2016). Use of marginal distributions constrained optimization (MADCO) for accelerated 2D MRI relaxometry and diffusometry. Journal of Magnetic Resonance, 271, 40-45.
Figures
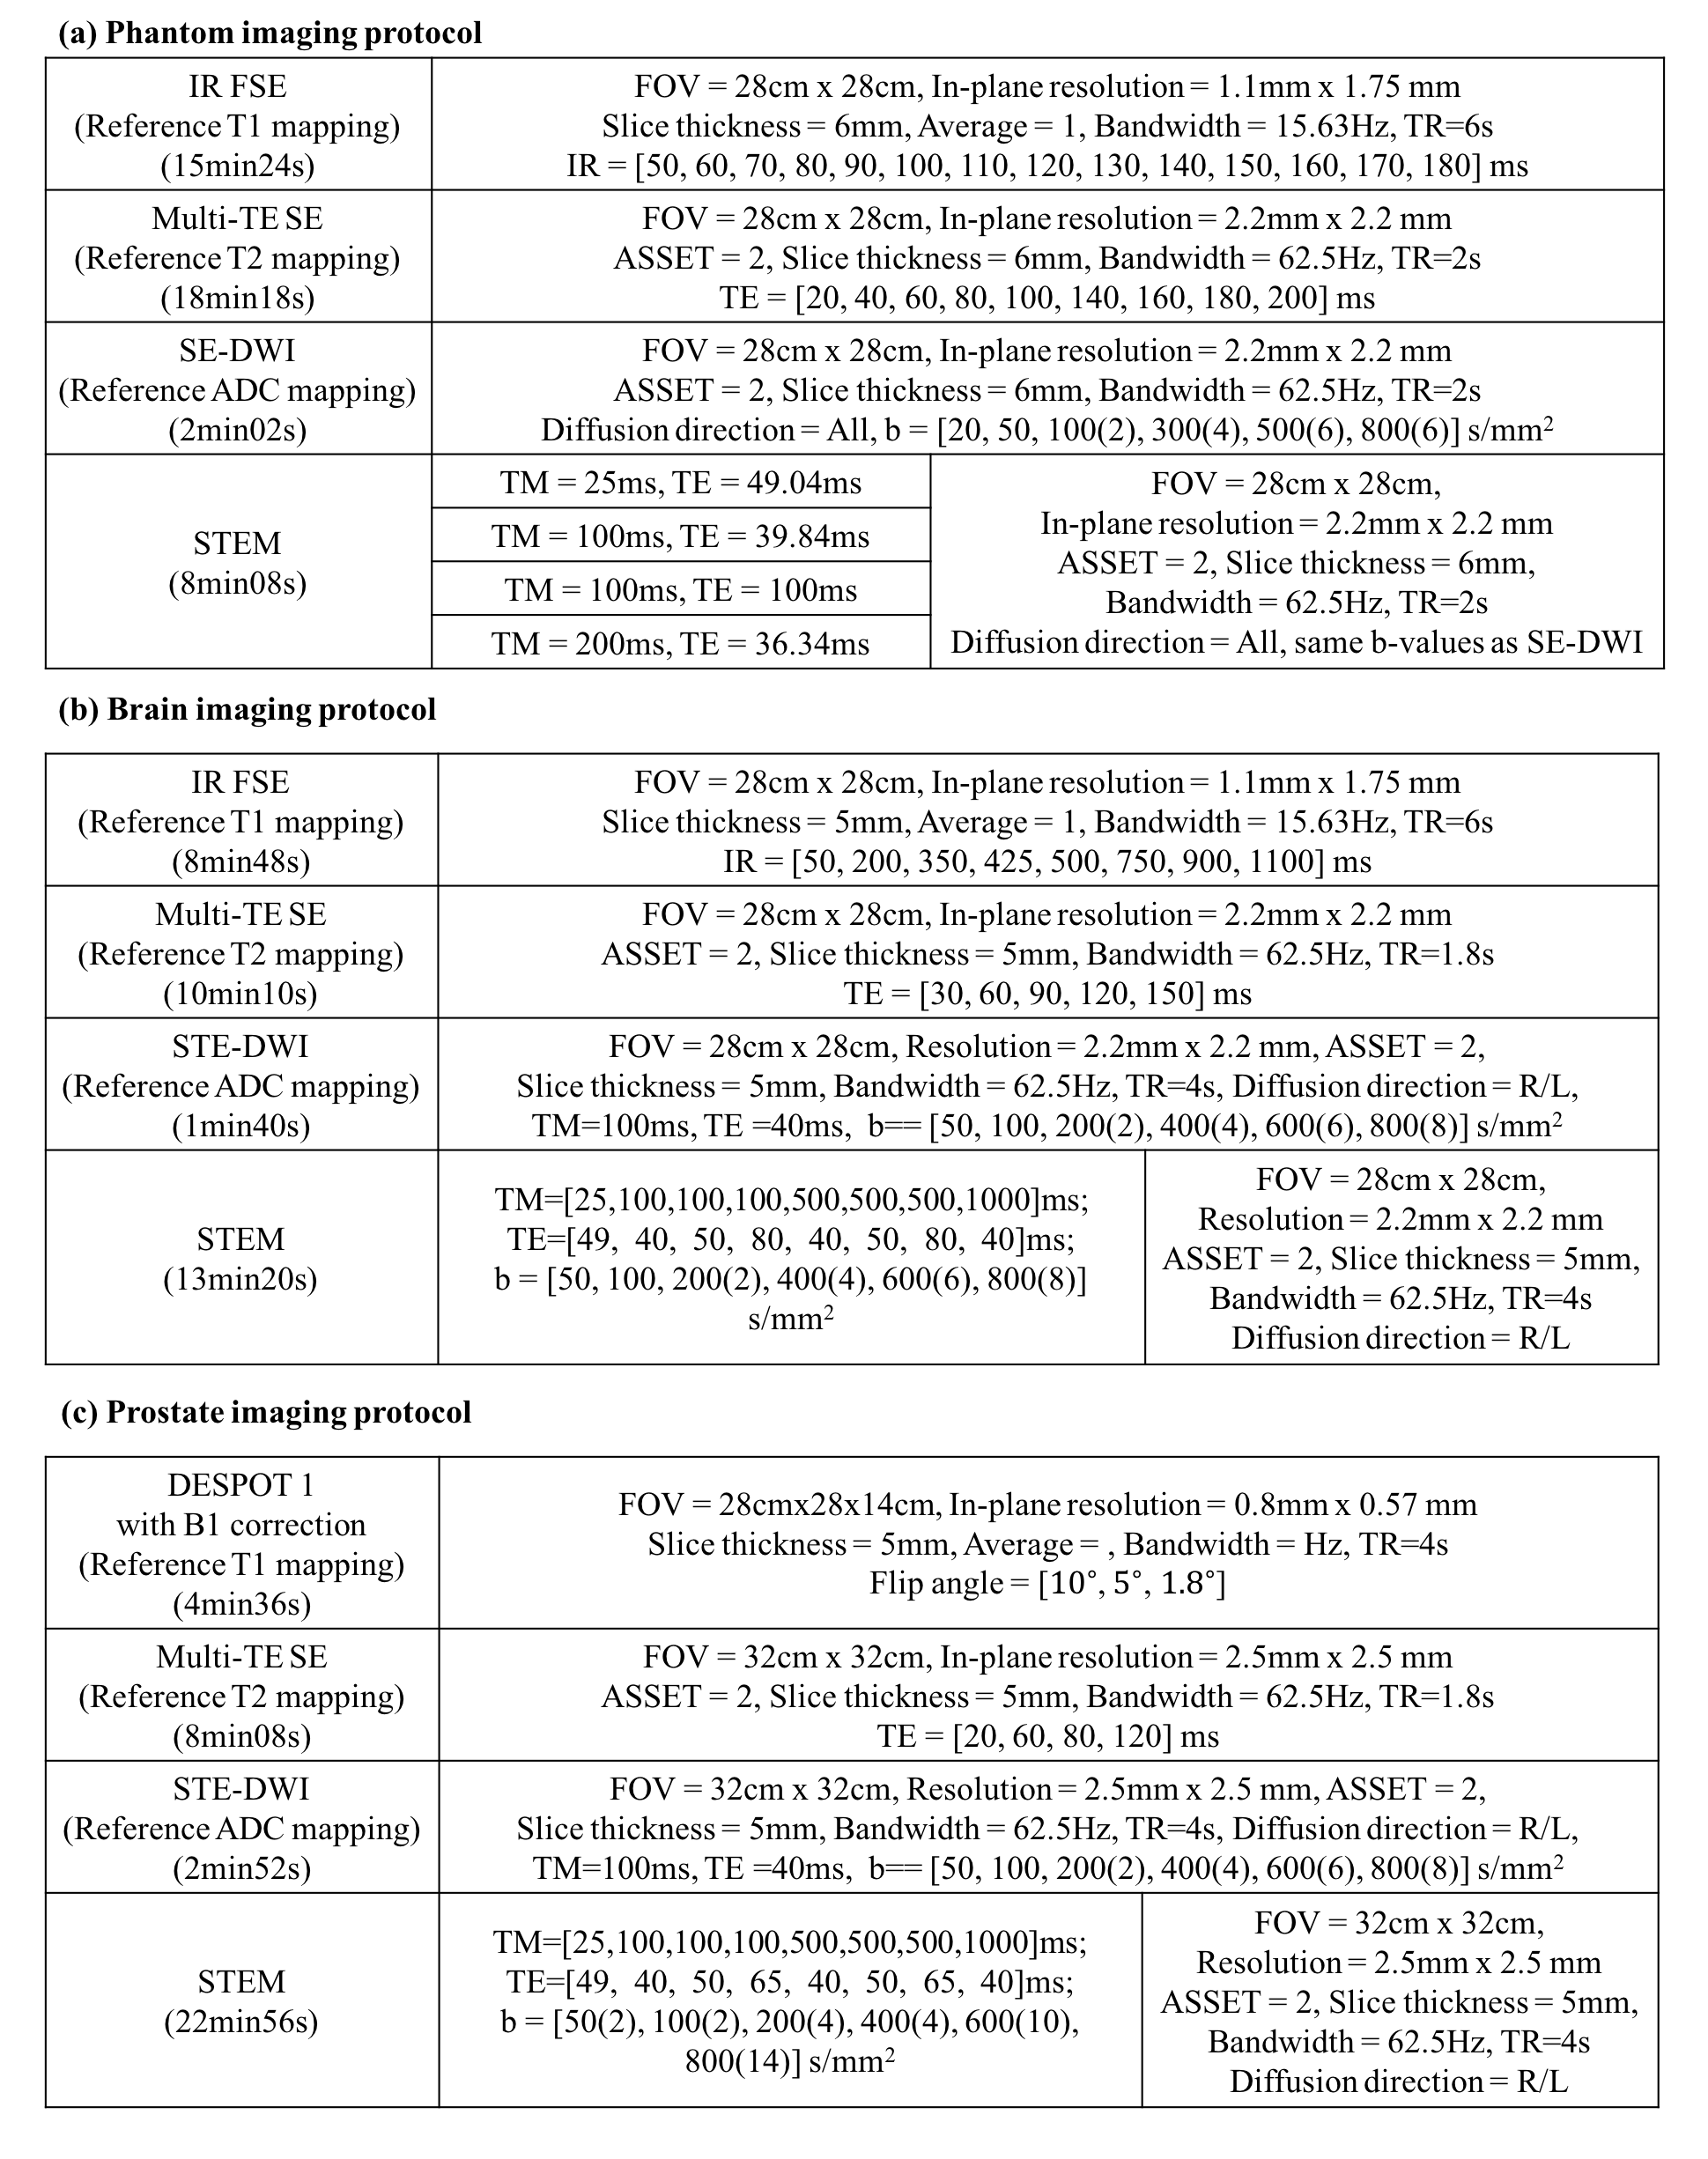
Table 1. Imaging protocol
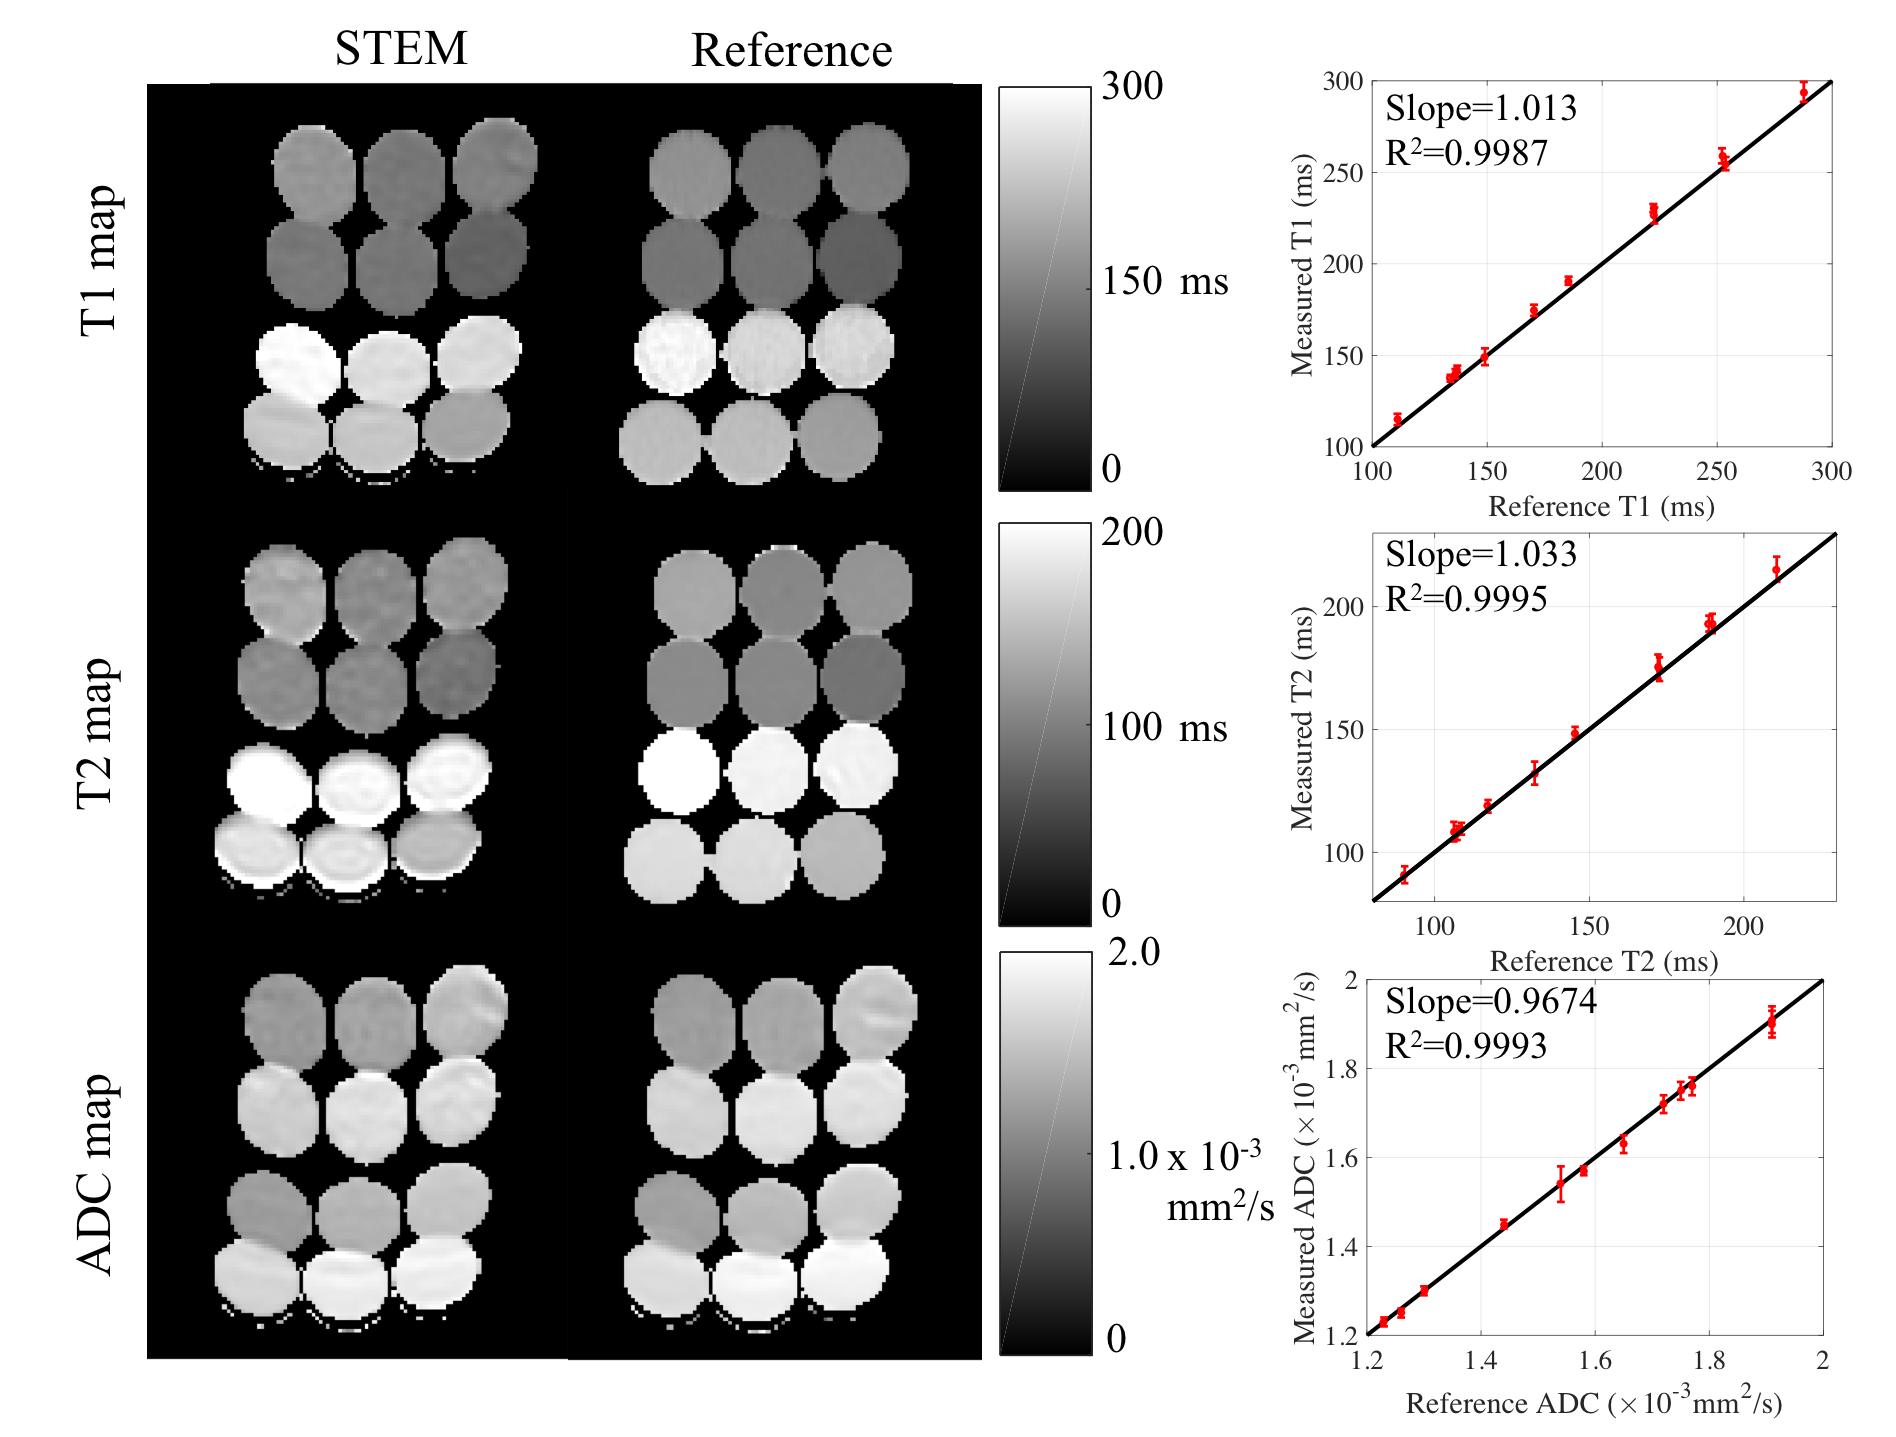
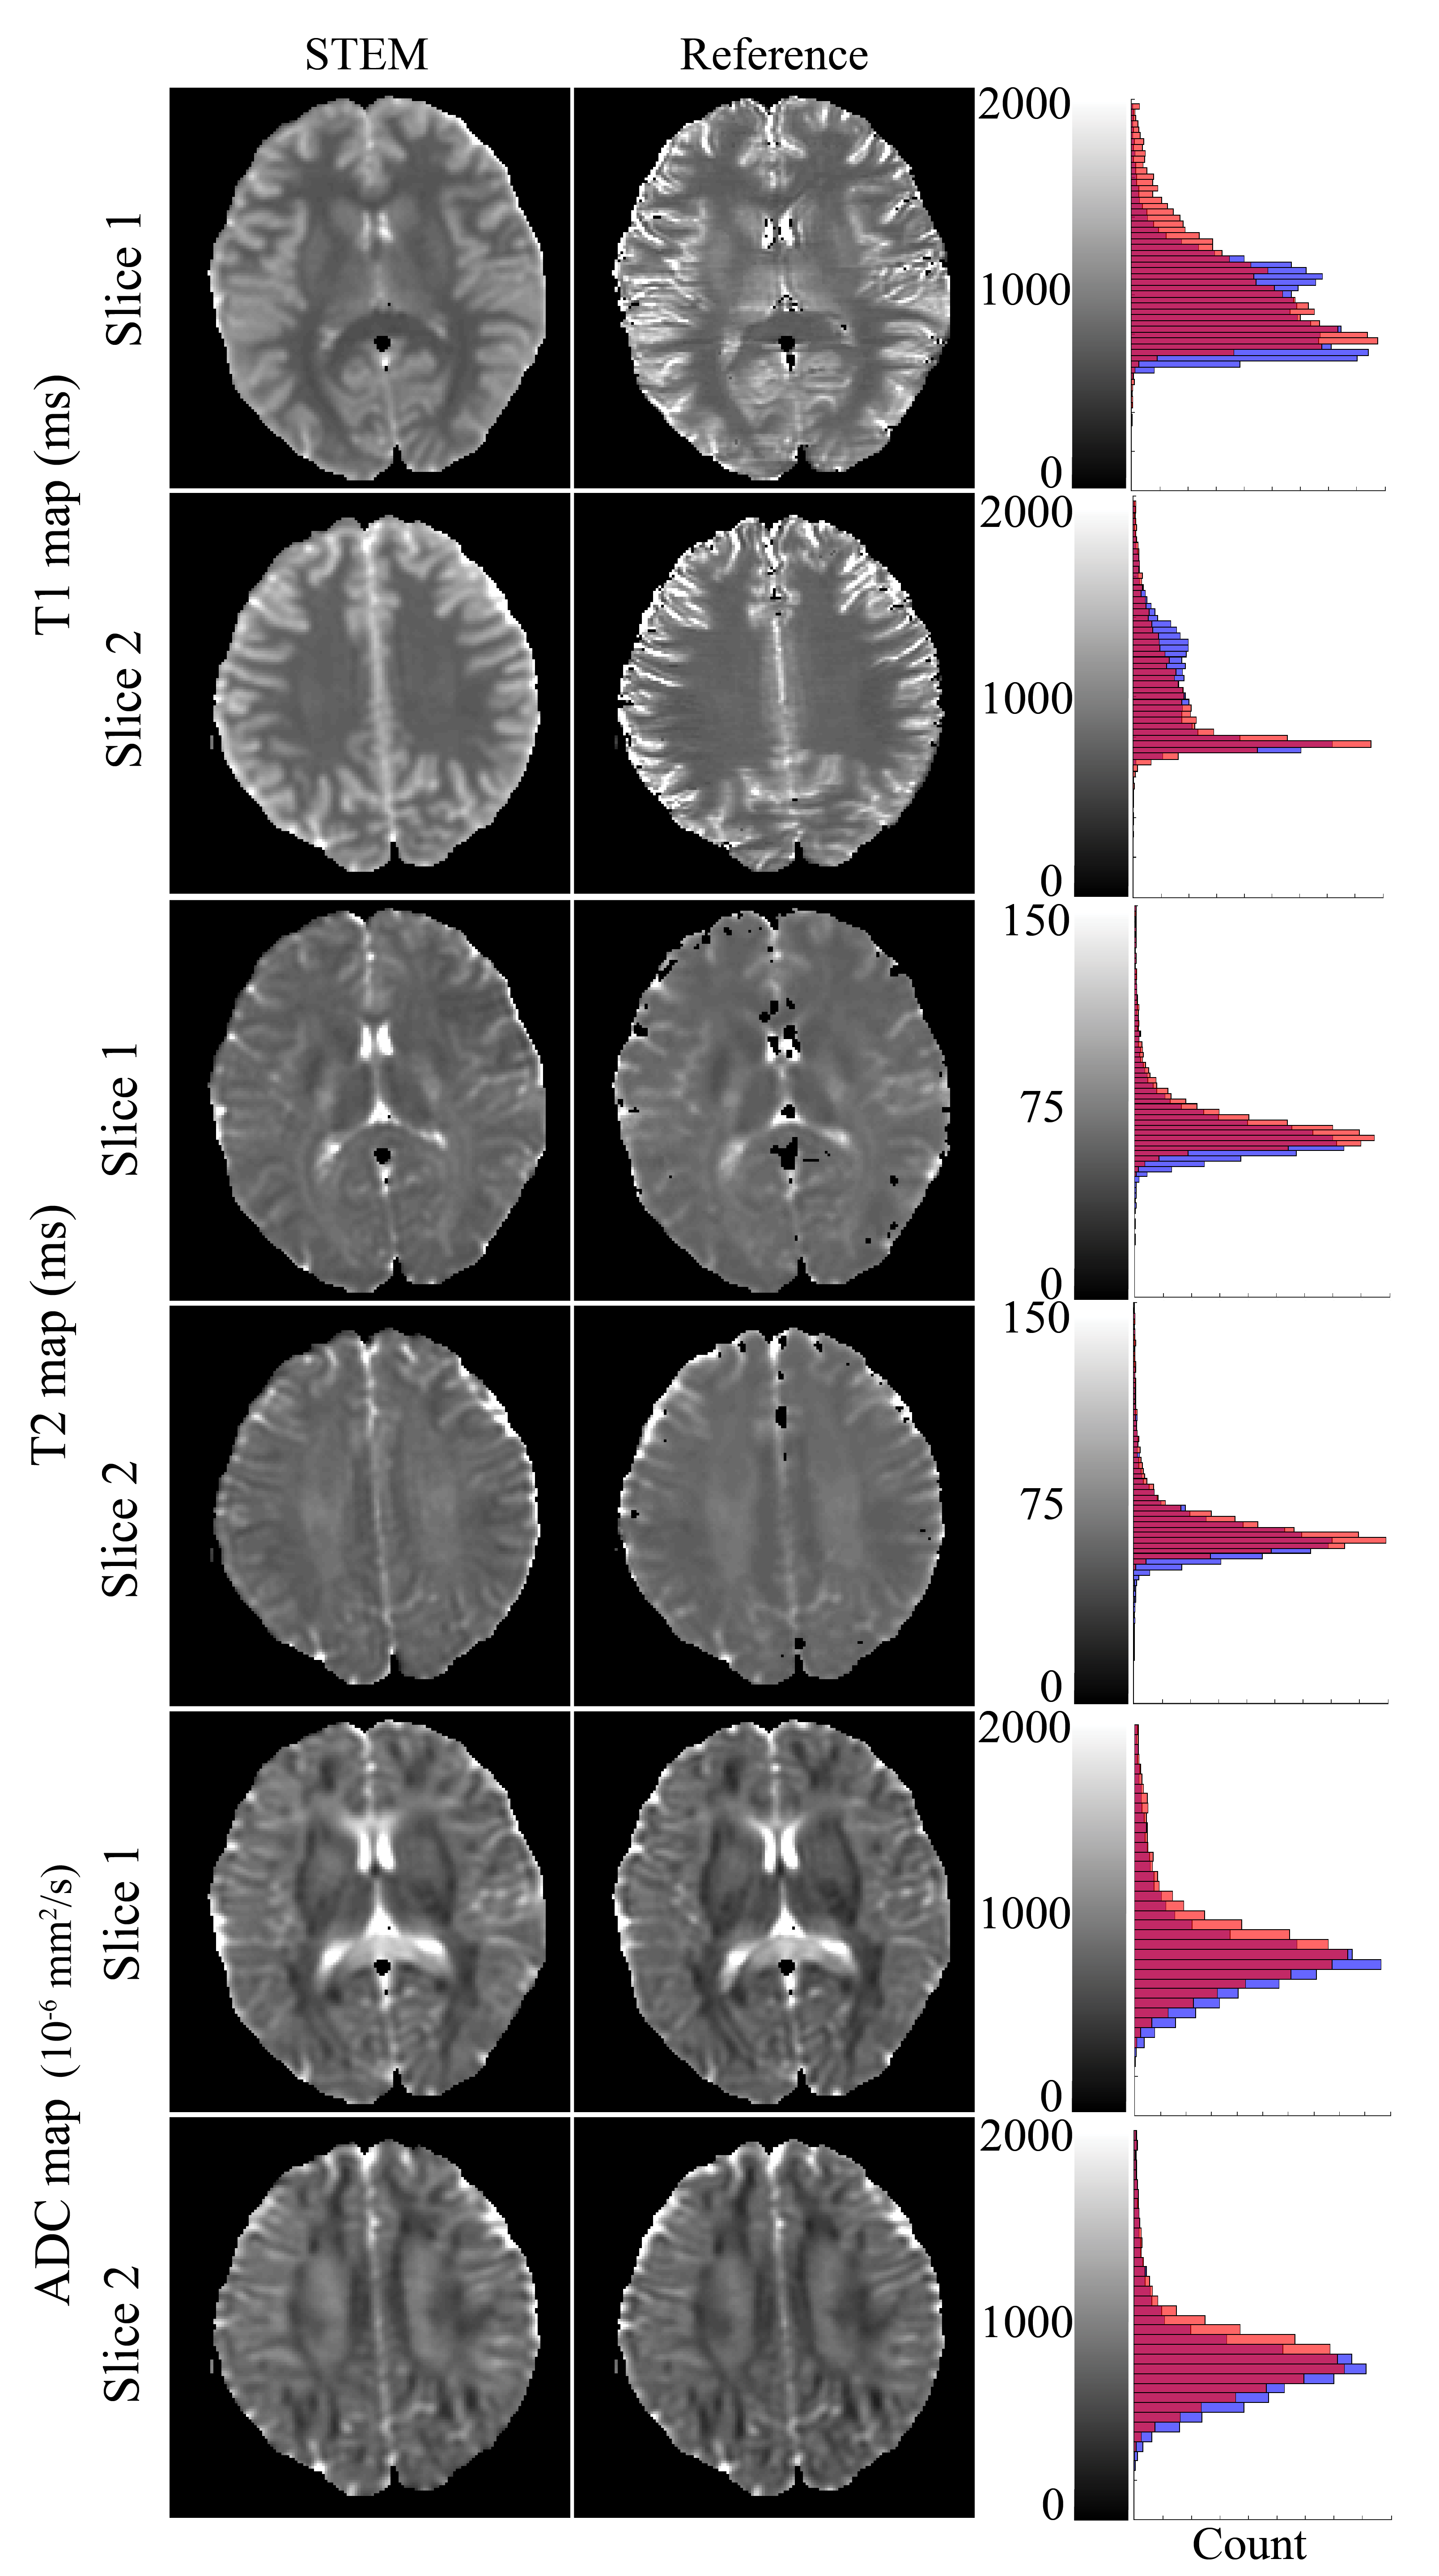
Figure 2. STEM-based T1, T2 and ADC maps in the brain are in excellent agreement with reference mapping techniques. The histograms to the right show the overall accuracy of each measurements over the entire slice. Orange bars in the histograms are from the reference maps, blue bars are measurements from STEM and the red color represents the overlapping area of orange and blue bars.
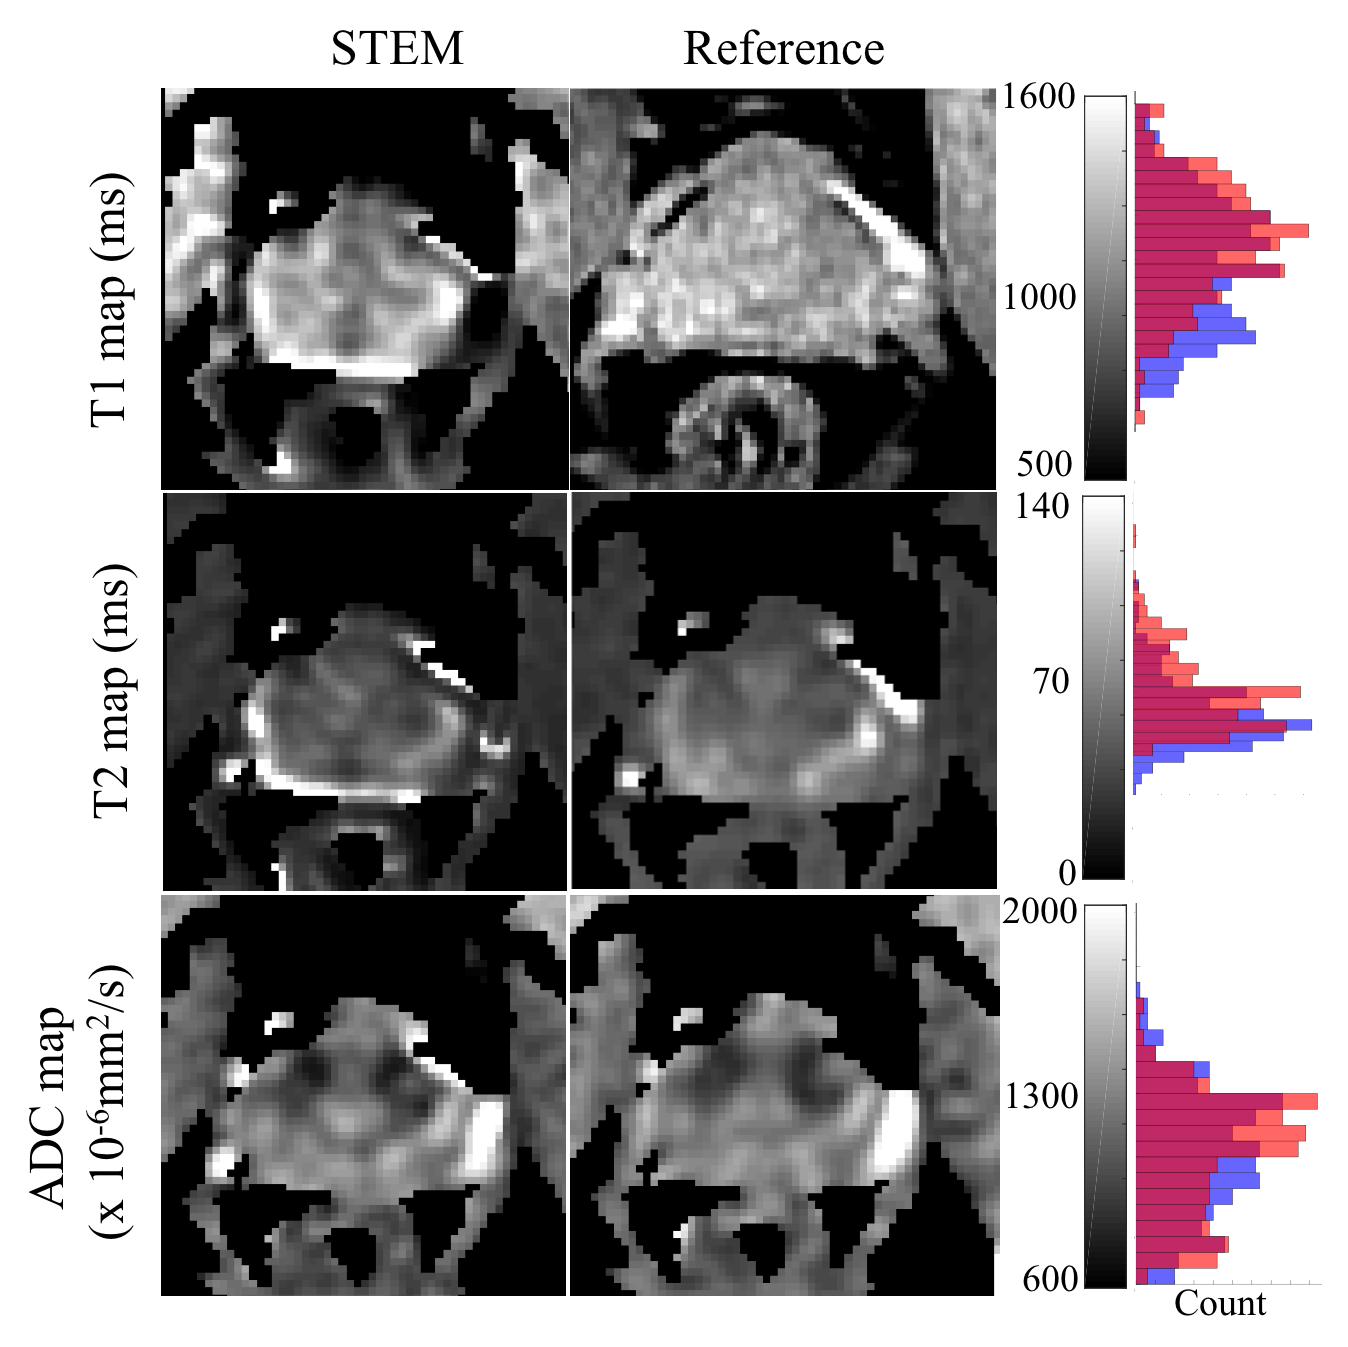
Figure 3. STEM-based T1, T2 and ADC maps in the prostate are in good agreement with reference maps, although some bias may be present in the T1 and T2 maps. Artifacts at the edge of the prostate are mainly from the inter-acquisition motion from series to series. Further, the reference T1 map from B1-corrected DESPOT1 is not exactly co-localized with the STEM image. The histograms show the overall accuracy of each map over the prostate area, where orange bars are measurements from the reference maps, blue bars are from STEM and the red color represents the overlapping area of orange and blue bars.