5635
SCOPE-T1ρ: Signal Compensation for Low-rank Plus Sparse Matrix Decomposition for Fast T1ρ Mapping1Paul C. Lauterbur Research Center for Biomedical Imaging, Shenzhen Institutes of Advanced Technology, Chinese Academy of Sciences, Shenzhen, China, 2Department of Medicine (Cardiovascular Division), Beth Israel Deaconess Medical Center and Harvard Medical School, Boston, MA, United States, 3Department of Biomedical Engineering and Department of Electrical Engineering, University at Buffalo, The State University of New York, Buffalo, NY, United States, 4Department of Imaging and Interventional Radiology, The Chinese University of Hong Kong, Hong Kong, China, 5Medical Physics and Research Department, Hong Kong Sanatorium & Hospital, Hong Kong, China
Synopsis
Quantitative T1ρ mapping typically requires the acquisition of multiple images with different spin-lock times, which greatly prolongs the scanning time, limiting its clinical applications. We developed a novel reconstruction method using a low-rank plus sparse model to obtain the parameter-weighted images from highly undersampled k-space data. This method exploited both the parameter-weighted image properties and priori information from the parameter model. Specifically, a signal compensation strategy was introduced to promote the low rankness along the parametric direction. The proposed method achieved a five-fold acceleration in the acquisition time and obtained more accurate T1ρ maps than the existing methods.
INTRODUCTION
Quantitative T1ρ mapping has recently gained attention due to its ability to assess a number of pathologies1-5.However, it requires sampling along the parametric dimension with different spin-lock times (TSLs), which greatly prolongs the scanning time, hindering its widespread use in clinical applications.
To reduce the scanning time, several reconstruction methods have been proposed 6-12. In this work, a novel image reconstruction method was developed from undersampled acquisitions with an established signal model to reduce the scan time of T1ρ mapping. First, a signal compensation strategy was developed based on the parametric model to further enforce the low rankness along the parametric direction. Second, the image matrix was decomposed as a superposition of a low-rank component and a sparse component (L+S). The final images were then reconstructed by multiplying (L+S) by the inversion of the compensation matrix.
METHODS
The L+S method13 decomposes a given matrix X as a superposition of a low-rank (LR) component and a sparse component, which is performed by solving the following convex minimization problem:$$min\parallel L\parallel_{*}+\lambda\parallel S\parallel_{1} s.t. X=L+S,E(X)=d, (1)$$
where $$$\parallel{L}\parallel_{*}$$$ is the nuclear norm of the LR matrix L; $$$\parallel{S}\parallel_{1}$$$ is the $$$l_{1}$$$-norm of the sparse matrix S; X is the image series to be reconstructed; d is the undersampled k-space data; E is the encoding function; and $$$\lambda$$$ determines the trade-off between the nuclear norm and the $$$l_{1}$$$-norm.
In T1ρ mapping, signals along TSL follow exponential decay. Theoretically, if the decayed signal could be compensated to the exactly same intensity level as the signal at the first TSL, the rank of the spatial-TSL matrix would be 1. The signal compensation is completed by multiplying the original signal by a compensation coefficient, which can be calculated by: $$Coef=\exp{({TSL}_k/{T}_{1\rho})}_{k=1,2,...,K,} (2)$$
where $$${TSL}_{k} $$$is the kth spin-lock time, and K is the TSL number.
Then, the L+S model combined with the signal compensation strategy (SCOPE-T1ρ) can be expressed as follows:$$min\parallel L\parallel_{*}+\lambda\parallel S\parallel_{1} s.t. C(X)=L+S,E(X)=d, (3)$$
where C(∙) performs pixel-wise signal compensation to the matrix represented image, and S represents the residual signals between the compensated images and the corresponding LR representation.
The iterative hard thresholding of the singular values of L and the soft thresholding of the entries of S are used to solve the optimization problem in Eq. (3) for reconstructing the parameter-weighted images. Hard thresholding for L is performed by singular-value thresholding with only the largest singular value being preserved after singular-value decomposition (SVD). In each iteration, data consistency is enforced by $$$L_{j}+S_{j}-C(E^*(EC^{-1}(L_{j}+S_{j})-d))$$$, where C-1(∙) indicates dividing the image matrix by the compensation coefficient in Eq. (2) pixel by pixel, and E* is the adjoint operation of E. T1ρ maps are generated by fitting the reconstructed T1ρ-weighted images pixel by pixel12.
RESULTS
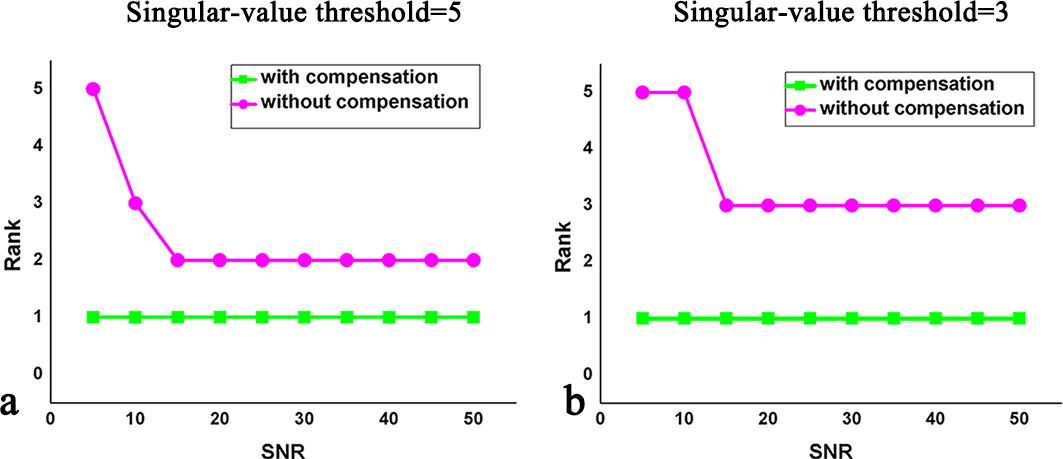
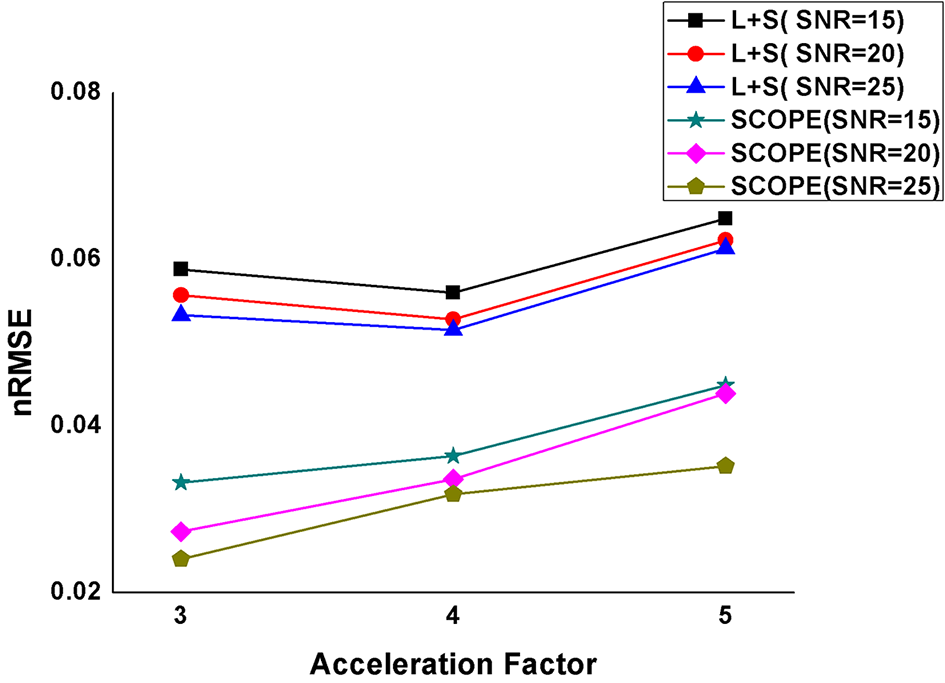
The proposed method was evaluated using both phantom and human brain datasets. The phantom was simulated using the method in Ref. 12. The ranks of images at different signal-to-noise ratios (SNRs) in the spatial-TSL domain with and without signal compensation were compared. The rank value was calculated using the SVD method with a fixed singular-value threshold. A Monte-Carlo simulation was performed 1000 times for each SNR to reduce the bias of noise on the rank value. The ranks without compensation were found to be higher than those obtained using signal compensation (Figure1 a-b). Additionally, the normalized root mean square error (nRMSE)12 was calculated with SNR=15, 20 and 25. The nRMSE of the SCOPE-T1ρ method was much smaller than that of the L+S method at the same acceleration factor and SNR (Figure 2) .
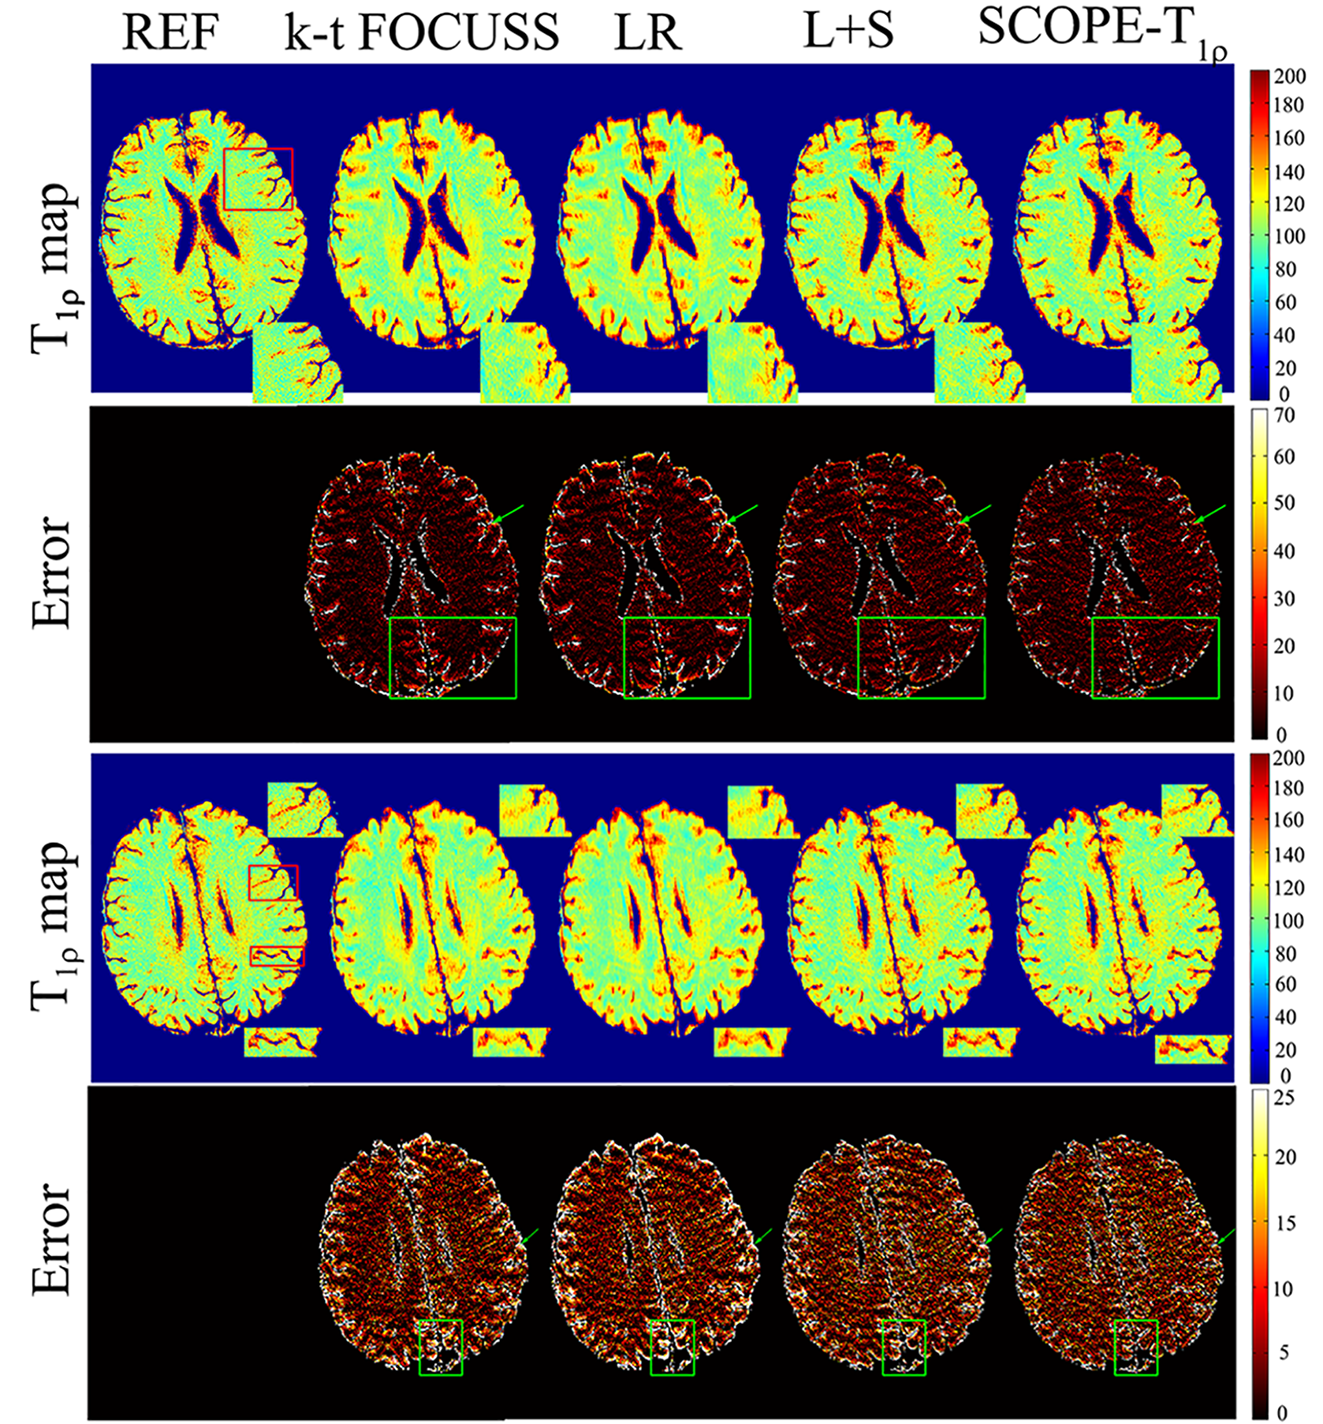
In the in vivo experiment, the acquired k-space data12 were retrospectively undersampled with the variable density undersampling scheme14. The T1ρ-weighted images were reconstructed by the k-t FOCUSS15, LR9, L+S and SCOPE-T1ρ methods. The reference map was obtained from the fully sampled k-space data.The SCOPE-T1ρ method reduced the aliasing artifacts and recovered small structures compared with the other three methods (Figure 3).
DISCUSSION
The signal compensation strategy improves the low rankness of the image matrix and guarantees that the rank within the spatial-parameter domain is 1. It serves as a hard constraint to enforce the consistency between the reconstructed images and the used signal model, and it also reduces the sensitivity of the rank parameter selection with the traditional LR-based methods. The proposed method can be extended to other model-based imaging methods, such as T1, T2 mapping, diffusion tensor imaging, etc., as long as the model can be explicitly formularized.CONCLUSION
SCOPE-T1ρ significantly reduces the scanning time of T1ρ mapping while remaining high accuracy. This technique might help facilitate fast T1ρ mapping in clinical use.Acknowledgements
This work is supported in part by the National Natural Science Foundation of China under grant nos. 61401449, 61471350 and 61771463.References
- Allkemper T, Sagmeister F, Cicinnati V, Beckebaum S, Kooijman H, Kanthak C, Stehling C, Heindel W. Evaluation of fibrotic liver disease with whole-liver T1ρ MR imaging: a feasibility study at 1.5 T. Radiology 2014;271(2):408-415.
- Haris M, McArdle E, Fenty M, Singh A, Davatzikos C, Trojanowski JQ, Melhem ER, Clark CM, Borthakur A. Early marker for Alzheimer's disease: hippocampus T1rho (T1ρ) estimation. J Magn Reson Imaging 2009;29(5):1008-1012.
- Li YT, Huang H, Zhuo Z, Lu PX, Chen W, Wang YXJ. Bi-phase age-related brain gray matter magnetic resonance T1ρ relaxation time change in adults. Magn Reson Imaging 2017;39:200-205.
- Duvvuri U, Charagundla SR, Kudchodkar SB, Kaufman JH, Kneeland JB, Rizi R, Leigh JS, Reddy R. Human knee: in vivo T1ρ-weighted MR imaging at 1.5 T--preliminary experience. Radiology 2001;220(3):822-826.
- Regatte RR, Akella SV, Lonner JH, Kneeland JB, Reddy R. T1ρ relaxation mapping in human osteoarthritis (OA) cartilage: comparison of T1ρ with T2. J Magn Reson Imaging 2006;23(4):547-553.
- Pruessmann KP, Weiger M, Scheidegger MB, Boesiger P. SENSE: sensitivity encoding for fast MRI. Magn Reson Med 1999;42(5):952-962.
- Griswold MA, Jakob PM, Heidemann RM, Nittka M, Jellus V, Wang J, Kiefer B, Haase A. Generalized autocalibrating partially parallel acquisitions (GRAPPA). Magn Reson Med 2002;47(6):1202-1210.
- Zhou Y, Pandit P, Pedoia V, Rivoire J, Wang Y, Liang D, Li X, Ying L. Accelerating T1ρ cartilage imaging using compressed sensing with iterative locally adapted support detection and JSENSE. Magn Reson Med 2016;75(4):1617-1629.
- Zhang T, Pauly JM, Levesque IR. Accelerating parameter mapping with a locally low rank constraint. Magn Reson Med 2015;73(2):655-661.
- Petzschner FH, Ponce IP, Blaimer M, Jakob PM, Breuer FA. Fast MR parameter mapping using k-t principal component analysis. Magn Reson Med 2011;66(3):706-716.
- Velikina JV, Alexander AL, Samsonov A. Accelerating MR parameter mapping using sparsity-promoting regularization in parametric dimension. Magn Reson Med 2013;70(5):1263-1273.
- Zhu Y, Zhang Q, Liu Q, Wang YX, Liu X, Zheng H, Liang D, Yuan J. PANDA-T1ρ: Integrating principal component analysis and dictionary learning for fast T1ρ mapping. Magn Reson Med 2015;73(1):263-272.
- Otazo R, Candes E, Sodickson DK. Low-rank plus sparse matrix decomposition for accelerated dynamic MRI with separation of background and dynamic components. Magn Reson Med 2015;73(3):1125-1136.
- Doneva M, Bornert P, Eggers H, Stehning C, Senegas J, Mertins A. Compressed sensing reconstruction for magnetic resonance parameter mapping. Magn Reson Med 2010;64(4):1114-1120.
- Jung H, Sung K, Nayak KS, Kim EY, Ye JC. k-t FOCUSS: a general compressed sensing framework for high resolution dynamic MRI. Magn Reson Med 2009;61(1):103-116.
Figures