5632
Validation of a quantitative susceptibility mapping acquisition and reconstruction pipeline using a new iron sucrose based MR susceptibility phantom.1Neuroradiology, I2FH - CHU Gui de Chauliac, Montpellier, France, 2CNRS UMR 5221, université Montpellier, Laboratoire Charles-Coulomb, Montpellier, France
Synopsis
Quantitative susceptibility mapping (QSM) is a new technique, and it has been shown that results can vary according to the MRI device, phase reconstruction, and susceptibility estimation algorithms. Porting this mapping on the clinical practice would be of interest in numerous kind of pathology. However, it requires a validation which should be performed using a dedicated MR phantom. We described an easy to build MR susceptibility phantom based on iron sucrose. Using optimal parameters, the quantitative susceptibility mapping provides a very good estimation of the iron concentrations in the phantom.
INTRODUCTION
Quantitative susceptibility mapping (QSM) is a new technique, and it has been shown that results can vary according to the MRI device, phase reconstruction, and susceptibility estimation algorithms1. Porting this mapping on the clinical practice would be of interest in numerous kind of pathology2,3. However, it requires a validation which should be performed using a dedicated MR phantom4. Ferumoxytol as been previously used for this pupose. Unfortunately, it is not widely available, we therefore propose to describe a methodology to build an alternative susceptibility phantom and test its validity. We will also investigate the effect of the orientation on the estimated susceptibility. The aim of our study is to provide a phantom which can be used to validate and optimized the sequences and the processing pipeline.
METHODS
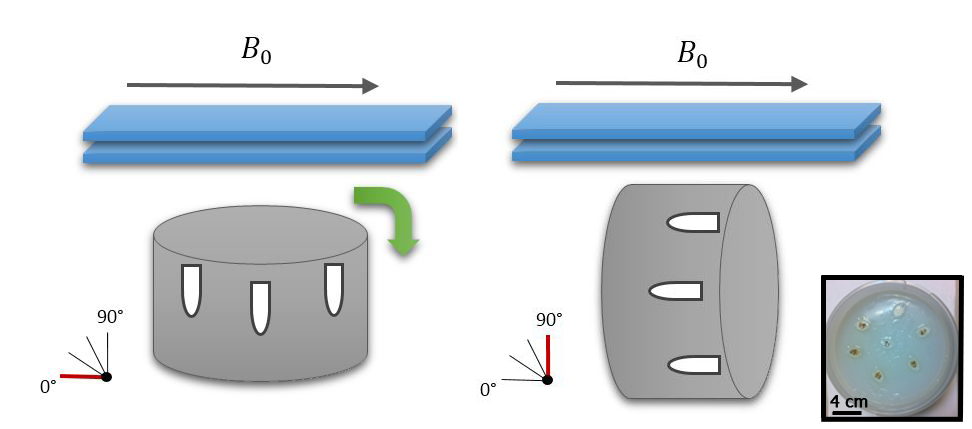
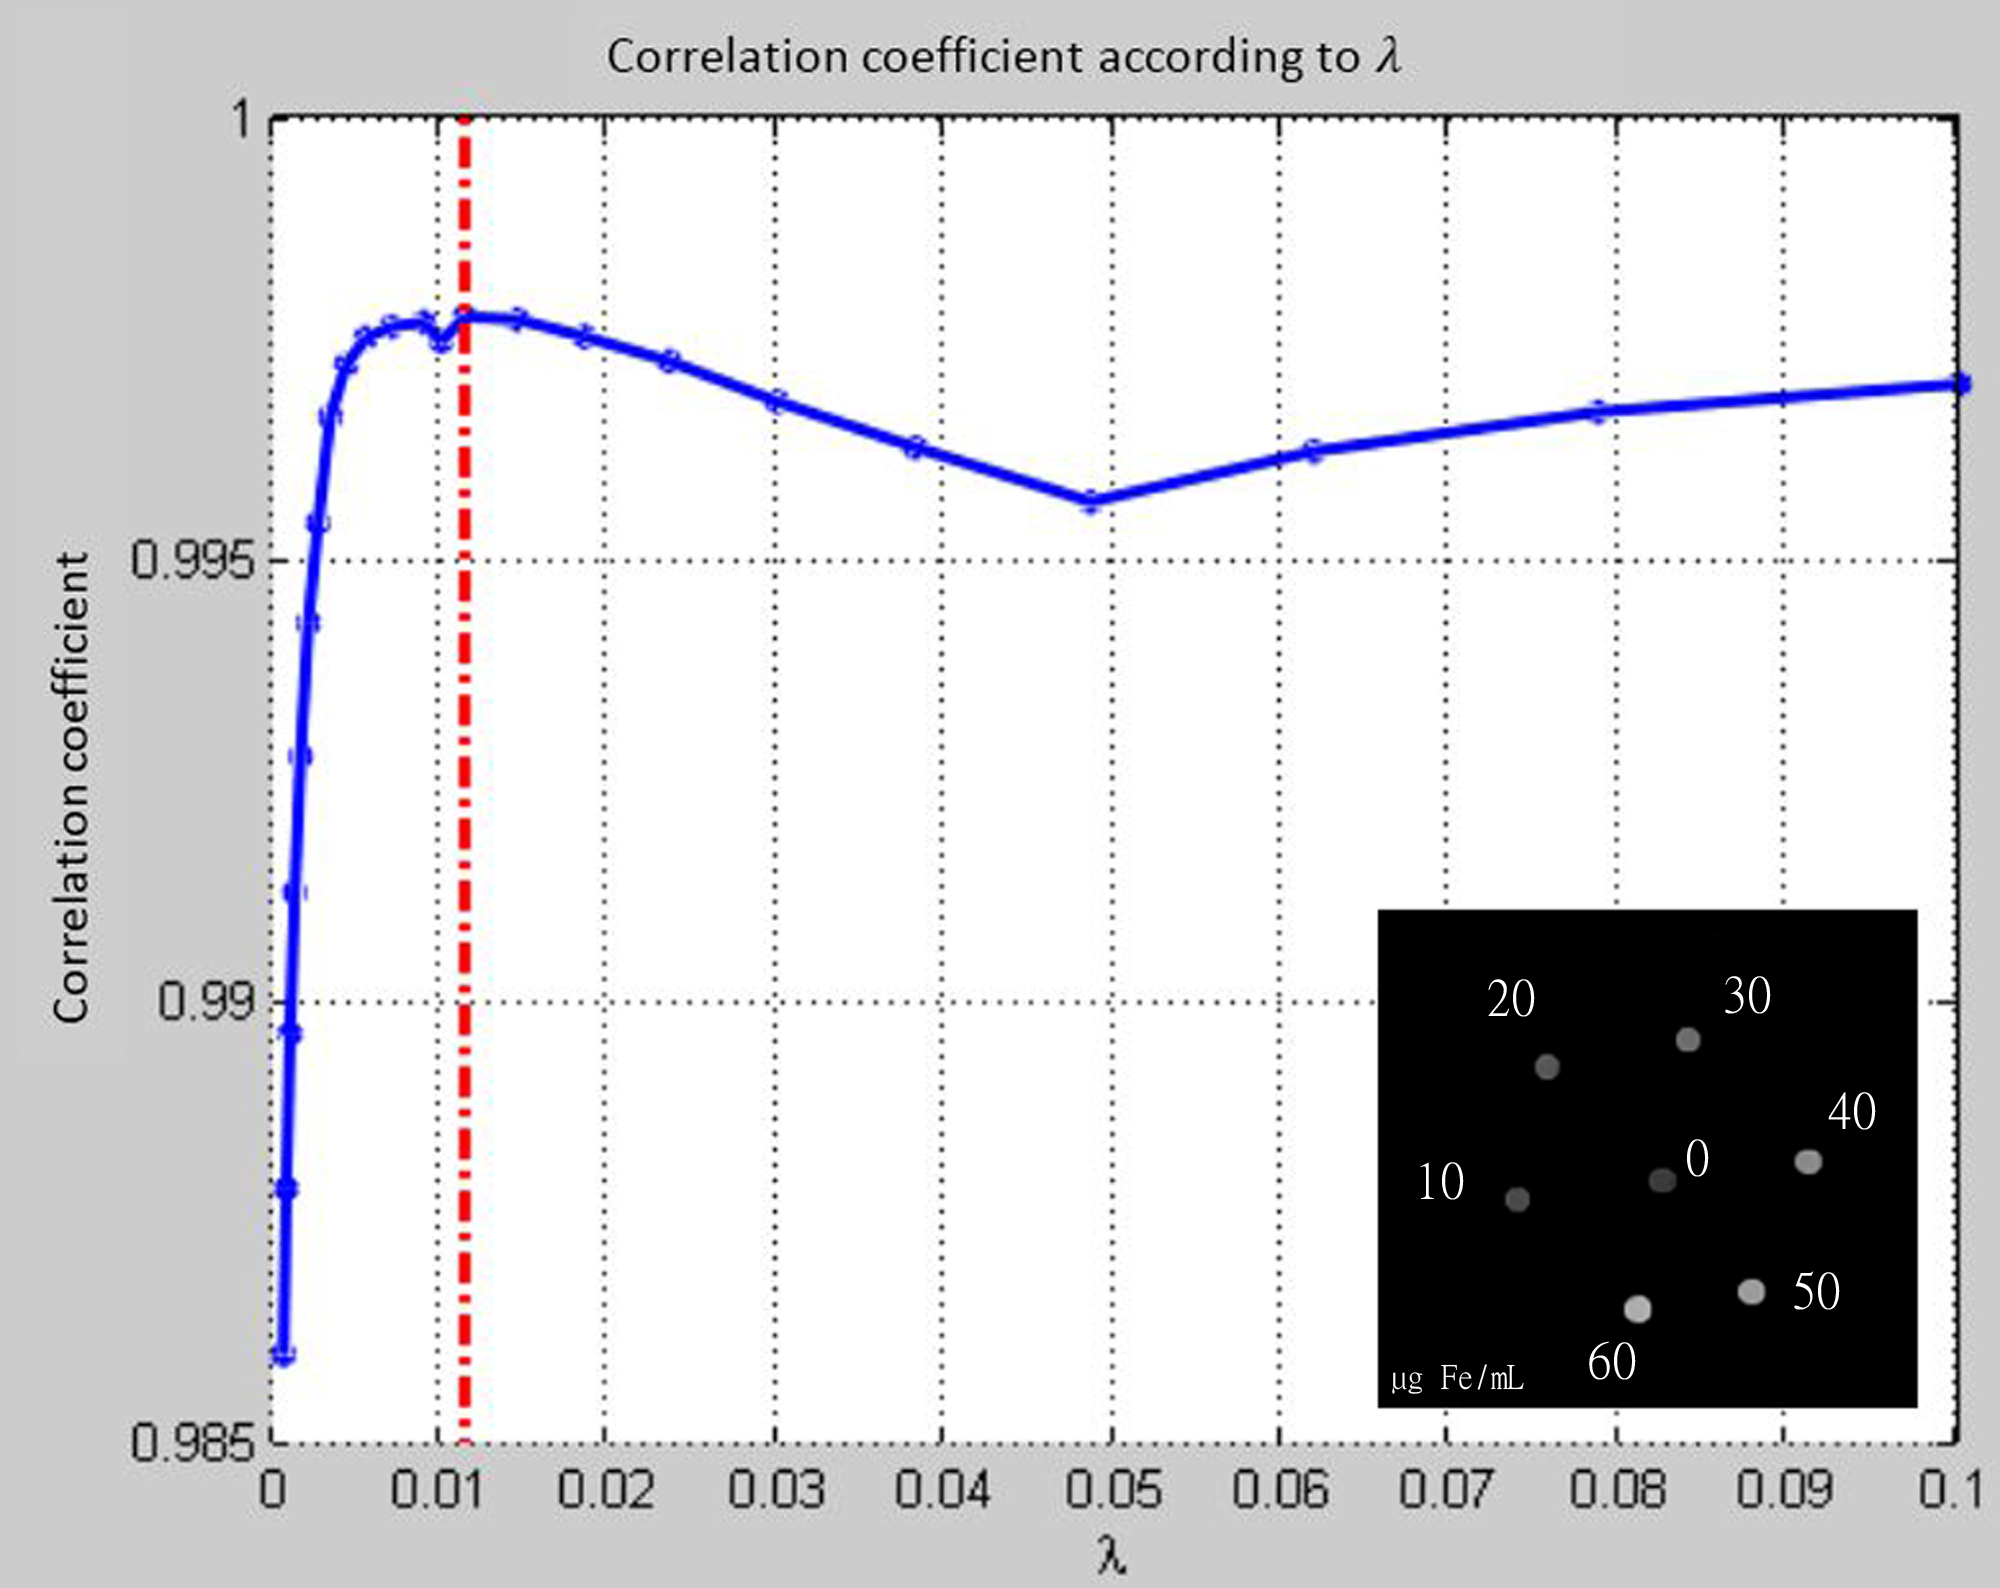
In a plastic container, Eppendorf tubes containing increasing iron sucrose concentration ranging from 0 to 60μg Fe/mL were inserted in an agarose gel. To estimate susceptibility, multiple coronal gradient echo acquisitions were performed with the parameters: FA=15°, readout FoV=220 mm, phase FoV=91.1%, TE1/TE2/TE3/TR=15/30/45/52 ms, iPat=2, resolution = 1.0x1.0x1.5 mm3, with varying angle of the phantom relative to the B0 field, ranging from 0 to 90° (Figure 1). Phase and magnitude images from each coil element were extracted from the raw data using the Siemens ICE Framework (Siemens, Erlangen, Germany) and combined using a sensitivity based approach5. An in-house toolbox was used to calculate quantitative susceptibility maps from phase images. First, the phase images are unwrapped using a laplacian unwrapping6, the internal field map is estimated using a regularization enabled SHARP (RESHARP) algorithm7 and finally, quantitative susceptibility map is generated using the total variation using Split Bregman (TVSB) method with l1-norm and l2-norm8,9. Iron concentration was finally estimated from the susceptibility in the tubes.
RESULTS
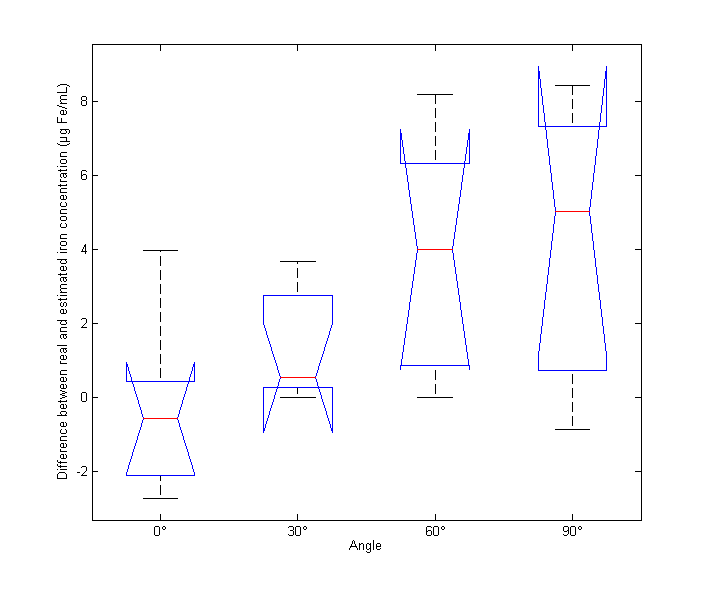
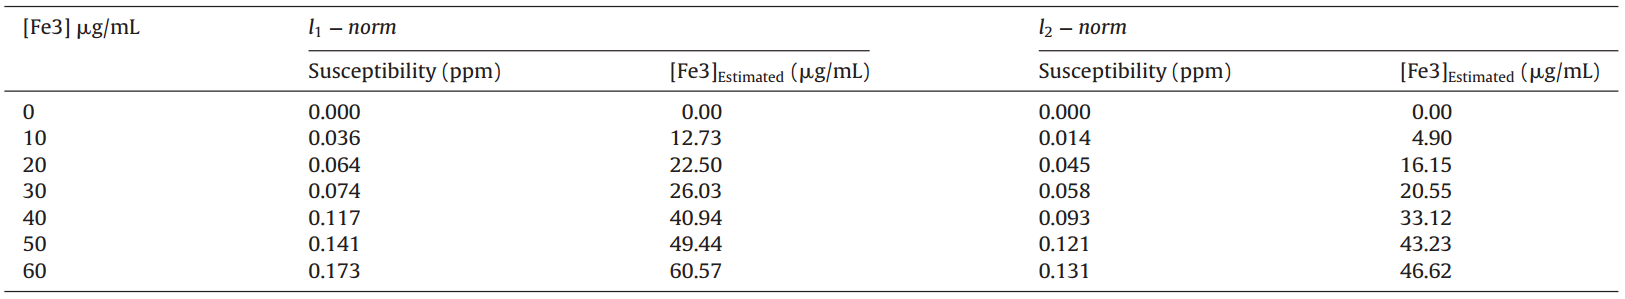
In l1 norm susceptibility and estimated iron concentration in each tube were extracted (Figure 2 and Table 1). Estimated iron concentrations based on susceptibility values were not statistically different from real values (p = 0.56, bilateral paired Wilcoxon). In l2 norm, while estimated values were still strongly correlated to real concentration (p = 4. 10-6, rho=0.99, Pearson correlation), the concentration values were underestimated (see Figure 4; p=0.015, unilateral paired Wilcoxon). The orientation of the phantom significatively affects the susceptibility estimation (p = 0.03, Kruskal-Wallis) (Figure 3). There is a correlation between the angle of the phantom and the difference between real and estimated iron concentrations (p = 0.0008, rho=0.64, slope = 0.0147, Pearson correlation).DISCUSSION
Results on the phantom validate the estimation of the susceptibility using our processing pipeline and our MR system by providing a correct estimation of the iron concentration in our tubes. Bilgic et al.8 highlighted the importance of the identification of the optimal values in obtaining a correct susceptibility map. While previous studies already established the validation of the susceptibility estimation from the TSVB method8,9 on post mortem data, we confirmed those results on a fully controlled phantom.
Susceptibility can be estimated quickly using the l2-norm with the TVSB approach9. However we showed that this norm underestimate the real susceptibility probably due to an inherent smoothing of the map.
Concerning orientation effects, the ringing artifacts due to the reconstruction vary according to the inclination angle, leading to misestimation of the susceptibility. When the tubes are placed parallel to B0, the susceptibility estimation become significantly different from the 0° reference.
CONCLUSION
We described here an easy to build MR susceptibility phantom. We provided the complete methodology required to use it as a validation of a MR system and the processing pipeline. We believe that this validation should be done before any susceptibility acquisition with new system or processing.Acknowledgements
No acknowledgement found.References
1. Y. Wang and T. Liu, “Quantitative susceptibility mapping (QSM): Decoding MRI data for a tissue magnetic biomarker,” Magn. Reson. Med., vol. 73, no. 1, pp. 82–101, 2015.
2. C. Carra-Dalliere et al., “Use of quantitative susceptibility mapping (QSM) in progressive multifocal leukoencephalopathy,” J. Neuroradiol. J. Neuroradiol., vol. 43, no. 1, pp. 6–10, Feb. 2016.
3. C. Dargazanli et al., “Quantitative susceptibility mapping in superficial hemosiderosis of the central nervous system,” J. Neuroradiol. J. Neuroradiol., vol. 42, no. 6, pp. 370–372, Dec. 2015.
4. R. R. Price et al., “Quality assurance methods and phantoms for magnetic resonance imaging: Report of AAPM nuclear magnetic resonance Task Group No. 1,” Med. Phys., vol. 17, no. 2, pp. 287–295, Mar. 1990.
5. C. Ros, S. Witoszynskyj, K.-H. Herrmann, and J. R. Reichenbach, “Reconstruction of phase images for GRAPPA accelerated Magnetic Resonance Imaging,” in 4th European Conference of the International Federation for Medical and Biological Engineering, J. V. Sloten, P. Verdonck, M. Nyssen, and J. Haueisen, Eds. Springer Berlin Heidelberg, 2009, pp. 803–806.
6. M. A. Schofield and Y. Zhu, “Fast phase unwrapping algorithm for interferometric applications,” Opt. Lett., vol. 28, no. 14, pp. 1194–1196, juillet 2003.
7. H. Sun and A. H. Wilman, “Background field removal using spherical mean value filtering and Tikhonov regularization,” Magn. Reson. Med. Off. J. Soc. Magn. Reson. Med. Soc. Magn. Reson. Med., May 2013.
8. B. Bilgic, A. Pfefferbaum, T. Rohlfing, E. V. Sullivan, and E. Adalsteinsson, “MRI estimates of brain iron concentration in normal aging using quantitative susceptibility mapping,” NeuroImage, vol. 59, no. 3, pp. 2625–2635, Feb. 2012.
9. B. Bilgic et al., “Fast quantitative susceptibility mapping with L1-regularization and automatic parameter selection,” Magn. Reson. Med. Off. J. Soc. Magn. Reson. Med. Soc. Magn. Reson. Med., vol. 72, no. 5, pp. 1444–1459, Nov. 2014.
Figures