5631
Robust PD mapping using multi-contrast variable flip angle (VFA) data1Great Ormond Street Institute of Child Health, UCL, London, United Kingdom, 2Wellcome Trust Centre for Neuroimaging, UCL, London, United Kingdom, 3Department of Radiology, Great Ormond Street Hospital, London, United Kingdom, 4LREN, University of Lausanne, Dept. of clinical neurosciences, CHUV, Lausanne, Switzerland, 5Department of Neurophysics, Max Planck Institute for Human Cognitive and Brain Sciences, Leipzig, Germany
Synopsis
Proton density (PD) maps measure the amount of free water molecules in the tissue and can be used in a range of neurological disorders. However, current PD estimation methods in the brain rely on anatomical prior information which can be problematic in the case of severe tissue abnormalities. Here we propose a new approach for PD mapping based on a multi-contrast acquisition protocol, and a data-driven estimation method for inhomogeneity correction and map scaling. This approach can be applied on ex-vivo samples and in case of pronounced brain pathology because it does not require any anatomical nor tissue information.
Introduction
MR proton density (PD) mapping quantifies the amount of free water protons1,2, which is crucial for measuring water volume fraction employed in tissue composition models3. Previous studies demonstrated that brain PD maps help lesion detection in multiple sclerosis4, hepatic encephalopathy5 and peritumoral oedema6.
Typically PD maps are calculated from gradient-echo images using knowledge of relaxation effects, receiver sensitivity profile (RP), spatially invariant scaling factor (C) and transmitted radio-frequency field (B1+)7. At 3T, the RP is typically indirectly estimated1 due to inaccuracies in its direct measurement1,8.
RP estimation is performed using image processing techniques such as SPM9, or exploiting the relationship between T1 and PD values8, while the scaling factor (C) is derived from signals within tissue compartments8,9. However, both of these processes can be inaccurate in pathology8.
Here we propose a new approach for PD mapping based on a multi-contrast VFA acquisition protocol9. We correct the signal for relaxation effects, employ a non-parametric algorithm for the RP estimation, and use the signal of an external calibration object to derive an accurate scaling factor. This approach is independent from anatomical information and is demonstrated on an ex-vivo sample.
Method
10 healthy subjects (32 ± 5years) were scanned (3T Siemens Prisma/64 channel receive coil). A plastic tube filled with a Gd solution (0.09mg/ml) was placed next to the subjects head for calibration purposes10. Three 3D multi-echo FLASH datasets with predominant PD-,T1- and MT-weighting (PDw,T1w,MTw) were acquired (1mm3 resolution), and B1+ maps were used to correct for transmit inhomogeneities9,11.For acquisition details see Lorio et al12.
PD maps were estimated using our new multi-contrast approach and effective PD (PD*)9,13 method, which utilizes data uncorrected for R2* relaxation and RP estimation based on SPM12 segmentation.
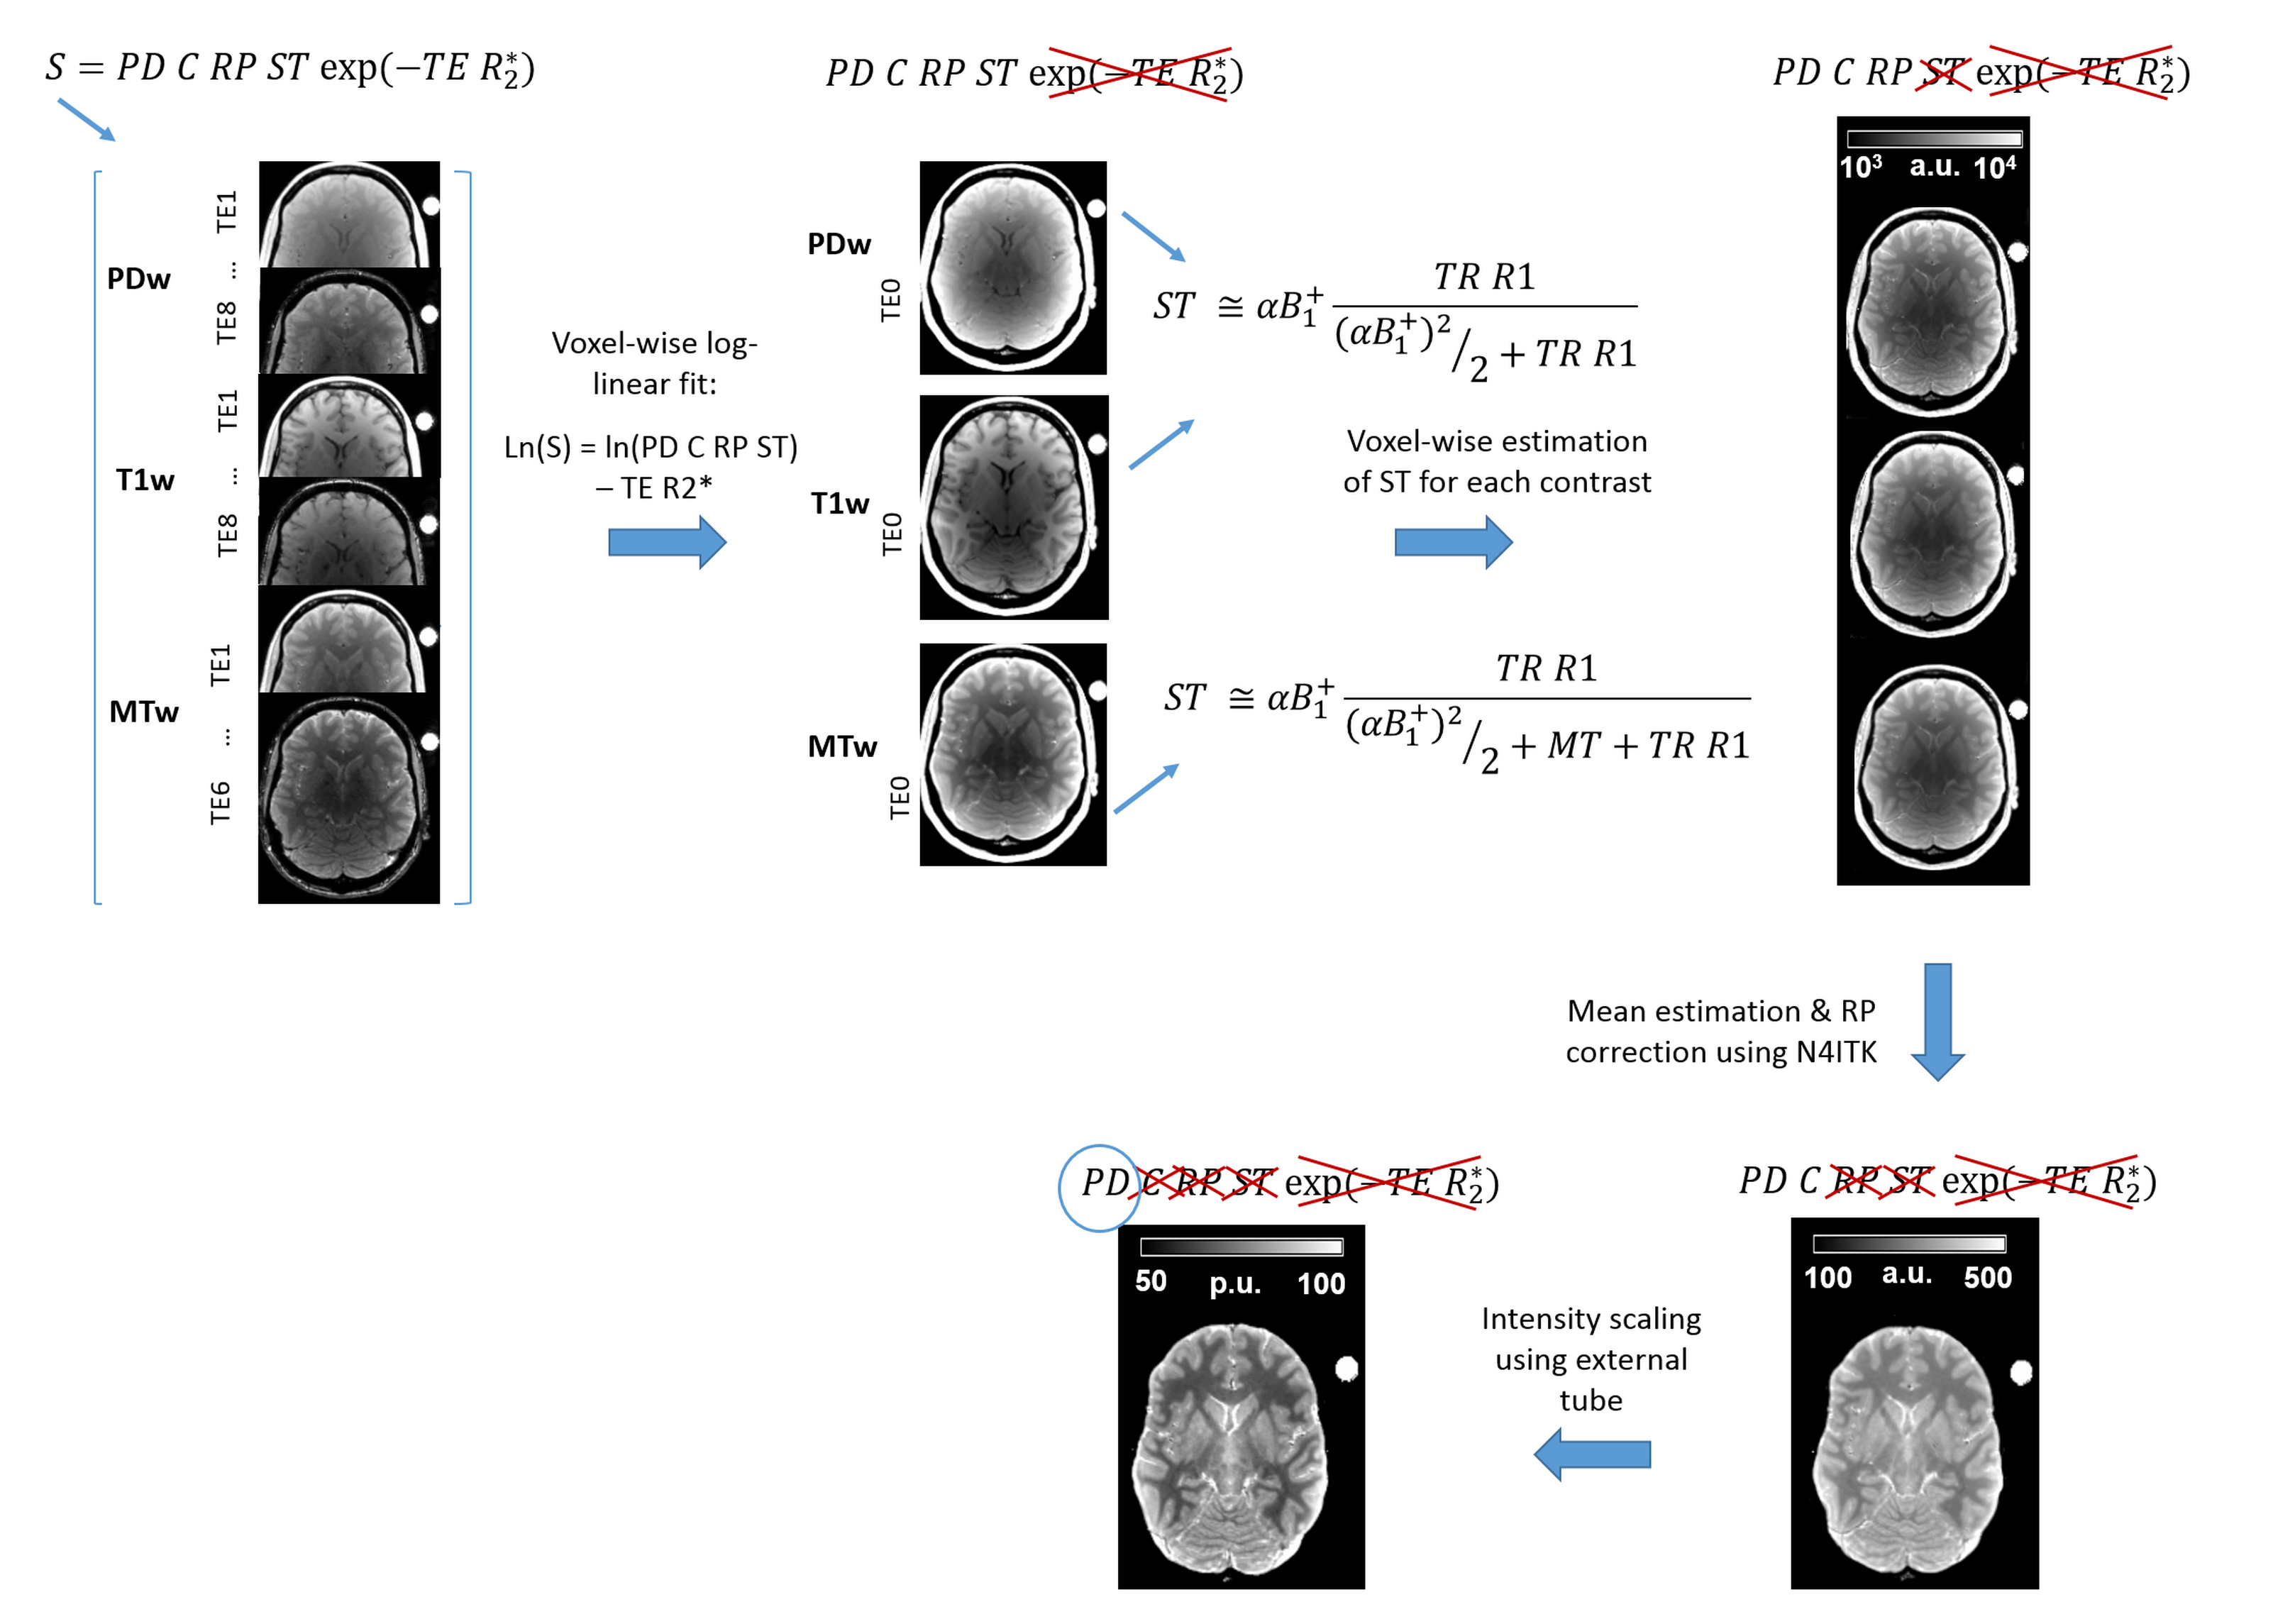
To correct for R2* relaxation, all multi-contrast echo points were combined and a voxel-wise log-linear fit was used to extrapolate the TE=0 signal for PDw,T1w and MTw datasets14. Then each contrast was corrected for steady state (ST) term using previously calculated R1 and MT maps9,15, see Figure1. RP was determined from the corrected data applying a non-parametric bias estimation provided by N4ITK16. The final maps were scaled by the median intensity of the plastic tube filled with Gd solution in order to obtain PD values between 0 and 100%.
To assess the intensity homogeneity of multi-contrast PD and PD*, we estimated signal entropy and variance within cerebro-spinal fluid (CSF), white matter (WM) and grey matter (GM) separately. Subject-specific tissue masks were derived from tissue probability maps (voxels with p>0.9) estimated from MT using SPM12. Wilcoxon test was applied to compare the entropy and variance across PD estimation methods within tissue class, statistical significance was set to p<0.05.
Voxel-wise comparison of PD and PD* maps was performed after normalisation to MNI space using subject-specific diffeomorphic estimates and tissue-specific smoothing with isotropic Gaussian kernel (6mm), as implemented in SPM12. T-value maps were obtained using paired t-test with threshold at p<0.05 after family-wise error correction.
The new multi-contrast approach for PD estimation was also applied on a post-mortem foetus dataset acquired with the same settings.
Results
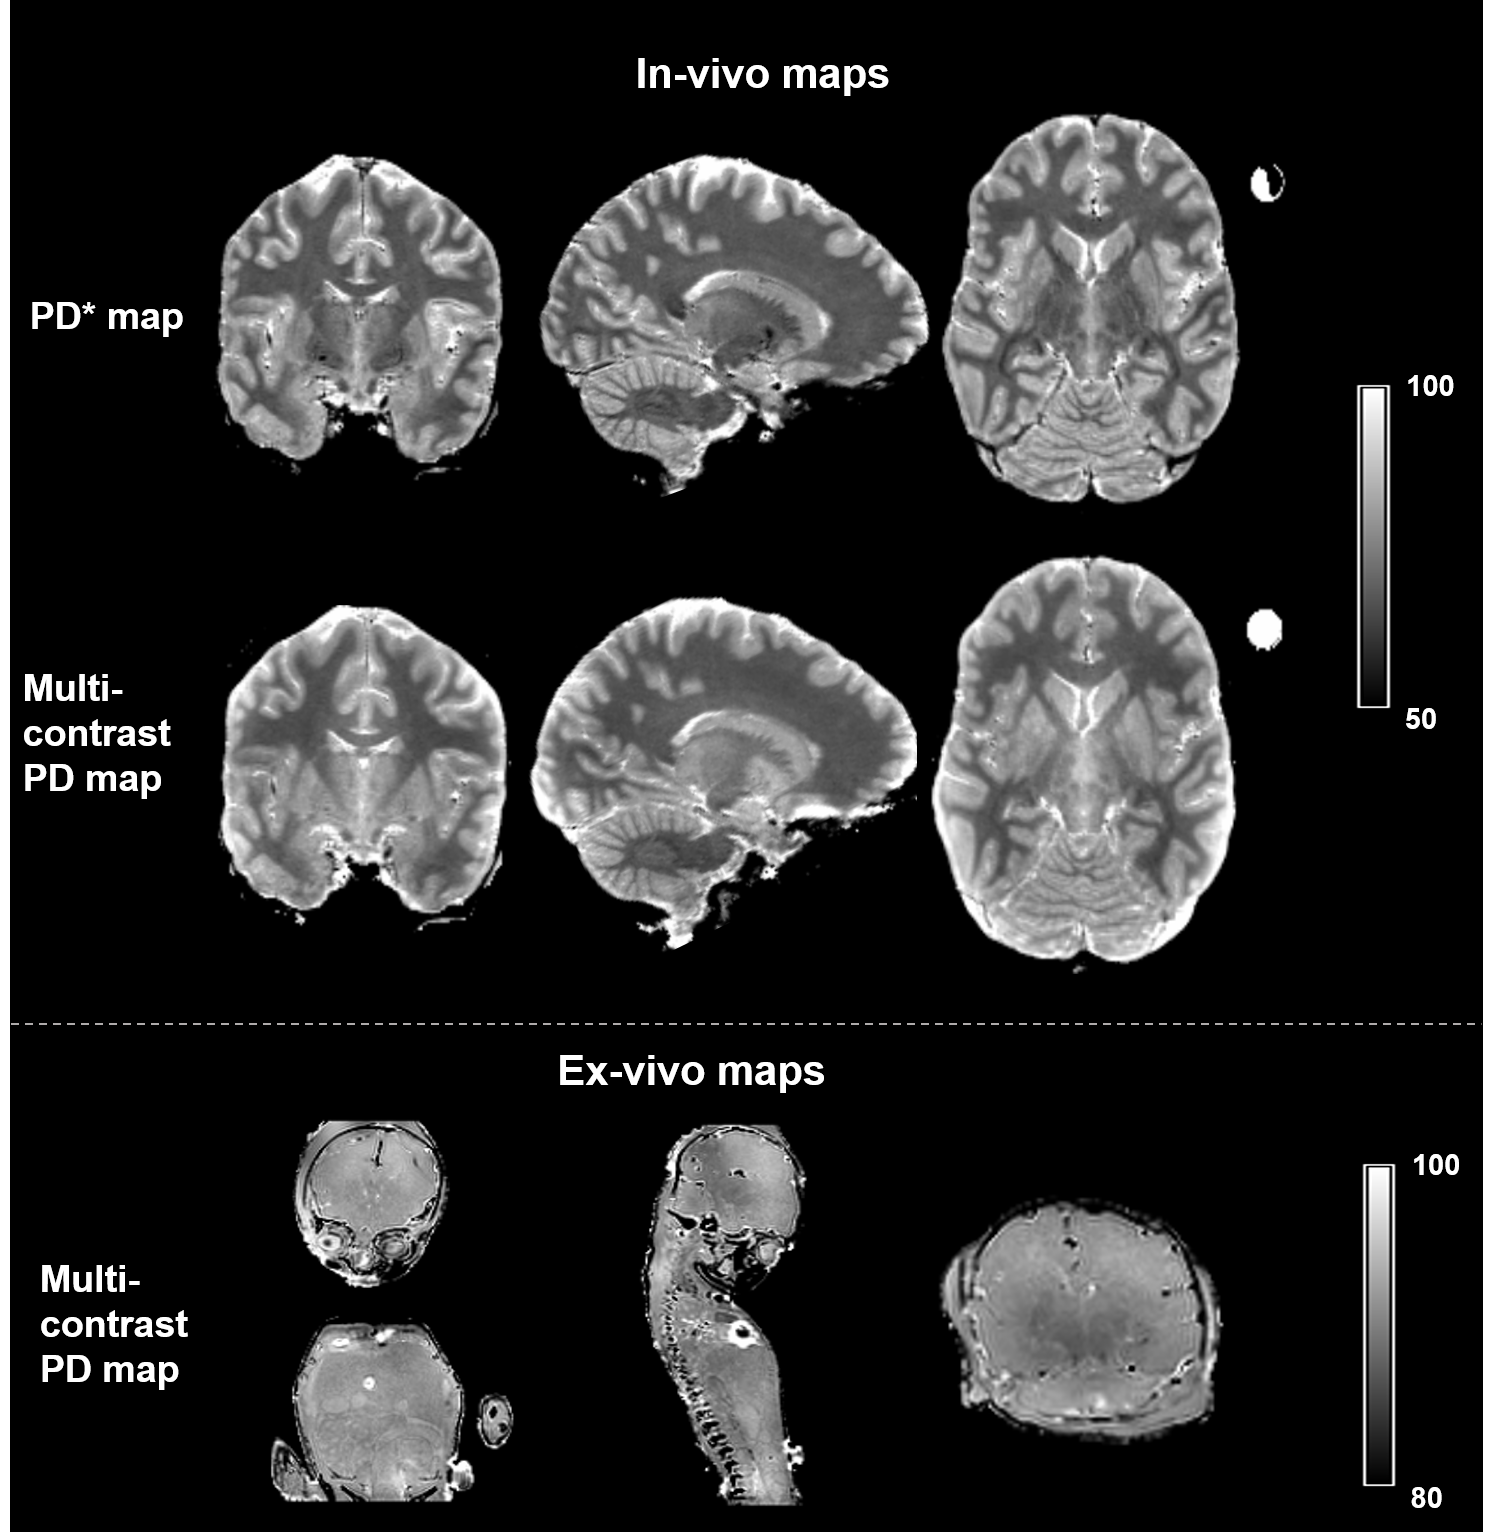
On visual inspection the multi-contrast approach provided a homogeneous PD map over whole brain and whole body in ex-vivo sample (see Figure2).
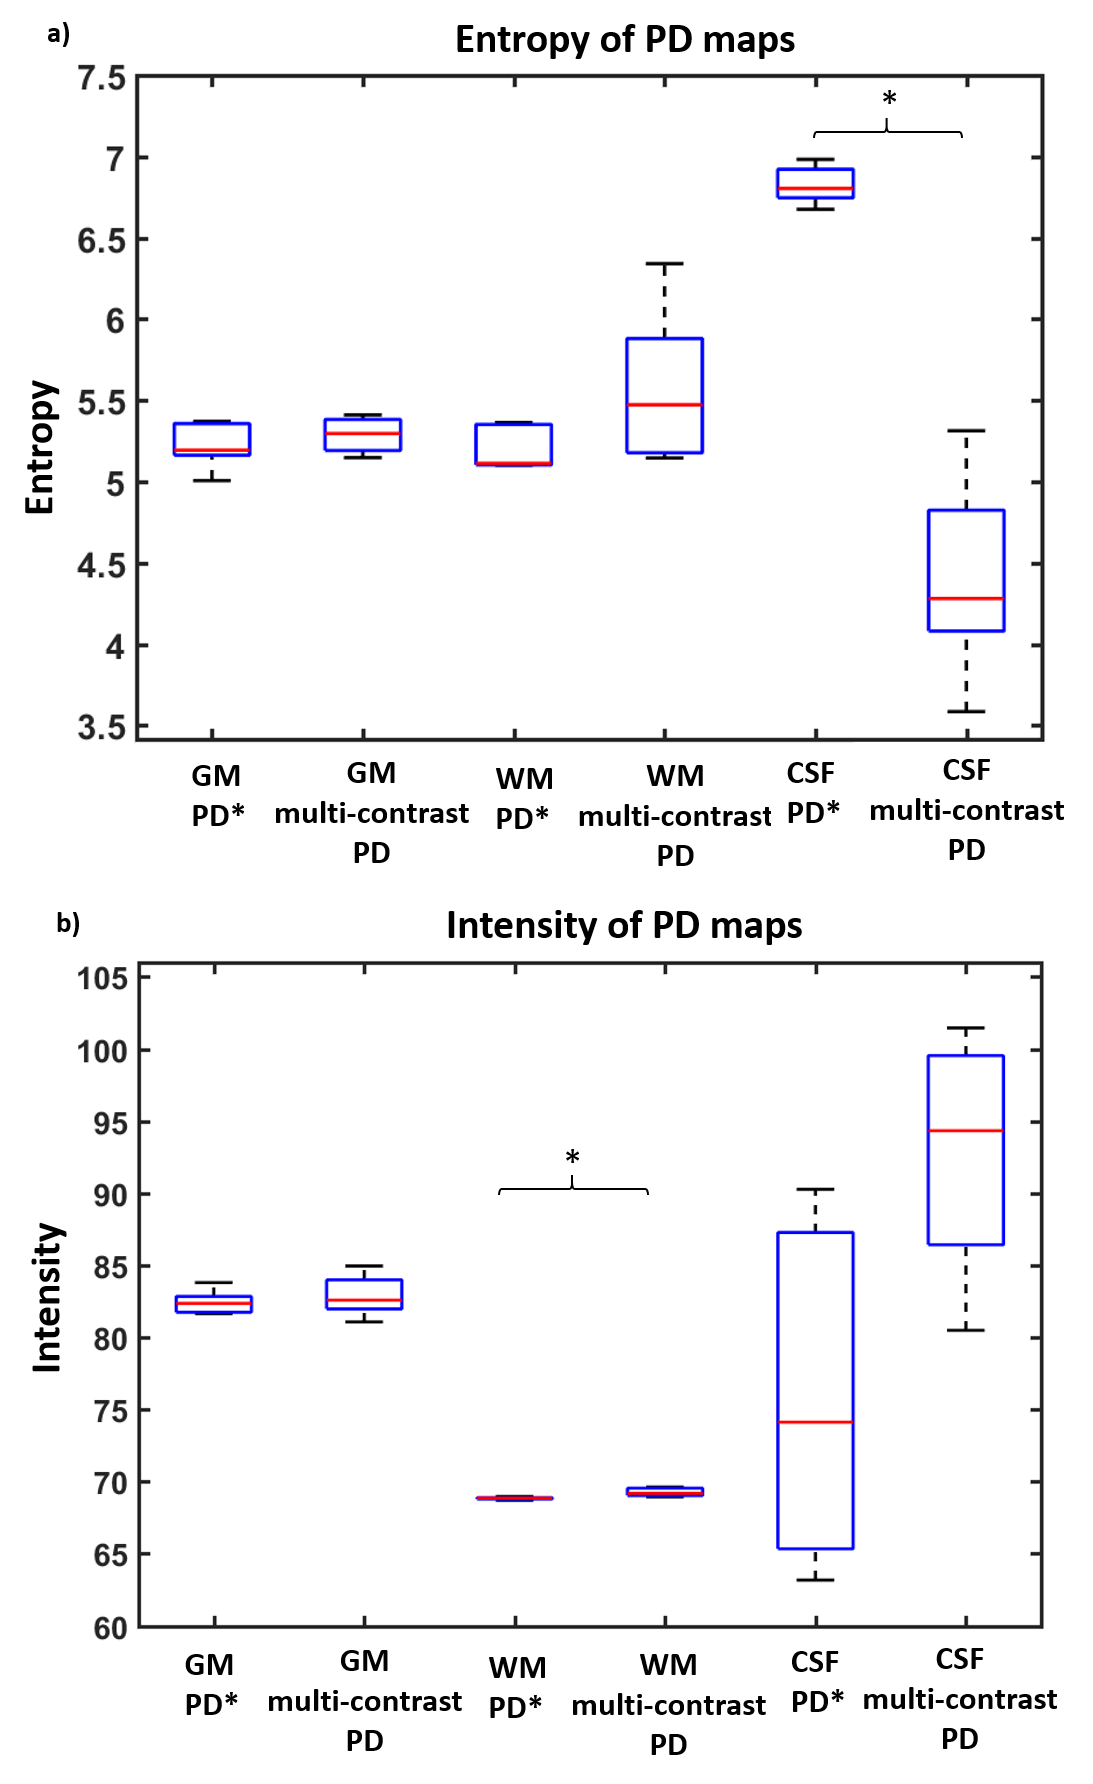
Significantly higher entropy was found in PD* compared to multi-contrast PD within CSF (see Figure3a), while similar values were observed across the two methods in WM and GM. Significantly higher variance was found in multi-contrast PD maps compared to PD* maps in WM (see Figure3b), while similar values were observed in GM and CSF.
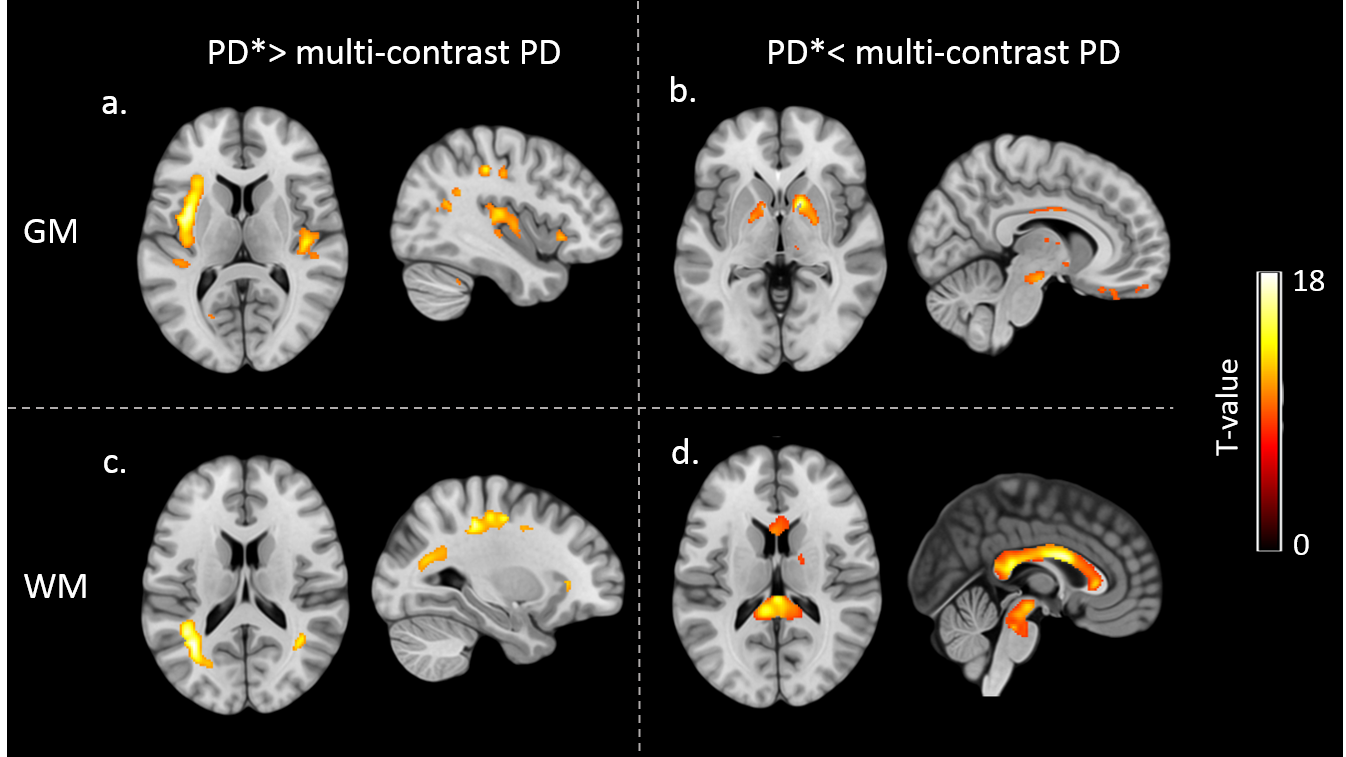
Significantly higher intensity was found in the insula and along visual and sensory-motor tracks for PD* compared to multi-contrast PD maps (see Figure4a,c). Higher values were found in pallidum, brain stem and corpus callosum for multi-contrast PD maps compared to PD* (see Figure4b,d).
Discussion
By using the multi-contrast approach, we estimated PD maps without any prior information about tissue properties or anatomical structures, allowing its application in subjects with severe pathology or in ex-vivo samples.
PD values homogeneity and accuracy within CSF were increased beyond that obtained using state-of-the-art SPM12. The higher PD* homogeneity in WM is expected because both RP correction and scaling are calculated to minimise WM variability. However, this excludes the possibility of biological WM PD variability that can occur in development and in pathology3,4,5. Moreover multi-contrast PD images are corrected for R2*relaxation, which causes reduced PD* estimates in iron-rich structures, although correction accuracy is dependent on mono-exponential R2* decay. The results in corpus callosum indicate that other biophysical factors in addition to iron may contribute to the R2* measured here17.
Acknowledgements
This research was supported by the Henry Smith Charity and Action Medical Research (GN2214).References
1. Neeb H, Ermer V, Stocker T, Shah NJ: Fast quantitative mapping of absolute water content with full brain coverage. NeuroImage 2008; 42:1094–1109.
2. Tofts P (Ed): Quant MRI Brain. John Wiley & Sons, Ltd; 2003:621–633.
3. Mezer A, Yeatman JD, Stikov N, et al.: Quantifying the local tissue volume and composition in individual brains with magnetic resonance imaging. Nat Med 2013; 19:nm.3390.
4. Gracien R-M, Jurcoane A, Wagner M, et al.: Multimodal quantitative MRI assessment of cortical damage in relapsing-remitting multiple sclerosis. J Magn Reson Imaging JMRI 2016; 44:1600–1607.
5. Shah NJ, Neeb H, Kircheis G, Engels P, Häussinger D, Zilles K: Quantitative cerebral water content mapping in hepatic encephalopathy. NeuroImage 2008; 41:706–717.
6. Blystad I, Warntjes JBM, Smedby Ö, Lundberg P, Larsson E-M, Tisell A: Quantitative MRI for analysis of peritumoral edema in malignant gliomas. PloS One 2017; 12:e0177135.
7. Warntjes J b. m., Dahlqvist O, Lundberg P: Novel method for rapid, simultaneous T1, T*2, and proton density quantification. Magn Reson Med 2007; 57:528–537.
8. Volz S, Nöth U, Jurcoane A, Ziemann U, Hattingen E, Deichmann R: Quantitative proton density mapping: correcting the receiver sensitivity bias via pseudo proton densities. NeuroImage 2012; 63:540–552.
9. Weiskopf N, Suckling J, Williams G, et al.: Quantitative multi-parameter mapping of R1, PD(*), MT, and R2(*) at 3T: a multi-center validation. Front Neurosci 2013; 7:95.
10. Sasaki M, Shibata E, Kanbara Y, Ehara S: Enhancement effects and relaxivities of gadolinium-DTPA at 1.5 versus 3 Tesla: a phantom study. Magn Reson Med Sci MRMS Off J Jpn Soc Magn Reson Med 2005; 4:145–149.
11. Lutti A, Stadler J, Josephs O, et al.: Robust and fast whole brain mapping of the RF transmit field B1 at 7T. PloS One 2012; 7:e32379.
12. Lorio S, Kherif F, Ruef A, et al.: Neurobiological origin of spurious brain morphological changes: A quantitative MRI study. Hum Brain Mapp 2016; 37:1801–1815.
13. Helms G, Dathe H, Dechent P: Quantitative FLASH MRI at 3T using a rational approximation of the Ernst equation. Magn Reson Med Off J Soc Magn Reson Med Soc Magn Reson Med 2008; 59:667–672.
14. Weiskopf N, Callaghan MF, Josephs O, Lutti A, Mohammadi S: Estimating the apparent transverse relaxation time (R2*) from images with different contrasts (ESTATICS) reduces motion artifacts. Front Neurosci 2014; 8.
15. Preibisch C, Deichmann R: Influence of RF spoiling on the stability and accuracy of T1 mapping based on spoiled FLASH with varying flip angles. Magn Reson Med Off J Soc Magn Reson Med Soc Magn Reson Med 2009; 61:125–135.
16. Tustison NJ, Avants BB, Cook PA, et al.: N4ITK: improved N3 bias correction. IEEE Trans Med Imaging 2010; 29:1310–1320.
17. Hasan KM, Walimuni IS, Kramer LA, Narayana PA: Human Brain Iron Mapping using Atlas-based T2 Relaxometry. Magn Reson Med 2012; 67:731–739.
Figures