5630
Fast 3D Multi-Parameter Mapping of Relaxation Times and Susceptibility Using Partially RF-Spoiled Gradient Echo at 3T1Research & Development Group, Hitachi, Ltd., Kokubunji, Tokyo, Japan
Synopsis
A method is presented to simultaneously quantify multiple tissue parameters, including susceptibility, by using a partially RF-spoiled gradient echo sequence. The method successfully obtained whole-brain T1, T2*, PD, B1, and susceptibility maps in 1.1-mm isotropic resolution in 12 minutes at 3T. T1, T2*, PD, and B1 maps were estimated simultaneously by a least-squares fit using twelve 3D source images. The intensity function for the fit was formulated by Bloch simulations. Scan parameters were optimized for T1 and T2* values of the brain at 3T. The susceptibility map was estimated by using six multi-echo images in the source images.
Introduction
Multi-parameter mapping of relaxation times and proton density (PD) can be applied to clinical image diagnosis and is expected to be used to quantify diseases. Quantitative susceptibility mapping (QSM) is also expected to be used for early diagnosis of brain diseases such as neurodegenerative diseases. However, obtaining both of the relaxation-time and susceptibility maps often requires longer acquisition times, and a fast method for this was applied only at 7T1. In previous work, we demonstrated T1, T2*, PD, and B1 mapping using a single echo sequence of partially RF-spoiled gradient echo. The parameter maps were estimated simultaneously, without the needing of B1 correction. The intensity function used in the estimation was numerically formulated by Bloch simulations2. In this paper, we extend this method by using a multi-echo sequence, from which susceptibility is estimated. The scan parameters are optimized for brain tissues at 3T by using the law of error propagation to obtain 3D whole-brain maps in 1.1-mm isotropic resolution with a total scan time of 12 minutes. The proposed method is evaluated in phantom and volunteer experiments.Methods
Multiple 3D source images were acquired with 1.1-mm isotropic resolution on a 3T MRI system with a 32-channel head coil using partially RF-spoiled gradient echo sequences. Five scan parameter sets were used (Table 1), which were optimized using the law of error propagation with target relaxation times of GM, WM, CSF, and fat at 3T. The image intensity function $$$f(T_1,T_2^*, FA, TR, \theta)$$$ of the sequence used for the scan parameter optimization and the tissue parameter estimation was formulated numerically by Bloch simulations2. The ranges of T1, T2*, FA, TR, and θ of the function were 50-5600 ms, 10-2800 ms, 3-60 degrees, 10-60 ms, and 2-22 degrees, respectively. Figure 1 shows the subsets of the function. Other scan parameters were as follows: FOV was 167 (RL) x 205 (AP) x 167 (HF) mm3, matrix size was 148 x 186 x 148, and the bandwidth of the RF excitation pulses was 840 Hz, which is narrow enough to reduce the magnetization transfer effects on the estimated relaxation times. 12 source images were acquired in 12.4 minutes by using a parallel scan with the a rapid factor of 2 (RL) x 2 (AP). T1, T2*, PD, and B1 maps were estimated voxel by voxel by fitting intensities of the twelve 3D images to the intensity function using a least-squares fit: $$\sum_{TE}\sum_\theta\sum_{TR}\sum_{FA}\{I(FA, TR, \theta, TE) - \rho\exp(-TE/T_2^*)f(T_1,T_2^*, B_1\times FA, TR, \theta)\}^2=\rm{min}\ \ \ \ (1)$$
$$\\0.05< T_1 < 3, 0.03< T_2^* < 1.5, 0.5 < B_1 < 1.2, 0 < \rho$$ The susceptibility map and fat/water images were estimated using the six multi-echo images obtained with scan 1 in Table 13.
Data from volunteers were obtained according to the standards of the internal review board of Research & Development group, Hitachi, Ltd., following receipt of written informed consent.
Results
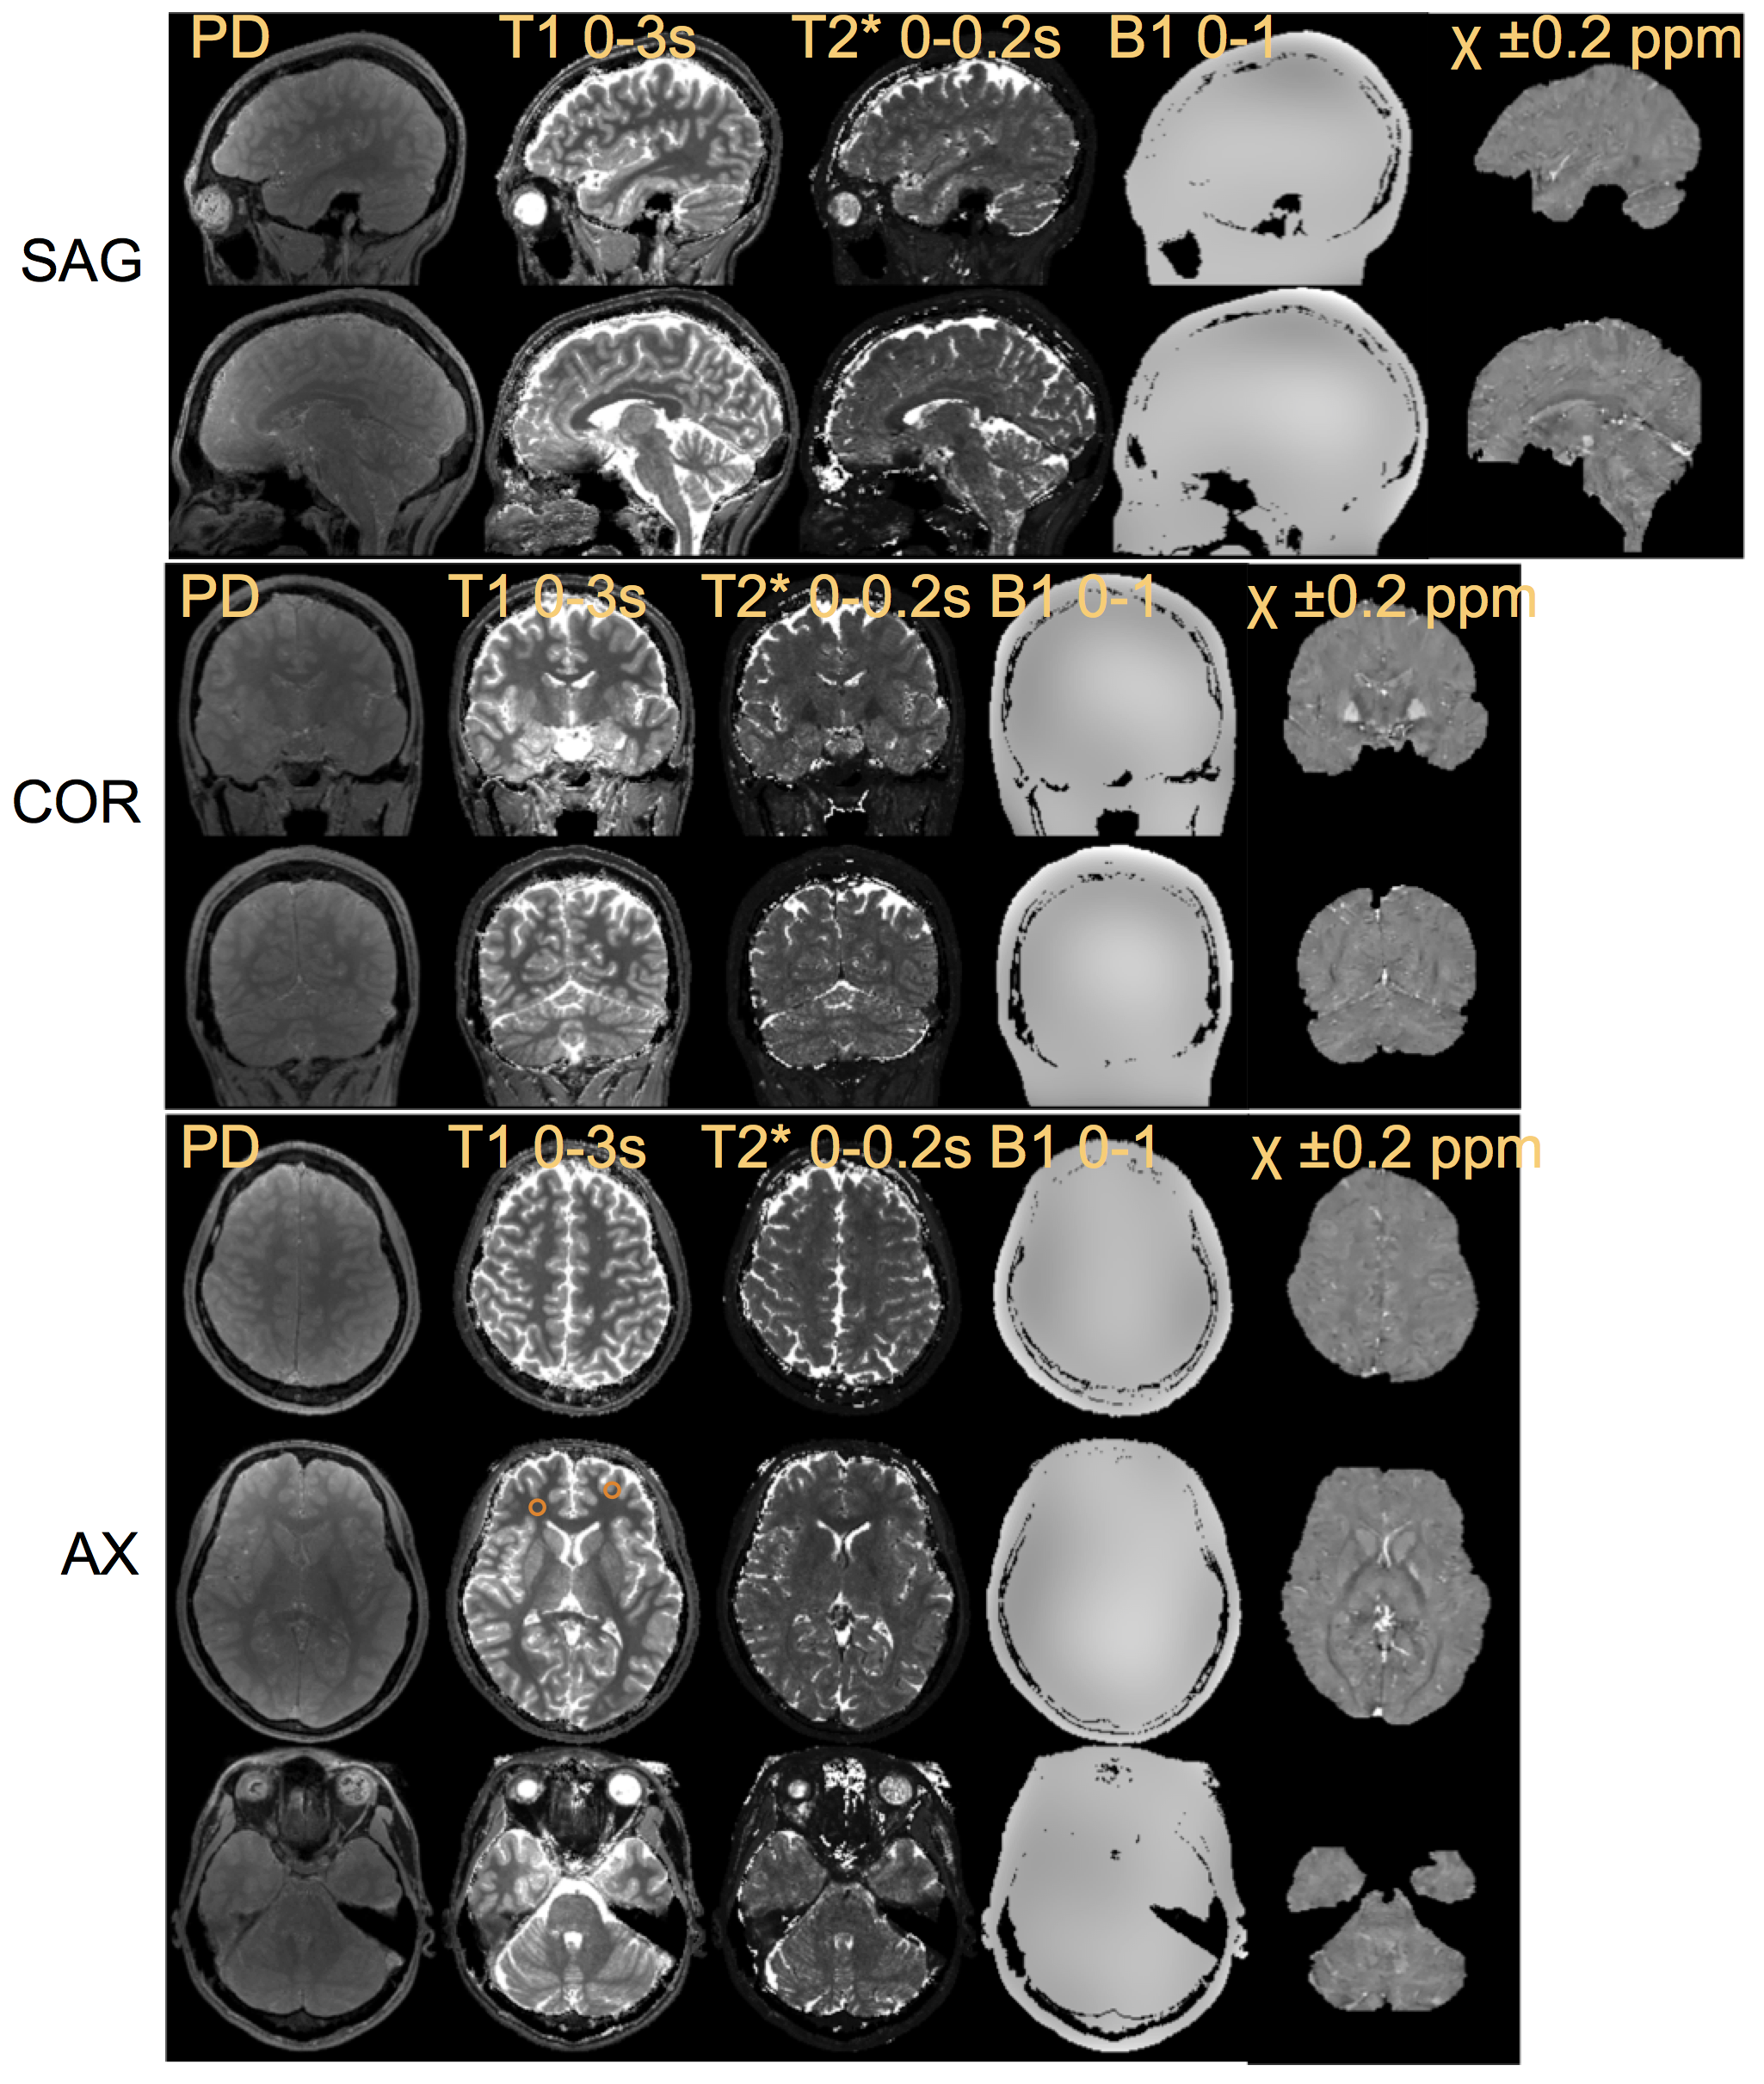
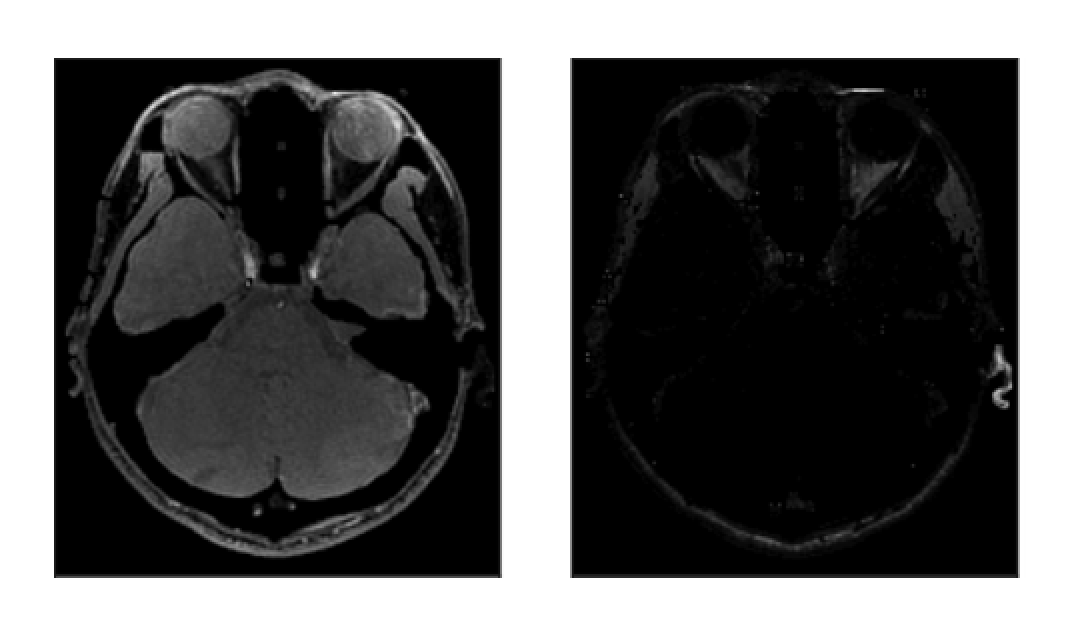
Figure 2 shows a comparison of the estimated relaxation times and those of the conventional methods (IR-SE for T1 and RSSG for T2*) in a phantom study. The differences were less than 7%. Figure 3 shows the estimated maps including susceptibility in sagittal, coronal, and axial views. The mean T1 and T2* values in the ROIs shown by small circles in Fig. 3 are as follows: (T1, T2*) = (889 ms, 47.0 ms) with WM and (1610 ms, 63.6 ms) with GM. Figure 4 shows the water and fat images in an axial view calculated from the multi-echo images acquired using scan 1. The calculation time was about 10 minutes for the 3D T1, T2*, PD, and B1 maps and about 5 minutes for the susceptibility map on 2.7 GHz 12-core Intel Xeon E5.Discussion
As shown in Fig. 2 and 3, the proposed method achieved adequate image quality for the parameter mapping of the relaxation times. Furthermore, the T1 and T2* values of WM and GM agree well with the values in the literature4, 5. This was achieved by optimizing the scan parameters for the brain tissues and by estimating T1, T2*, PD, and B1 simultaneously using Equation 1. It was also confirmed that the susceptibility maps and water/fat images obtained were high quality, as shown in Fig. 3 and 4.Conclusions
Our proposed method successfully obtained T1, T2*, PD, B1, and susceptibility maps at 3T. The scan time for 1.1-mm isotropic 3D mapping of a whole brain was only 12.4 minutes.Acknowledgements
No acknowledgement found.References
- Metere R, Moller HE, Kruger G, Kober T, Schafer A. Simultaneous quantitative mapping of T1, T2*, and magnetic susceptibility with multi-echo MP2RAGE at 7T. ISMRM. 2015: 436.
- Taniguchi Y, Yokosawa S, Bito Y. Simultaneous T1, T2, and B1 mapping using partially RF-spoiled gradient echo. ISMRM. 2011: 4560.
- Sato R, Shirai T, Taniguchi Y, Murase T, Bito Y, Ochi H. Improving estimation of small-vein susceptibility by using a pre-estimated susceptibility map. ISMRM. 2015: 927.
- Deistung A, et al. Susceptibility weighted imaging at ultra -high magnetic field strengths: theoretical considerations and experimental results. Magn Reson Med. 2008 Nov; 60(5): 1155-68.
- Oda S, et al. Optimization of scan parameters for T1-FLAIR imaging at 1.5 and 3T using computer simulation. Magn Reson Med Sci. 2013; 12(3): 183-91.
Figures