5629
Comparison of reconstruction algorithms for quantitative susceptibility mapping in the upper abdomen1Department of Diagnostic and Interventional Radiology, Hokkaido University Hospital, Sapporo, Japan, 2Research & Development Group, Hitachi, Ltd., Tokyo, Japan, 3Healthcare Business Unit, Hitachi, Ltd., Tokyo, Japan
Synopsis
We compared three QSM reconstruction algorithms for use in the upper abdomen: the water-fat separation method (WF), MUDICK, and iLSQR. A healthy male was scanned nine times, in different positions, and three QSM reconstructions from the same source data were compared. The intra-scan SD, representing image homogeneity among images, and the inter-scan SD, representing repeatability among scans, were lower in WF than in MUDICK and iLSQR. Thus, the WF method yielded better homogeneity and repeatability for susceptibility values in the upper abdomen. This forms the basis for further clinical studies and applications of QSM in the abdomen.
Purposes
Quantitative susceptibility mapping (QSM) is a novel method for evaluating magnetic susceptibility, which can be applied for differentiating between calcium and hemorrhage, estimation of iron and deoxy-hemoglobin concentration, etc. QSM has been developed for use in the brain, and several reconstruction algorithms have been constructed mainly in the brain; for example, morphology-enabled dipole inversion (MEDI), a method with multiple dipole-inversion combination with k-space segmentation (MUDICK) and an improved sparse linear equation and least-squares algorithm (iLSQR) [1,2]. However, imaging the upper abdomen is challenging, due to magnetic field inhomogeneity, phase shifts due to physiological motion, and calculation error due to fat tissues. Sharma et al. [3] reported water-fat separation by using chemical shift imaging in the liver, but the QSM reconstruction was not separated for water and fat. We hypothesized that water-fat separation in QSM reconstruction [4] may be more suitable for the upper abdomen, as it can minimize the effect of fat tissues. This study compared the homogeneity and repeatability between three reconstruction methods: the water-fat separation method (WF), MUDICK, and iLSQR.Material and Method
A healthy male volunteer was scanned using 3T MRI (Hitachi, Ltd., Tokyo, Japan) with a 3D-gradient echo sequence, with breath-holding (TR 22.8 ms, multi TE 3.1/6.6/10.1/13.6/17.1/20.6 ms, FA 10, FOV 38 cm, matrix 256 × 256, thickness 3 mm, 64 slices, NEX 1, scan time 19 s). Eleven scans were performed, with a position change in every scan (two scans were excluded because of incomplete breath holding). Three QSM reconstructions from the same source data were compared. MUDICK and iLSQR were implemented without water-fat separation. In the WF algorithm, the source images were divided into fat (fat fraction > 80) and water images (< 80), and QSM reconstructions were conducted with the MUDICK method for each of these; the two reconstructed images were then combined to produce the final QSM image. Susceptibility values in each organ were manually measured with five round regions of interest (ROIs; 3 mm) using 3D Slicer version 4.5.0 (https://www.slicer.org/) in the back muscles, liver, spleen, pancreas, kidney, aorta, and inferior vena cava (IVC). Intra-scan standard deviations (SDs) and inter-scan SDs were compared among the three methods. The intra-scan SD was the SD of five ROIs, and the average of nine scans were compared. The inter-scan SD was the SD of nine scans, calculated after averaging the five ROIs. Intra-scan SDs represented image homogeneity, and were compared by paired t-tests with Bonferroni correction. Inter-scan SDs represented repeatability among scans, and were compared by F-test of variance with Bonferroni correction. P < 0.05 represented a statistically significant difference.Results
The WF method produced more homogenous susceptibility values than the two conventional methods, which had artifactual low values near fat tissues, particularly in the spleen, pancreas, and kidneys (Fig. 1). Susceptibility values of the liver and spleen were higher than those of other organs, due to iron deposition of the reticuloendothelial system, and those of the IVC were higher than those of the aorta due to the increased deoxy-hemoglobin concentration (Fig. 2). All but the aorta intra-scan SDs and inter-scan SDs were smaller in the WF than in the conventional methods. Inter-scan SDs of the spleen, pancreas, and left kidney differed significantly (Fig. 3), as did intra-scan SDs in all organs but the aorta and the right liver lobe (p < 0.05) (Fig. 4).Discussion
Few studies have reported QSM reconstructions in the abdomen, and algorithms have not yet been compared. The conventional methods, but not the WF method, showed artifactual low values near fat tissues. Intra-scan SDs were smaller in the WF method than in the conventional methods, suggesting that the WF method had more homogenous susceptibility in the target organ. We assume that large susceptibility and frequency difference in the fat tissues affected conventional QSM reconstruction, while those artifacts were minimized by water-fat separation during reconstruction. Inter-SDs were low in the WF method, suggesting better repeatability. Therefore, we assumed that water-fat separation resulted in more homogeneous and repeatable QSM images. This study had some limitations; a single volunteer, manual ROI setting, and no gold standard for susceptibility values. Kudo et al. [5] reported that the oxygen extraction fraction could be measured by using QSM in the brain. Similar indices of oxygen metabolism might be applicable in the abdomen, and evaluation of deposition of iron and other substances.Conclusion
Separate QSM reconstruction of water and fat improves homogeneity and repeatability of susceptibility values in the upper abdomen over MUDICK and iLSQR. This can facilitate further clinical studies and applications of QSM in the abdomen.Acknowledgements
We received research funding from Hitachi, Ltd., and R.S, T.S, Y.B are employee of Hitachi, Ltd.References
[1] Sato, R., et al., Quantitative susceptibility mapping using multiple dipole-inversion combination with k-space segmentation. Magnetic Resonance in Medical Sciences, 2017. 16(4): p. 340-350.
[2] Wei Li, et al., A method for estimating and removing streaking artifacts in quantitative susceptibility mapping. Neuroimage. 2015. 108: p. 111-122.
[3] Sharma, S.D., et al., Quantitative susceptibility mapping in the abdomen as an imaging biomarker of hepatic iron overload. Magn Reson Med, 2015. 74(3): p. 673-83.
[4] Sato, R., et al. Quantitative susceptibility mapping with separate calculation in water and fat regions. in ISMRM 25th Annual Meeting & Exhibition 2017. 2017. Honolulu, HI, USA.
[5] Kudo, K., et al., Oxygen extraction fraction measurement using quantitative susceptibility mapping: Comparison with positron emission tomography. J Cereb Blood Flow Metab, 2016. 36(8): p. 1424-33.
Figures
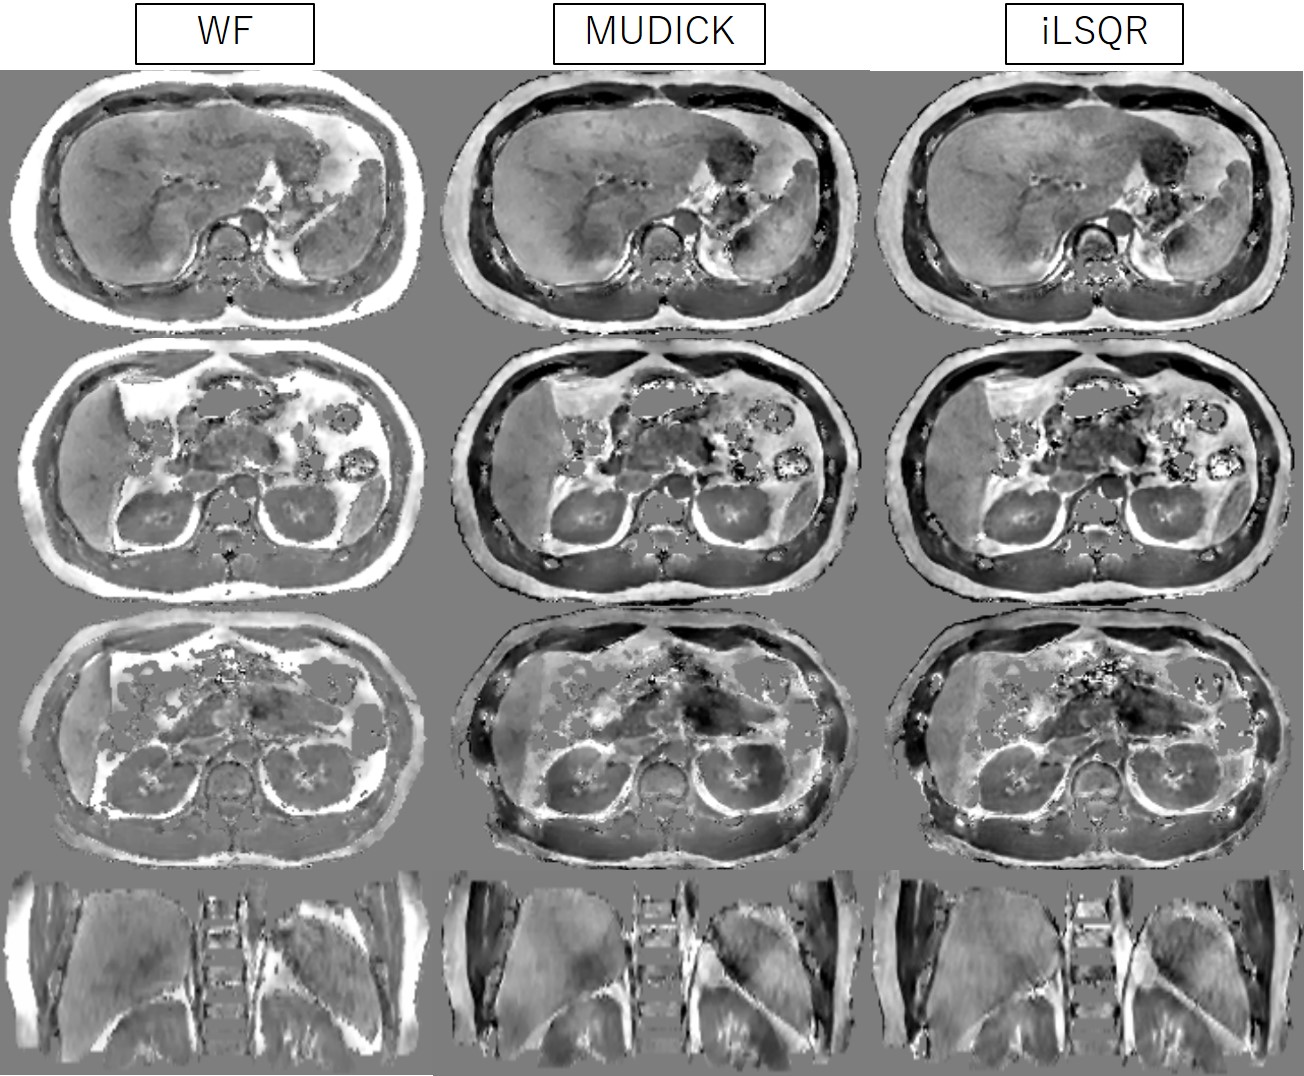
Figure 1. QSM images reconstructed using the WF, MUDIK, and iLSQR methods (-0.5 – +0.5 ppb)
WF (left) shows more homogenous susceptibility values than MUDICK (middle) and iLSQR (right), which produce artifactual low values near fat tissues, particularly in the spleen, pancreas, and kidneys.
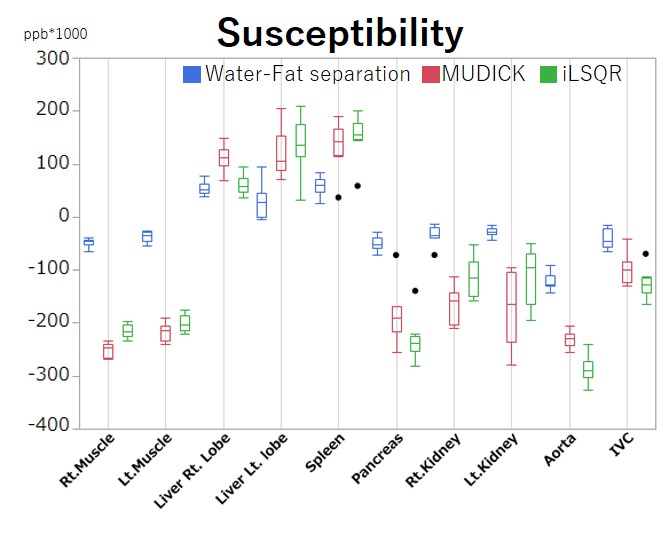
Figure 2. The region of interest (ROI) analysis of average susceptibility in nine scans.
The susceptibility values of the liver and spleen are higher than those of the other organs, due to iron deposition in the reticuloendothelial system, and the inferior vena cava (IVC) has higher susceptibility than the aorta, due to the higher deoxy-hemoglobin concentration. The susceptibility values are different among the three algorithms.
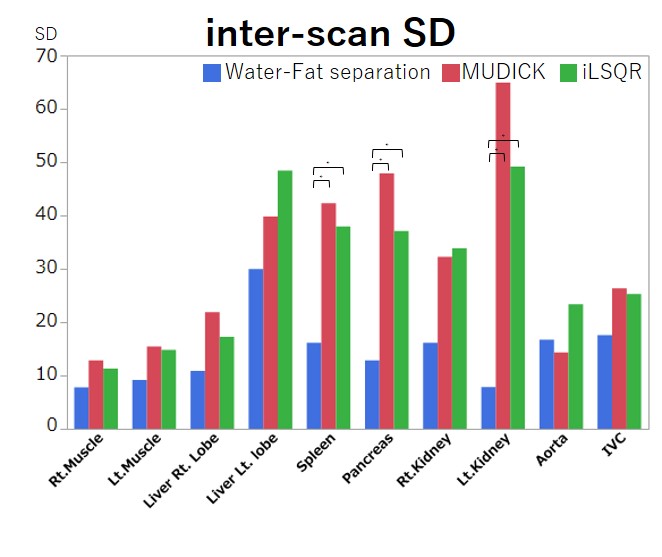
Figure 3. Region of interest (ROI) analysis of inter-scan SDs.
All inter-scan SDs are smaller in the WF method than in the MUDICK and iLSQR methods. Significant differences are noted in inter-scan SDs of the spleen, pancreas, and left kidney. Thus, the WF method has better repeatability among scans than the two conventional methods. * p < 0.05
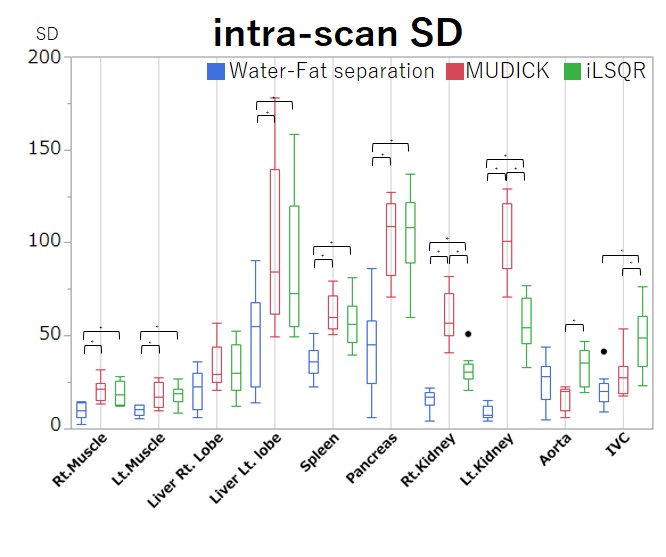
Figure 4. Region of interest (ROI) analysis of intra-scan SD.
All intra-scan SDs except for the aorta are smaller in the WF method than in the MUDICK and iLSQR methods. Significant differences are noted in all organs, except for the aorta and right liver lobe. Therefore, the WF method has better homogeneity among images than conventional methods. * p < 0.05