5626
T1 mapping based on Look-Locker and variable-flip-angle techniques: comparison in phantom measurements and in a patient collective1Institute of Radiology, University Hospital Regensburg, Regensburg, Germany, 2MR Applications Predevelopment, Siemens Healthcare GmbH, Erlangen, Germany
Synopsis
Two methods for T1 mapping – 2D Look-Locker (LL) and 3D variable-flip-angle (VFA) combined with a 2-point-Dixon technique – were compared in phantom and patient measurements. LL yielded reliable results with homogeneous T1 maps of the liver, but was restricted to 3 slices. VFA yielded T1 mapping of the whole liver, but the homogeneity of T1 values across the liver was reduced which led to marked reduction of mean T1 in some patients compared with LL. The VFA variants based on in-phase and water signals showed differences in T1 for increased hepatic fat.
Introduction
Increasing evidence has emerged to suggest T1 mapping as a non-invasive method to determine fibrosis grade or liver function 1-4. One method in use for T1 mapping is the Look-Locker (LL) technique, another one is the variable-flip-angle (VFA) technique. Combining the VFA technique with a Dixon method allows calculation of T1 maps from in-phase and from water signals. The aim of this study was to compare both methods – LL and VFA – in a phantom setting and in a patient collective.Methods
46 patients underwent MRI to assess suspected liver lesions or as follow-up examinations in case of known liver disease at 3T (MAGNETOM Skyra, Siemens Healthcare, Erlangen, Germany). In addition to our routine MRI protocol, T1 mapping with LL and VFA as well as MRS for fat quantification (MRS_FF) were performed in all patients: a prototype 2D LL technique based on snapshot-FLASH imaging 5 was applied for 3 transverse slices through the porta hepatis with inline calculation of T1 maps (T1_LL): TR 3ms, TE 1.32ms, flip angle 8°, 16 contrasts acquired following the inversion pulse, measured voxel size 3.0mm x 2.1mm x 8.0mm; acquisition time (TA) 16s. T1 mapping of the whole liver was performed with a VFA prototype 3D gradient echo sequence: TR 5.79ms; TE 2.46, 3.69ms; flip angle 1°, 7°, 14°; measured voxel size 3.6mm x 2.5mm x 4.8mm; TA 17s; it was combined with a preceding B1-map for an inline correction of B1 inhomogeneities. Using a 2-point Dixon method, T1 maps from in-phase (T1_VFA_in) and from water (T1_VFA_W) signals were calculated inline. MRS was performed with an SVS STEAM sequence using 5 echoes: TR 3000ms; TE 12-72ms; voxel size (30mm)3; TA 15s. T1 relaxation time was measured in 4 ROIs, 3 ROIs in the right and 1 in the left liver lobe. Mean and standard deviation across the 4 ROIs were calculated for each patient.
Both T1 mapping methods were also compared in a phantom consisting of 11 vials with aqueous dilutions of different Gd-EOB-DTPA concentrations to generate T1 relaxation times similar to those found in the human liver. A conventional Turbo Inversion Recovery (TIR) technique (TR 10000ms, TE 10ms) with TI 400ms and 1000ms for T1 mapping (T1_TIR) was used as reference.
T-test and Pearson correlation were applied to compare T1 relaxation times calculated from different methods; the influence of both the T1 standard deviation across ROIs and of MRS_FF on differences between T1 methods was assessed using multivariate analysis.
Results
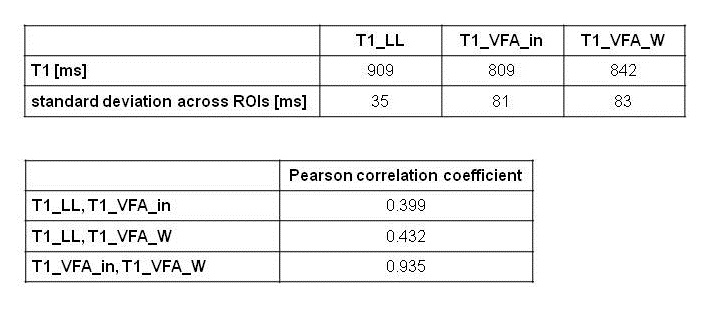
The phantom measurements showed very similar results for T1_TIR and T1_LL; T1_VFA_in was somewhat shorter, this effect was most pronounced for longer T1 times (Fig. 1). In the patient collective, 3 patients had to be excluded for further evaluation due to global fat-water swaps in T1 mapping. For the remaining 43 patients (30 men, 13 women, mean age: 60 years) T1_VFA was mostly shorter than T1_LL (Figs. 2, 3), standard deviation across the ROIs was significantly lower in T1_LL than in T1_VFA_in and T1_VFA_W (p<0.001). Despite these differences, T1 results were significantly correlated (p<0.01) (Fig. 4). Multivariate analysis revealed a relevant influence of both factors on the difference between T1_LL and T1_VFA_in (R=0.745) and between T1_LL and T1_VFA_W (R=0.704).Discussion
Both the LL and the VFA method were successfully applied in patients with moderate correlation of the T1 results. Using LL for T1 mapping yielded reliable results with low inhomogeneities across the liver, but only 3 slices could be acquired during a single breathhold in the current version. T1 mapping with VFA was more susceptible to inhomogeneities – despite correction with a preceding B1 map. Two factors seem to increase the difference between T1_LL and T1_VFA in patients: large standard deviation across the ROIs and increased fat content of the liver (Figs. 2, 3). However, coverage of the whole liver within a single breathhold is a relevant advantage of the VFA technique. In case of increased liver fat content, T1_VFA_in and T1_VFA_W will reflect this effect 6, whereas no relevant influence of fat was seen with LL in our patient collective.Conclusion
2D LL and 3D VFA seem to be complementary rather than competitive methods for T1 mapping of the liver. LL is a robust and reliable technique, but is restricted to few slices, while whole-liver coverage is a relevant advantage of VFA. Reduced homogeneity is the major drawback of VFA; in some cases, it results in a marked reduction of T1 compared with LL. Increased liver fat leads to reduced T1 mainly in VFA_in compared with LL and might therefore yield new insights into liver characterization.Acknowledgements
No acknowledgement found.References
1. Hoad CL, Palaniyappan N, Kaye P et al. A study of T1 relaxation time as a measure of liver fibrosis and the influence of confounding histological factors. NMR Biomed. 2015; 28(6):706-714.
2. Verloh N, Utpatel K, Haimerl M et al. Liver fibrosis and Gd-EOB-DTPA-enhanced MRI: A histopathologic correlation. Sci Rep. 2015 Oct 19;5.
3. Haimerl M, Schlabeck M, Verloh N et al. Volume-assisted estimation of liver function based on Gd-EOB-DTPA-enhanced MR relaxometry. Eur Radiol 2016; 26:1125-1133.
4. Yoon JH, Lee JM; Kim E et al. Quantitative liver function analysis: Volumetric T1 mapping with fast multisection B1 inhomogeneity correction in hepatocyte-specific contrast-enhanced liver MR imaging. Radiology 2017, 282, 408-417.
5. Deichmann R and Haase A. Quantification of T1 values by SNAPSHOT-FLASH NMR imaging. JMRI 1992, 96, 608-612.
6. Fellner C, Wiggermann P, Nickel D et al. Water-fat separated T1 mapping in the liver and correlation to hepatic fat fraction. ISMRM 2017, 3199.
Figures
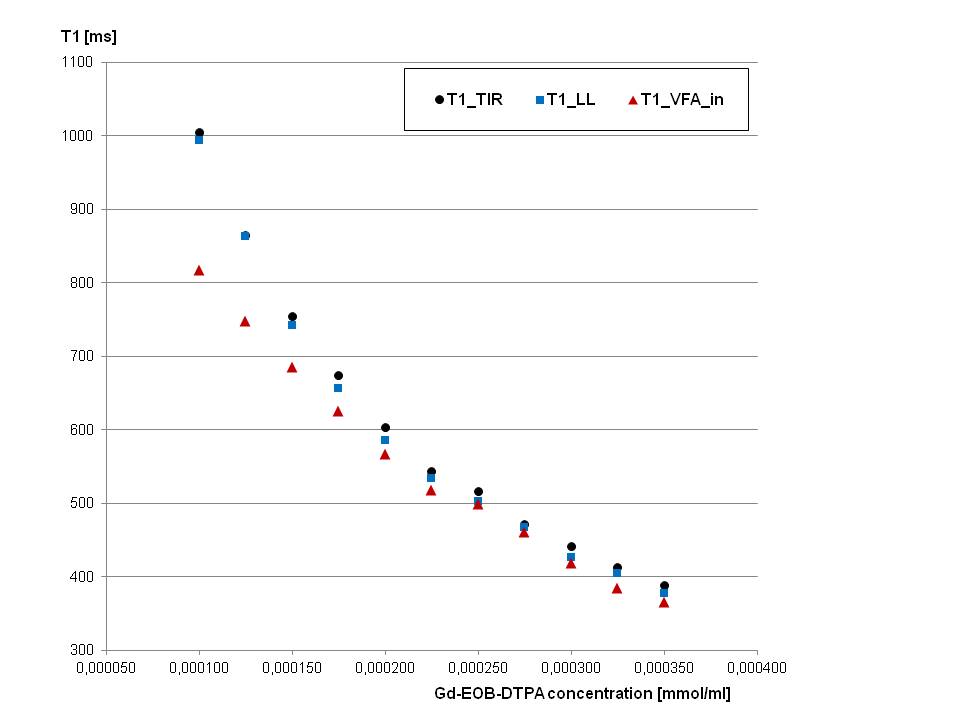
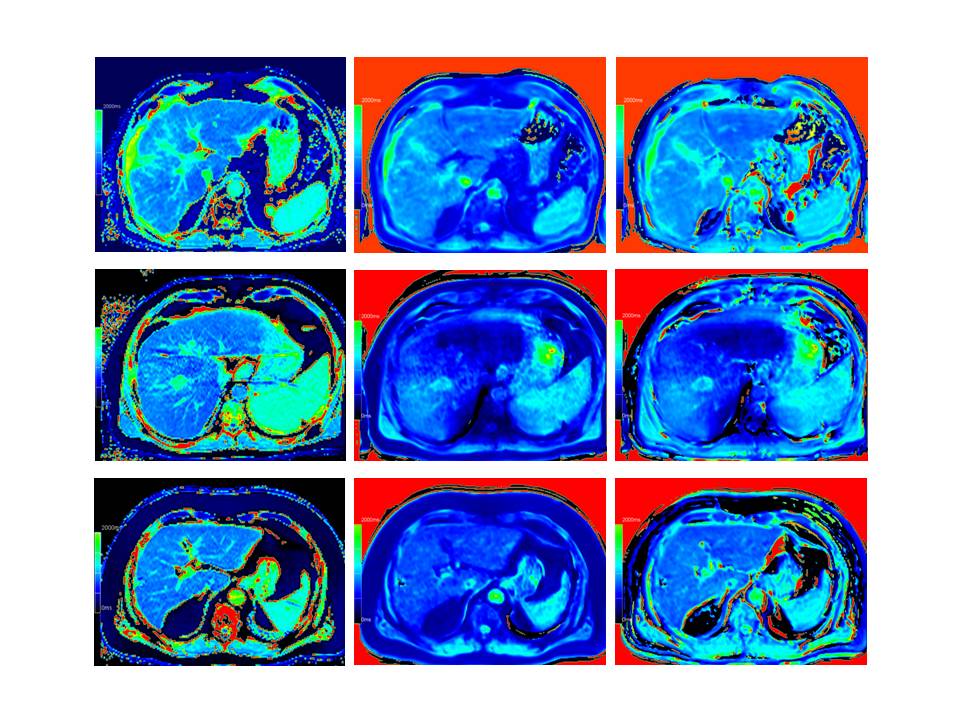
Fig. 2: T1 mapping in 3 patients with LL (left column), VFA_in (middle column) and VFA_W (right column).
Upper row: 53-year-old man with normal liver fat (0.2%), homogeneous T1 mapping using LL (mean T1_LL: 954ms) and VFA (mean T1_VFA_in: 920ms; mean T1_VFA_W: 941ms).
Middle row: 57-year-old man with normal liver fat (0.6%), homogeneous T1 mapping using LL (mean T1_LL: 1007ms), marked inhomogeneities using VFA (mean T1_VFA_in: 873ms; mean T1_VFA_W: 869ms).
Lower row: 70-year-old man with increased liver fat (12.3%), homogeneous T1 mapping using LL (mean T1_LL: 929ms) and VFA (mean T1_VFA_in: 782ms; mean T1_VFA_W: 844ms).
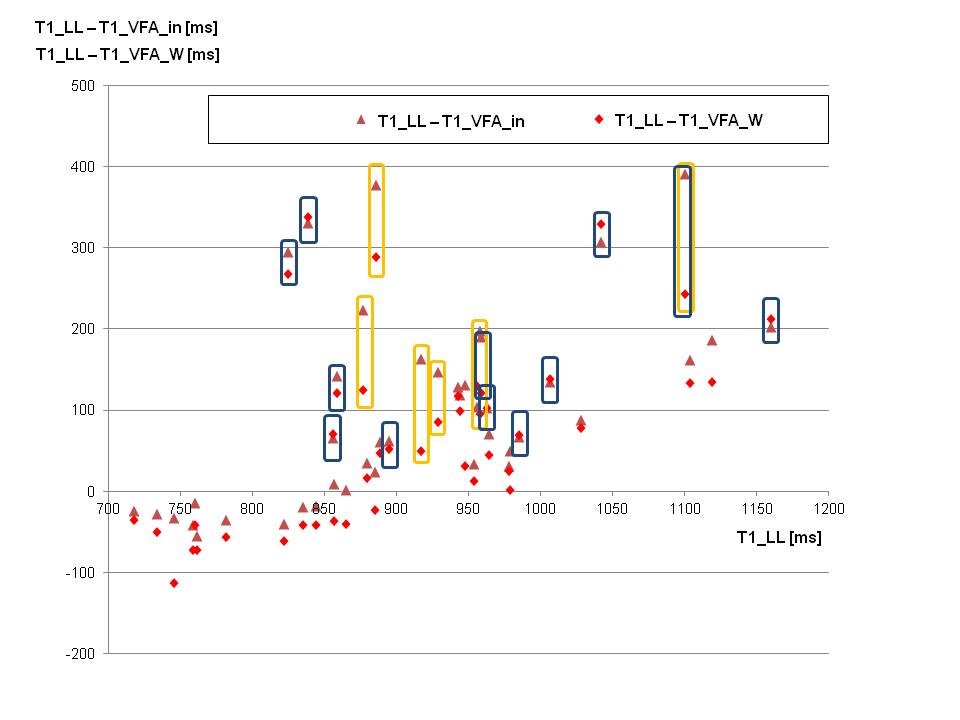
Fig. 3: T1 mapping in 43 patients with LL and VFA. The diagram compares T1_LL (x-axis) and the difference between T1_LL and T1_VFA_in as well as the difference between T1_LL and T1_VFA_W (y-axis).
Results of patients with increased liver fat (MRS_FF above 10%) are marked with yellow contours, patients with standard deviations across ROIs above 120ms with dark blue contours.