5625
Measuring the reproducibility of time-encoded pseudo-continuous arterial spin labeling with a perfusion phantom1Radiology & Nuclear Medicine, Erasmus MC, Rotterdam, Netherlands, 2Gold Standard Phantoms Limited, London, United Kingdom, 3Department of Radiology & Nuclear Medicine, Erasmus MC, Rotterdam, Netherlands, 4University College London, London, United Kingdom
Synopsis
Arterial Spin Labeling (ASL) is a magnetic resonance imaging (MRI) technique for measuring cerebral blood flow (CBF). Here, we present data on the reproducibility of measuring CBF with time-encoded multi post-labeling delay (PLD) pseudo-continuous ASL (pCASL) in a healthy volunteer compared to a flow phantom. This work shows the potential of using a flow phantom to assess the reproducibility of quantified CBF with ASL.
Introduction
Methods
All pCASL scans were performed on a 3 Tesla MRI scanner and with a 32-channel head coil (General Electric, Chicago, USA). Acquisition parameters for the pCASL scans include: 3D spiral read-out, time encoded labeling, seven effective PLDs from 0.8 to 2 s, reconstruction matrix 128x128x42, resolution 1.9x1.9x3.5 mm3. Within-session reproducibility of the pCASL scan in a healthy volunteer (female, 31 years) was assessed: two pCASL scans were collected back-to-back, at the beginning of this scan session, and one at the end (approximately 45 minutes after the second scan). This scan session was repeated two weeks later, at the same time of day. To assess the reproducibility of the pCASL scans for QASPER, we used a range of flow velocities (350, 400, and 450 ml/min, pseudo-randomly) through the phantom. Within-session reproducibility for all velocities was assessed by back-to-back repeating the scans per flow velocity. Between-session reproducibility was assessed by repeating the scan session 7 days later. The flow rates of QASPER during the pCASL scans were set and recorded by software provided with the phantom.
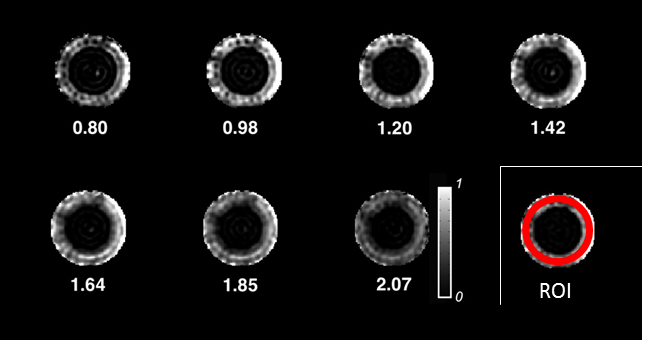
Data analysis was done with in-house written MATLAB (R2016b) scripts. The ASL difference images were quantified by least-squares fitting of the Buxton model, accounting for the different effective label durations and PLDs within the pCASL sequence3,4. The region of interest (ROI) for the healthy volunteer was a whole brain grey matter mask, obtained from a high-resolution T1-weighted image. This image was linearly registered to the ASL scans (FLIRT within FSL 5.0.9), segmented (FAST within FSL 5.0.9) to obtain the ROI. The ROI used to analyze the flow phantom data was created as a ring, on a single slice within the perfused area in QASPER (visual inspection). This mask was created for each scan day separately. Examples of the acquired images for the phantom can be seen in Figure 1.
Results
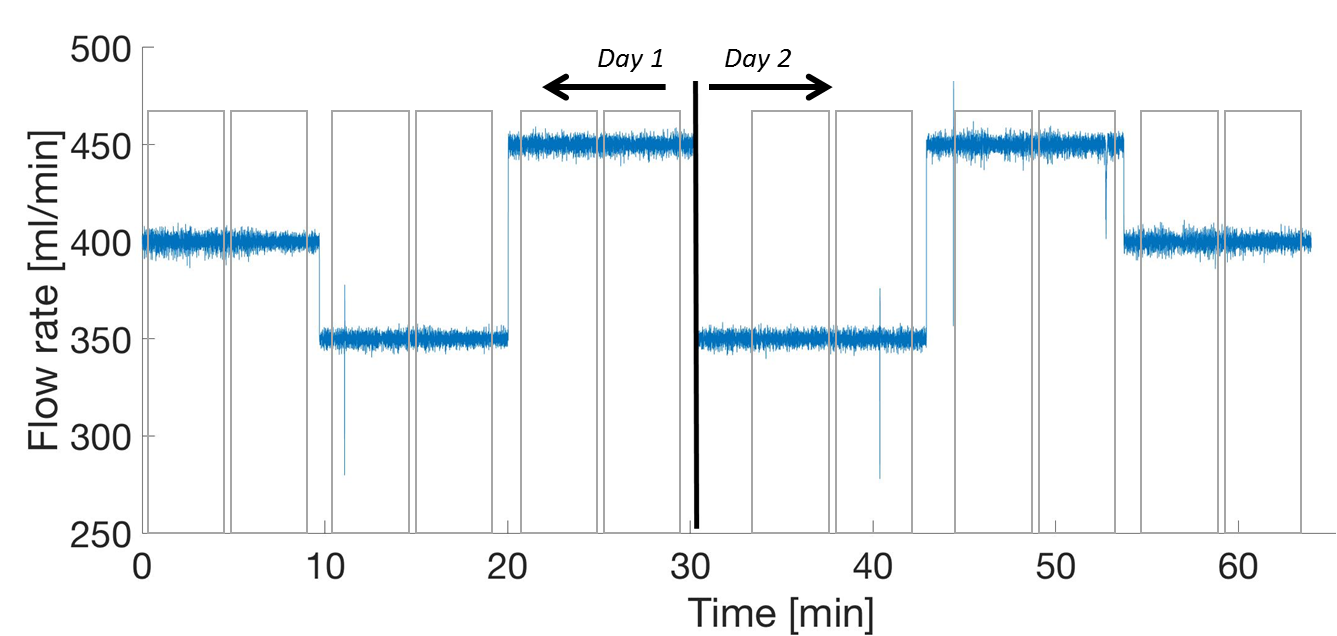
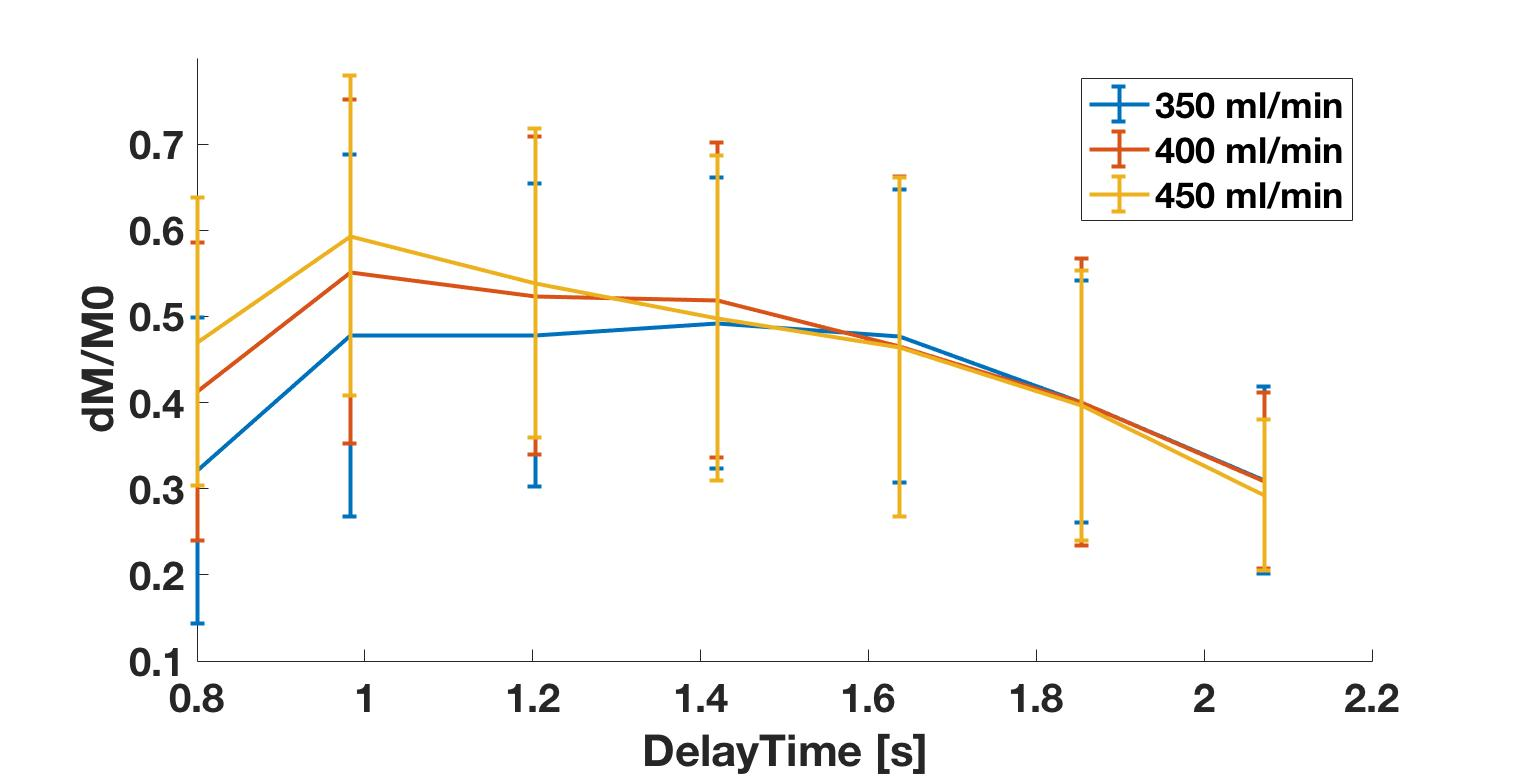
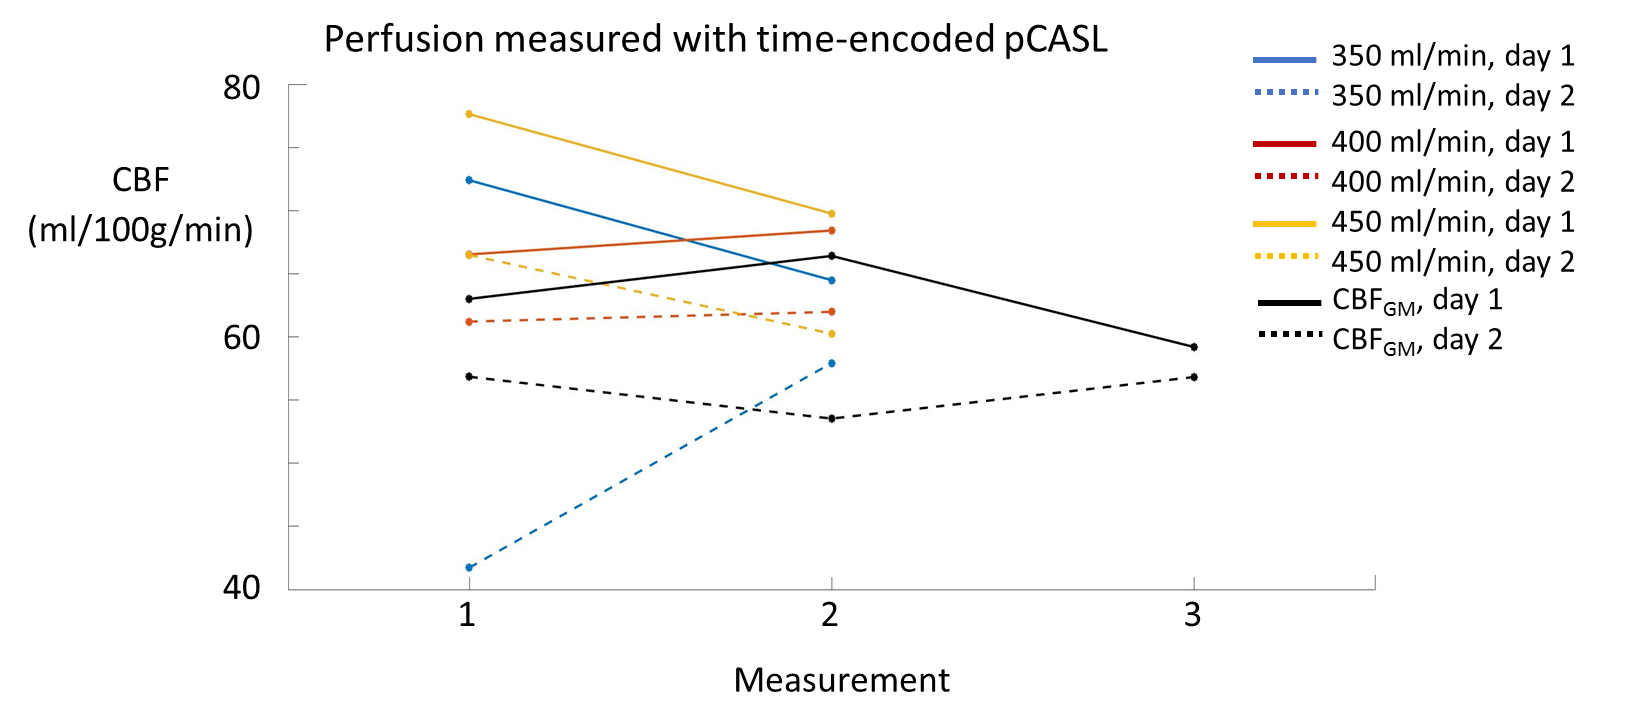
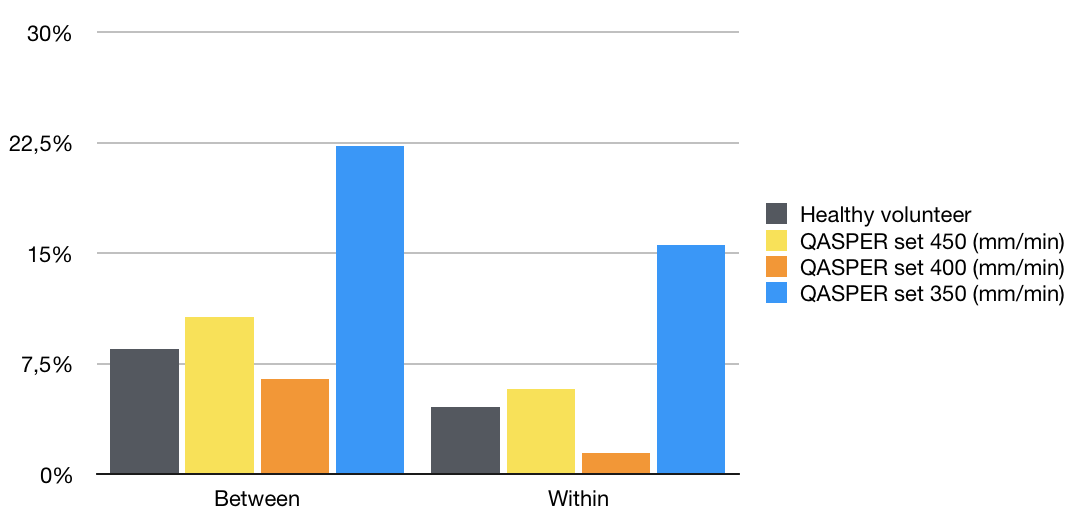
The flow rate of the phantom was stable during the scans, with variations around the set point < 1% for all three set flow velocities on both days (Figure 2). Examples of the acquired dM/M0 values across the perfusion region of interest for each of the flow settings can be seen in Figure 3. The average grey matter CBF for the healthy volunteer and for each of the flow rates set in the phantom can be seen in Figure 4.The within- and between-session coefficients of variation of the grey matter CBF of the volunteer were higher than for the flow phantom with a set flow rate of 400 ml/min (Figure 5).Discussion
The reproducibility of CBF quantification with the phantom is dependent on the flow velocity set for the scan. As can be seen for the flow rate set to 350 ml/min it is not yet trivial to obtain consistent CBF measurements with QASPER (Figures 4 and 5), which can be due to inconsistent placement of the labeling plane as well as to air bubbles trapped within the flow phantom. However, when using the perfusion and reproducibility results of the phantom with a flow rate of 400 ml/min, it may be suggested that the variation measured in the grey matter CBF of the healthy volunteer is, at least in part, a result of changes in physiological state of the volunteer. To summarize, this work shows the potential of using a perfusion phantom to assess the reproducibility of quantified CBF with ASL.Acknowledgements
No acknowledgement found.References
- Alsop DC, Detre JA, Golay X, Gunther M, Hendrikse J, Hernandez-Garcia L, et al. Recommended implementation of arterial spin-labeled perfusion MRI for clinical applications: A consensus of the ISMRM perfusion study group and the European consortium for ASL in dementia. Magn Reson Med. 2015;73(1):102-16.
- Oliver-Taylor A, Gonçalves M, Hampshire T, Davis B, Daga P, Evans L, Bainbridge A, Wheeler-Kingshott C, Sokolska M, Thornton J, De Vita E Golay X. A Calibrated Perfusion Phantom for Quality Assurance of Quantitative Arterial Spin Labelling. Proceedings of the 24th meeting of the ISMRM, 2016, Abstract #0681.
- Buxton RB, Frank LR, Wong EC, Siewert B, Warach S, Edelman RR. A general kinetic model for quantitative perfusion imaging with arterial spin labeling. Magn Reson Med. 1998;40(3):383-96.
- Dai, W., Robson, P. M., Shankaranarayanan, A., & Alsop, D. C. (2012). Reduced resolution transit delay prescan for quantitative continuous arterial spin labeling perfusion imaging. Magn Res Med, 67(5), 1252–65
Figures