5624
Monte Carlo Bloch Simulation of T1, T2 uncertainties in NMR and MRI pulse sequences1NIST, Boulder, CO, United States
Synopsis
A Monte Carlo Bloch solver has been developed and used to establish the bias and uncertainty of T1, T2 values in primary reference solutions for MRI phantoms. Errors and uncertainties are on the order of 1% when using a NMR system and robust pulse sequences. Errors and uncertainties in MRI systems are much larger, 5% to 40% for T1 values. The Monte Carlo Bloch solver can help determine uncertainties and imperfections in a scanner and then determine the bias and uncertainty of measured biomarkers for different pulse sequences. At present, the source of the large errors and scanner-to-scanner variation in T1 and T2 measured using the NIST/ISMRM system phantom are unknown.
INTRODUCTION:
Bloch simulators have been used extensively in nuclear magnetic resonance (NMR)1 and magnetic resonance imaging (MRI)2, 3 to develop and understand new pulse sequences, investigate artifacts, and more recently for advanced imaging techniques that depend on dictionary lookup tables. Here, we present a new class of Bloch solver designed to investigate uncertainties in quantitative MRI techniques and assist in the assessment of quantitative MRI phantoms.4 Our system couples a Bloch simulator to Monte Carlo based sampling of uncertainties and non-idealities that are inherent in NMR and MRI. These include B0 and B1 inhomogeneities, time base jitter and imperfections, transmit and receive phase jitter, temperature variations, coil and electronic noise, variations in initial conditions, nonlinear gradients, jitter in gradient and RF waveforms, errors in fitting due to noise and imperfect data. The Monte Carlo Bloch solver was used to establish uncertainties in primary calibrations of SI-traceable phantom solutions where absolute accuracies are on the order of 1%. After validation of the solver using precision NMR techniques, it can be applied to MRI systems in which the pulse sequences are less ideal due to the need to minimize imaging time and RF dose.METHODS:
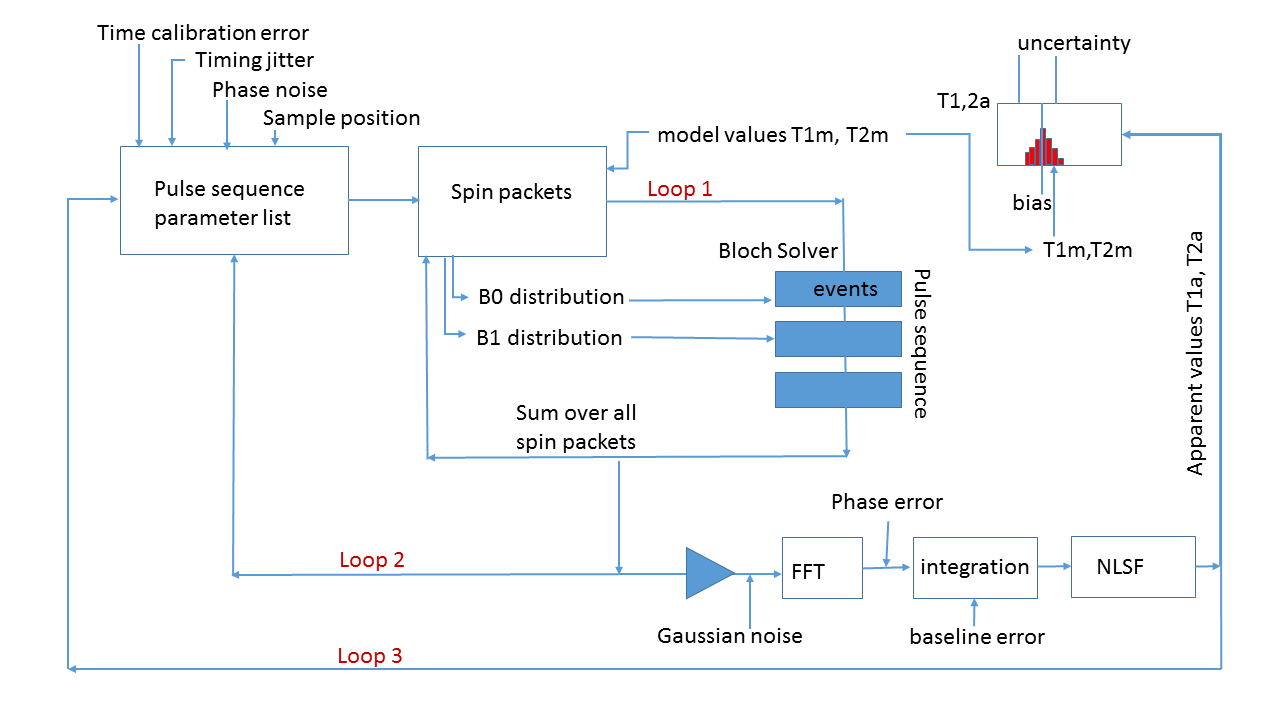
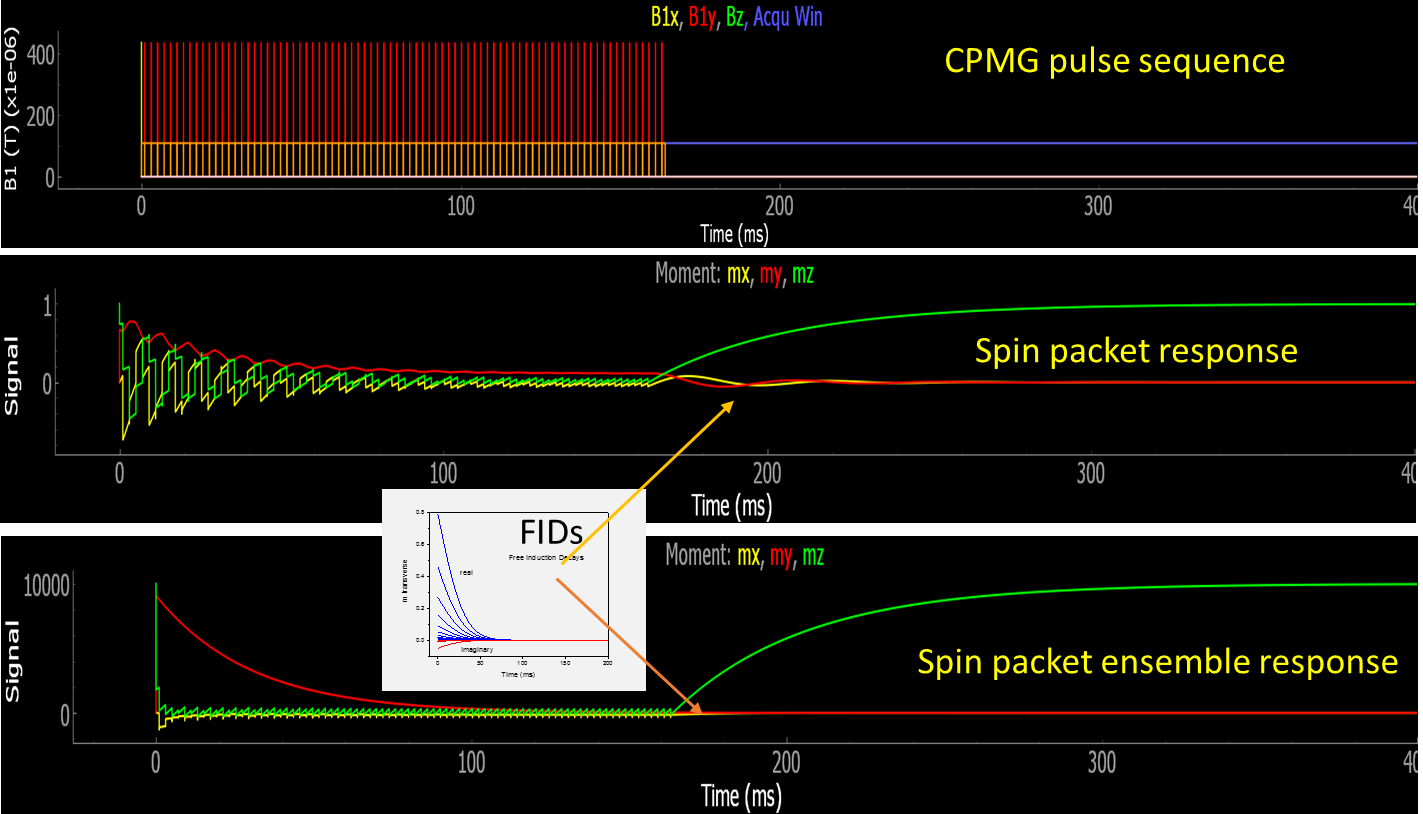
The Monte Carlo Bloch simulator (Fig. 1) uses an object-oriented approach with modular events that corresponds to the pulse sequence structure of a commercial NMR/imaging system. System nonidealities were either measured directly (time base accuracy/jitter, temperature variations, electronic/coil noise) or determined from fitting data (nutation for B1 inhomogeneity, FID spectral width for B0 variation). Each event can specify its own propagator. Here, all events, except the last delay, use an ordinary differential equation solver from the SciPy library (the integrations are in the rotating reference frame). A large number of spin packets (isochromats) are sampled to allow spin echo and T2* effects to be accurately modeled.1 Fig. 2 shows a CPMG pulse sequence along with the magnetization response for a single spin packet and the ensemble of spin packets.RESULTS:
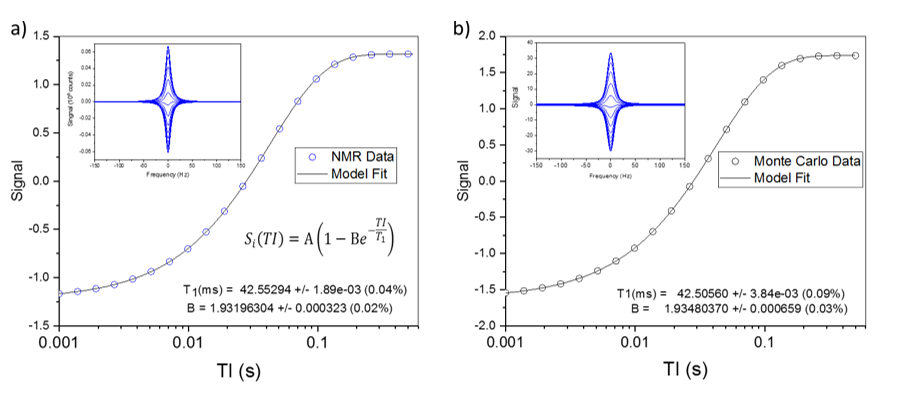
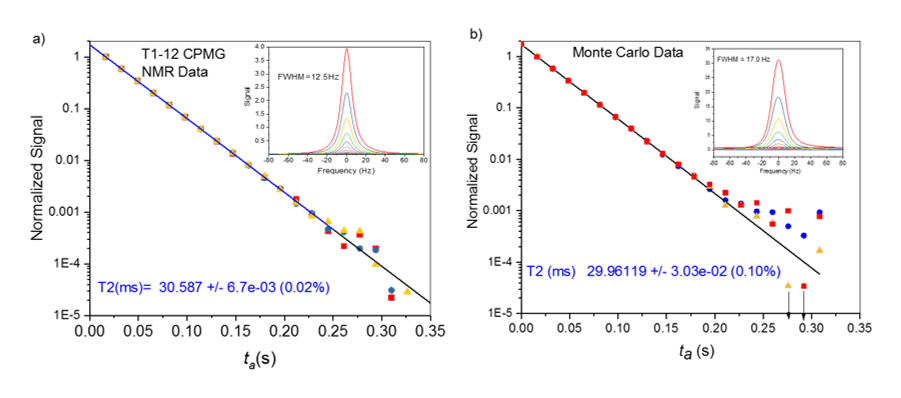
Fig. 3 shows real and simulated NMR data for T1 inversion recovery sequence, using a composite 180° inversion pulse, with 20 inversion times (TI). The sample is a standard NiCl2 solution used in the ISMRM/ NIST system phantom. All aspects of the data must be modeled by the simulation including the deviation of the data from the model and run-to-run variation. The input T1 and T2 values for the simulation are 42.000ms and 30.000ms, respectively, while the apparent T1 value is 42.553ms. The pulse sequence introduces a 0.553ms bias, which arises primarily from B1 nonuniformities. The nonidealities also impact the B-parameter in the T1 fits, which for perfect inversion should be 2.0. The deviation gives the fraction of nuclear magnetization that is not inverted. Real and simulated data B parameters are 1.932 and 1.935 respectively, indicating that the simulation approximates the nonidealities responsible for the distribution in flip angles. The standard errors in the model fit are 0.02% and 0.09% for the real and simulated data indicating that some uncertainty distributions are overestimated. The spectra, from which a signal proportional to the longitudinal magnetization are obtained, are shown in the insets. The simulated spectra are broader giving a shorter T2* than the real data, indicating that the B0 variation has been overestimated. Fig. 4 shows real and simulated NMR data for a CPMG sequence (the integrated spectral signal versus ta, the time between excitation and FID acquisitions). The apparent T2=29.961±0.03ms does not show significant bias relative to the input T2=30.000ms.DISCUSSION:
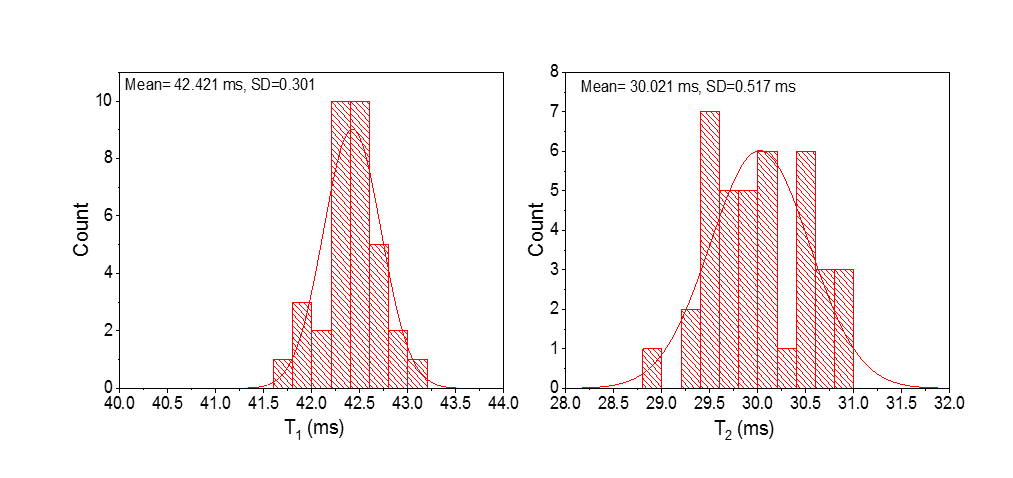
The Monte Carlo Bloch simulator produces distributions of apparent T1, T2 parameters (Fig. 5), which specify the bias (systematic error) and uncertainty (the distribution of the measurand values upon repeated measurements). The bias is estimated by the mean of the distribution and the uncertainty is characterized by the standard deviation of the distribution. Different non-ideality distributions can be turned on/off to understand how each affects measurands.CONCLUSION:
A Monte Carlo Bloch solver has been developed to establish bias and uncertainty of T1, T2 values in primary reference solutions for MRI phantoms. Errors and uncertainties are on the order of 1% when using a NMR system and robust pulse sequences. Errors and uncertainties in MRI systems are much larger, 5% to 40% for T1 values.5 The Monte Carlo Bloch solver can help determine uncertainties and imperfections in a scanner and then determine the bias and uncertainty of measured biomarkers for different pulse sequences. At present, the source of the large errors and scanner-to-scanner variation in T1 and T2 measured using the NIST/ISMRM system phantom are unknown.Acknowledgements
We thank the ISMRM Standards for Quantitative Magnetic Resonance committee for guidance, Elizabeth Mirowski for providing samples and motivation, and Cameron Clickner for technical assistance.References
1. Shkarin P, Spencer RGS. Direct simulation of spin echoes by summation of isochromats. Concepts in Magnetic Resonance. 1996;8(4):253-68. doi: Doi 10.1002/(Sici)1099-0534(1996)8:4<253::Aid-Cmr2>3.0.Co;2-Y. PubMed PMID: WOS:A1996UR18700002.
2. Benoit-Cattin H, Collewet G, Belaroussi B, Saint-Jalmes H, Odet C. The SIMRI project: a versatile and interactive MRI simulator. J Magn Reson. 2005;173(1):97-115. doi: 10.1016/j.jmr.2004.09.027. PubMed PMID: 15705518.
3. Kose R, Kose K. BlochSolver: A GPU-optimized fast 3D MRI simulator for experimentally compatible pulse sequences. J Magn Reson. 2017;281:51-65. doi: 10.1016/j.jmr.2017.05.007. PubMed PMID: 28550818.
4. Keenan KE, Ainslie M, Barker AJ, Boss MA, Cecil KM, Charles C, Chenevert TL, Clarke L, Evelhoch JL, Finn P, Gembris D, Gunter JL, Hill DLG, Jack CR, Jr., Jackson EF, Liu G, Russek SE, Sharma SD, Steckner M, Stupic KF, Trzasko JD, Yuan C, Zheng J. Quantitative magnetic resonance imaging phantoms: A review and the need for a system phantom. Magnetic Resonance in Medicine : official journal of the Society of Magnetic Resonance in Medicine / Society of Magnetic Resonance in Medicine. 2017. doi: 10.1002/mrm.26982. PubMed PMID: 29083101.
5. Keenan K. E., Stupic K. F., Boss M. A.,
Russek S. E., Chenevert T. L., Prasad P. V., Reddick W. E., Zheng J., Hu P.,
Jackson E. F. Comparison of T1 measurement using ISMRM/NIST phantom.
Proceedings Title: Proceedings of the International Society of Magnetic
Resonance in Medicine. 2016; ISMRM 24th Annual Meeting, Singapore:3290.
Figures