5622
Accuracy of 2D APT imaging with short acquisition time based on a self B0 correction using the TSE-Dixon methodChiaki Tokunaga1, Tatsuhiro Wada1, Osamu Togao2, Yasuo Yamashita1, Kouji Kobayashi1, and Yoshiyuki Umezu1
1Division of Radiology, Department of Medical Technology, Kyushu University Hospital, Fukuoka, Japan, 2Department of Clinical Radiology, Graduate School of Medical Sciences, Kyushu University, Fukuoka, Japan
Synopsis
The purpose of our study was to investigate the accuracy of amide proton transfer (APT) imaging using the Dixon method. Five samples were prepared from egg white albumin at the different concentration diluted with phosphate buffer solution. We measured APT signal intensities of the phantoms using the conventional method with separate B0 map and the TSE-Dixon method. No statistical significant differences were found among the APT weighted signals measured with the two different acquisition methods at each concentration. The TSE-Dixon method enabled shorter acquisition time and had an equivalent quantitative accuracy compared to the conventional method with separate B0 mapping.
Introduction
Amide proton transfer (APT) imaging was developed as one of the endogenous chemical exchange saturation transfer (CEST) imaging techniques.1,2 Recent studies have shown that APT imaging is useful to predict the grades, assessment the therapeutic response and differentiate radiation necrosis and active/recurrent lesions in gliomas.3-7 The conventional APT imaging needs both CEST sequence with multiple saturation frequency offsets and B0 correction sequence (B0 map). This method was reported to show high accuracy and reproducibility in clinical setteings.8 However, separate B0 mapping method is time-consuming and susceptible to alterations in the B0 distribution between B0 mapping and CEST imaging (e.g. due to a patient’s head movement). Therefore, integrating the B0 mapping with the APT acquisition using the TSE-Dixon method was reported to be time-efficient for clinical use.9 The TSE-Dixon method is possible to overcome the disadvantages for the conventional separate B0 mapping method. The purpose of this study was to investigate the accuracy of APT imaging with self B0 correction using the 2D TSE-Dixon method.Materials and Methods
Five samples were prepared from egg white albumin (Wako Pure Chemical Industries, Japan) at the concentration of 6, 8, 10, 12, 14% diluted with phosphate buffer solution (Wako Pure Chemical Industries, Japan) at pH of 7.2. Experiments were performed on a 3.0-T clinical MR scanner (Achieva 3.0 T-TX, Philips Japan) using an 8-channel head coil. Figure 1 shows the scan parameters of the conventional method and the TSE-Dixon method. The conventional method was consisted of the CEST imaging and the separate B0 mapping. In the TSE-Dixon method, the image acquisition was repeated three times at +3.5 ppm with different echo shifts, as part of the scanning series at seven saturation frequency offsets. The acquisition windows and readout gradients were shifted by -0.4, 0 and +0.4 ms in each acquisition at +3.5 ppm for the Dixon-type B0 mapping. The APT signal intensities were defined as asymmetry of the magnetization transfer ratio (MTRasym) at 3.5 ppm. We measured the APT signal intensities in the egg white albumin samples with different APT imaging. The increase ratio of the APT signal intensities to concentration was defined as the slope of the linear regression. All statistical data analyses were performed with JMP Pro 13 (SAS Institute, Cary, NC, USA). We compared the APT signal intensities among the samples obtained with the two different acquisition methods by one-way analysis of variance (ANOVA) and Tukey’s honestly significant difference (HSD) post hoc test, and assessed the agreement of the APT signal intensity between the two acquisition methods by conducting a Bland-Altman plot analysis.10 P values<0.05 were considered to indicate significant differences.Results
Figure 2 shows the relationship between the concentration and the APT signal intensity measured with the two different acquisitions. The slopes of the linear regression were 0.38 and 0.32 at the conventional method and the TSE-Dixon method, respectively. Figure 3 shows APT weighted images obtained with the two acquisition methods. No statistical significant differences were found among the APT signal intensities measured at the two different acquisition methods at each concentration. The Bland-Altman plot analysis (Figure 4) showed that the mean APT-weighted signals measured with the Dixon method resulted in a small bias of 0.12% and narrow 95% limits of agreement (from -0.01% to 0.26%) with no significant difference (P=0.07) compared to those with the conventional separate B0 map acquisition method.Discussion
The APT signal intensities positively correlated with the concentration of egg white albumin in both the conventional method and the TSE-Dixon method. The Bland-Altman plot in the present study showed that the APT signal intensities obtained with the TSE-Dixon method were not significantly different from those with the conventional separate B0 map acquisition method. The APT acquisition method using TSE-Dixon method can correct B0 by itself, while maintaining the scan time efficiency. This method could be useful for imaging patients and organs with many movements.Conclusion
The TSE-Dixon method enabled shorter acquisition time and had an equivalent quantitative accuracy compared to the conventional APT imaging with separate B0 map acquisition.Acknowledgements
No acknowledgement found.References
- Zhou J, Payen JF, Wilson DA, Traystman RJ, van Zijl PC. Using the amide proton signals of intracellular proteins and peptides to detect pH effects in MRI. Nat Med 2003;9:1085–1090.
- Zhou J, Lal B, Wilson DA, Laterra J, van Zijl PC. Amide proton transfer (APT) contrast for imaging of brain tumors. Magn Reson Med 2003;50:1120–1126.
- Zhou J, Blakeley JO, Hua J, Kim M, Laterra J, Pomper MG, van Zijl PC. Practical data acquisition method for human brain tumor amide proton transfer (APT) imaging. Magn Reson Med 2008;60:842–849.
- Togao O, Yoshiura T, Keupp J, et al. Amide proton transfer imaging of adult diffuse gliomas: correlation with histopathological grades. Neuro Oncol 2014;16:441–448.
- Sakata A, Okada T, Yamamoto A, et al. Grading glial tumors with amide proton transfer MR imaging: different analytical approaches. J Neuro-Oncol 2015;122:339–348.
- Sagiyama K, Mashimo T, Togao O, et al. In vivo chemical exchange saturation transfer imaging allows early detection of a therapeutic response in glioblastoma. Proc Natl Acad Sci U S A 2014;111:4542–4547.
- Zhou J, Tryggestad E, Wen Z, et al. Differentiation between glioma and radiation necrosis using molecular magnetic resonance imaging of endogenous proteins and peptides. Nat Med 2011;17:130–134.
- Togao O, Hiwatashi A, Keupp J, et al. Scan-rescan reproducibility of parallel transmission based amide proton transfer imaging of brain tumors. J Magn Reson Imaging 2015;42:1346–1353.
- Togao O, Keupp J, Hiwatashi A, et al. Amide Proton Transfer Imaging of Brain Tumors Using a Self-Corrected 3D Fast Spin-Echo Dixon Method: Comparison With Separate B0 Correction. Magn Reson Med 2017; 77(6):2272-2279.
- Bland JM, Altman DG. Statistical methods for assessing agreement between two methods of clinical measurement. Lancet 1986;1:307–310.
Figures

Figure 1. Scan
parameters of the conventional method and the TSE-Dixon method.

Figure 2. The
relationship of the APT signal intensity and the concentration of egg white
albumin between the conventional method and the Dixon method.
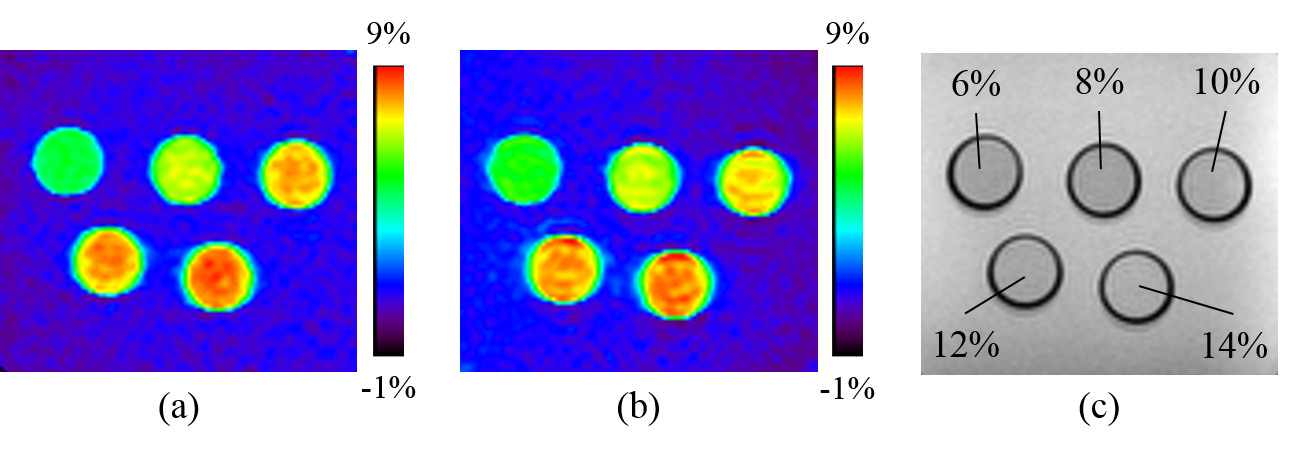
Figure 3. The
APT images acquired two different methods: (a) the conventional method and (b) the
TSE-Dixon method, and (c) the T1 weighted image of phantoms.

Figure 4. The Bland-Altman
plot analysis of the comparison between the conventional method and the TSE-Dixon
method.