5620
Magnetization Transfer contrast in in-vivo Locus Coeruleus and Substantia Nigra compared to a Neuromelanin phantomStan C. J. van Boxel1, Nikos Priovoulos1, Heidi I.L. Jacobs1,2,3, Benedikt A. Poser2, and Dimo Ivanov2
1Faculty of Health, Medicine and Life science, Alzheimer Center Limburg, Maastricht University, Maastricht, Netherlands, 2Department of Cognitive Neuroscience, Faculty of Psychology and Neuroscience, Maastricht University, Maastricht, Netherlands, 3Department of Radiology, Division of Nuclear Medicine and Molecular Imaging, Massachusetts General Hospital/Harvard Medical School, Boston, MA, United States
Synopsis
Magnetization Transfer (MT) MRI has proven valuable in imaging the Locus Coeruleus (LC) and Substantia Nigra (SN). The MT contrast in the LC and SN is assumed to be caused due to the accumulation of neuromelanin. An agar-based phantom containing samples of two neuromelanin models was compared to the in vivo human LC and SN. MT spectra and relaxation times of the phantom, LC and SN were measured. While LC and SN show less MT effect, the phantom does not show neuromelanin-specific MT contrast, suggesting that these models are not representative of the in vivo LC and SN.
Introduction
The Locus Coeruleus (LC) and Substantia Nigra (SN) are neuromelanin (NM) rich nuclei in the brain that are suggested to play a role in the pathology of several neurodegenerative diseases such as Alzheimer’s and Parkinson’s disease1-4. We have recently shown that Magnetization Transfer (MT) MRI provides good contrast in the LC5. Knowledge of the source of contrast is important for the development of a quantitative LC-atrophy estimation method. NM is thought to be the main contributor to the LC/SN-specific MT contrast. In this study, we extend our previous work by comparing the MT properties of an in vivo human LC and SN with measurements on an agar-based phantom containing two commonly used NM models, with the ultimate goal to investigate the MT effect of NM and assess the validity of the phantom.Methods
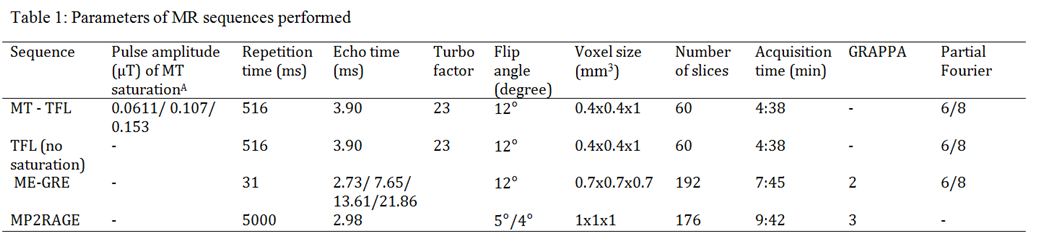
MR data from an agar-based phantom containing variable concentrations (0-3 mg/ml) of natural Sepia melanin (M2649, all chemicals from Sigma Chemical Co.) and synthetic Cys-Dopa-Melanin (DAM, synthesized by auto-oxidizing Dopamine (H8502) in the presence of L-Cysteine (168149), and a healthy volunteer (female, 23), were acquired on a 3T Prisma scanner (Siemens Healthineers, Erlangen, Germany). An MT-weighted Turbo Flash (MT-TFL) sequence was acquired, consisting of a multi-shot 3D readout with center-out k-space sampling preceded by a train of off-resonant Gaussian sinc pulses, with adjustable amplitudes and offset frequencies (FO)5,6. Matching non-MT-TFL images were acquired to obtain MT-ratio images, and monitor the heating of the phantom. A multi-echo gradient echo (ME-GRE) scan and an MP2RAGE were acquired to determine T1 and T2* relaxation times. All acquisition parameters are listed in detail in Table 1. MT acquisitions on the phantom were corrected for linear signal changes due to temperature increase, by scaling the data relative to the signal increase in the non-MT scans that were acquired throughout the session. The MTR maps were further corrected by linear scaling for B1 bias7,8. Hyperintense voxels in the LC and SN region were selected manually and compared with a similar-sized reference ROI (Pontine Tegmentum). Similarly, melanin and reference ROIs were drawn and compared in the phantom.Results
The LC showed less MT compared to the reference in the 200-4000Hz FO range, as well as the SN in the 1000-4000Hz FO range. No melanin-specific MT effects were found on either of the melanin models in the phantom (Figure 1). The SN shows less MT relative to its direct environment (though limited contrast compared to the reference ROI). Both NM models show a decreasing T1 and T2* with increasing concentration (Figure 3). The LC shows a longer T1 and no difference in T2* compared to the reference ROI, while the SN shows no effect on T1 and a shorter T2* relative to the reference ROI (Figure 2).Discussion
In this study, we examined for the first time the MT spectrum of an in vivo LC and compared it to the SN and NM phantoms; this was made feasible by employing a high-resolution MT-TFL sequence. Decreased MT was found in LC and SN, while the NM phantoms did not show such an effect (Figure 1). Furthermore, NM models showed T1 and T2* shortening depending on concentration, which was not reproduced in the in vivo LC and SN. This may imply that melanin models are not representative of real NM or that NM is not causing the MT contrast in LC and SN. SN showed more MT compared to LC, especially in the lower range of MT spectrum (200-1000Hz), which may imply a wider direct saturation spectrum; this is in accordance with the shorter T1 in SN (Figure 3). Finally, the LC showed less MT compared to reference, despite the fact that an increased T1 free was found9. This may imply that a fast T1 bound or decreased pool-size-ratio is present in LC, which could result in fast loss of saturation of macromolecular spins10.Conclusion
In this study we managed for the first time to acquire the MT spectrum of LC and compare it to SN and NM phantoms. The LC showed a distinct MT spectrum compared to other surrounding structures, including the (also catecholaminergic) SN. Nevertheless, our findings on the phantom may challenge the assumption that NM is the cause of the MT decrease in the LC and SN, or imply that the models are not representative of the in vivo LC and SN. Postmortem and phantom studies with real NM are needed to get conclusive evidence. Characterizing the LC MT spectrum is important to examine its usability as biomarker for neurodegenerative diseases.Acknowledgements
This work is supported by an NWO VENI [016.158.084] to HILJ and NWO VIDI [016. 178.052] to BAP. The authors thank Harald Moeller and Andre Pampel for helpful discussions regarding MT measurements.References
References: 1. Fearnley J.M., Lees A.J. Ageing and Parkinson’s disease: substantia nigra regional selectivity. Brain. 1991;114(PT5):2283-2302. 2. Marcyniuk B, Mann D, and Yates P. The topography of cell loss from locus caeruleus in Alzheimer's disease. Journal of the Neurological Sciences. 1986;76(2):335-345. 3. Busch C, Bohl J, and Ohm TG. Spatial, temporal and numeric analysis of Alzheimer changes in the nucleus coeruleus. Neurobiology in Aging. 1997;18(4):401-406. 4. Braak H, and Del Tredici K. Alzheimer's pathogenesis: is there neuron-to-neuron propagation? Acta Neuropathologica. 2011;121(5):589-595. 5. Priovoulos, N. J., Jacobs, H. I. L., Ivanov, D., Uludag, K., Verhey, F. R. J., Poser, B. A. High-resolution in vivo imaging of human locus coeruleus by Magnetization Transfer MRI at 3T and 7T. Neuroimage. 2017;ISSN 1053-8119. 6. Ropele, S., Filippi, M., Valsasina, P., Korteweg, T., Barkhof, F., Tofts, P. S., Fazekas, F. Assessment and correction of B1-induced errors in magnetization transfer ratio measurements. Magnetic Resonance in Medicine. 2015;53(1):134-140. 7. Samson, R. S., Wheeler-Kingshott, C. A., Symms, M. R., Tozer, D. J., Tofts, P. S. A simple correction for B1 field errors in magne- tization transfer ratio measurements. Magnetic Resonance Imaging. 2006;24(3):255-263. 8. Henkelman, R. M., Huang, X., Xiang, Q. S., Stanisz, G. J., Swanson, S. D., Bronskill, M. J. Quantitative interpretation of magnetiza- tion transfer. Magnetic Resonance in Medicine. 1993;29(6):759-766. 9. Trujillo, P., Summers, P. E., Ferrari, E., Zucca, F. A., Sturini, M., Mainardi, L. T., Costa, A. Contrast mechanisms associated with neuromelanin-MRI. Magnetic Resonance in Medicine. 2016;epub. 10 Langley, J. Huddleston, D. E., Chen, X., Sedlacik, J., Zachariah, N., Hu, X. A multicontrast approach for comprehensive imaging of substantia nigra. Neuroimage. 2015;112:7-13.Figures
Note: Abbreviations: MT=
Magnetization Transfer, TFL= Turbo Flash, ME-GRE = Multi Echo Gradient Echo,
MP2RAGE= Magnetization Prepared 2 Rapid Acquisition Gradient Echoes, MPRAGE=
Magnetization Prepared Rapid Gradient Echo, A = refers to the
continuous wave power equivalent of the saturation train. The saturation
sequence consisted of 20 pulses with bandwidth = 250 Hz and ranging from
500Hz to 10KHz off-resonance
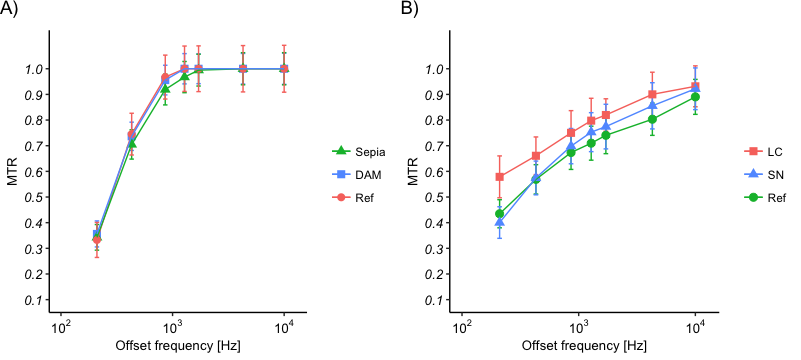
Figure 1: Phantom and in vivo MT spectra (MT pulse amplitude = 0.107 μT, error bars
represent the standard deviation). A) Comparison of Sepia and DAM (concentration
= 3 mg/ml) with a reference ROI (Ref) in agar; B) Comparison of the LC and SN
with the reference ROI.
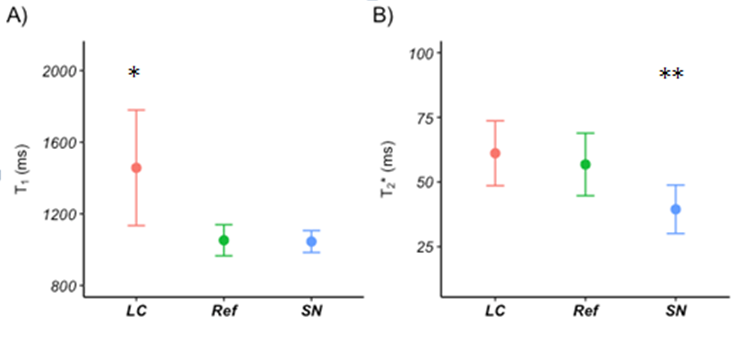
Figure 2: T1 (A) and T2*
(B) relaxation times of the LC and SN compared with a reference ROI (error bars
represent the standard deviation). *
significant difference with the reference ROI (independent t-test,
t(24.65)=-5.69, p<0.001),
** significant difference with the reference ROI
(independent t-test, t(323.23)=-17.99, p<0.001).
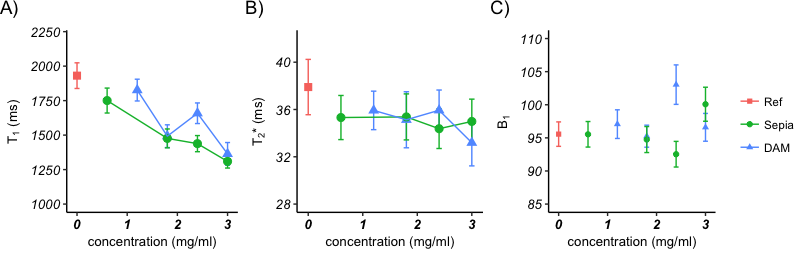
Figure 3:
T1 (A) and T2*
(B) times of the phantom ROIs containing different melanins at varying concentration
compared with a reference ROI in the agar (error bars represent the standard
deviation). Measurements are not corrected for B1 differences (C)
which should be taken into account when interpreting graph A and B.