5619
Simultaneous T1/T2 Mapping of Hyperpolarized 13C Compounds using the bSSFP Sequence1Radiology and Biomedical Imaging, UCSF, San Francisco, CA, United States, 2GE Healthcare, Dallas, TX, United States
Synopsis
Hyperpolarized 13C imaging development has enabled monitoring of different physiological processes, such as metabolism and perfusion, in various diseases, such as cancer and diabetes. The relaxation parameters T1 and T2 are essential in sequence optimization and modeling, and can be used for assessment of healthy versus diseased tissue. The goal of this project was to develop and apply simultaneous in vivo T1 and T2 mapping of hyperpolarized 13C probes using bSSFP sequence. Results indicated multiple approaches can be used to obtain high resolution T1 and T2 maps.
Introduction
The development of hyperpolarized (HP) 13C imaging has enabled monitoring of various physiological processes, including metabolism and perfusion, for a wide range of diseases.1–3 T1 and T2 are important parameters for pulse sequence optimization4, calculations of rate constants such as kPL, and can also be used for assessment of healthy versus diseased tissue, as is commonly done in 1H imaging. While high spatial resolution T2 mapping has been recently developed,5,6 T1 values for 13C compounds are reported on a non-localized basis. In this study, we aimed to develop and apply simultaneous in vivo T1 and T2 mapping of multiple hyperpolarized 13C probes using the balanced steady-state free precession (bSSFP) sequence.Methods
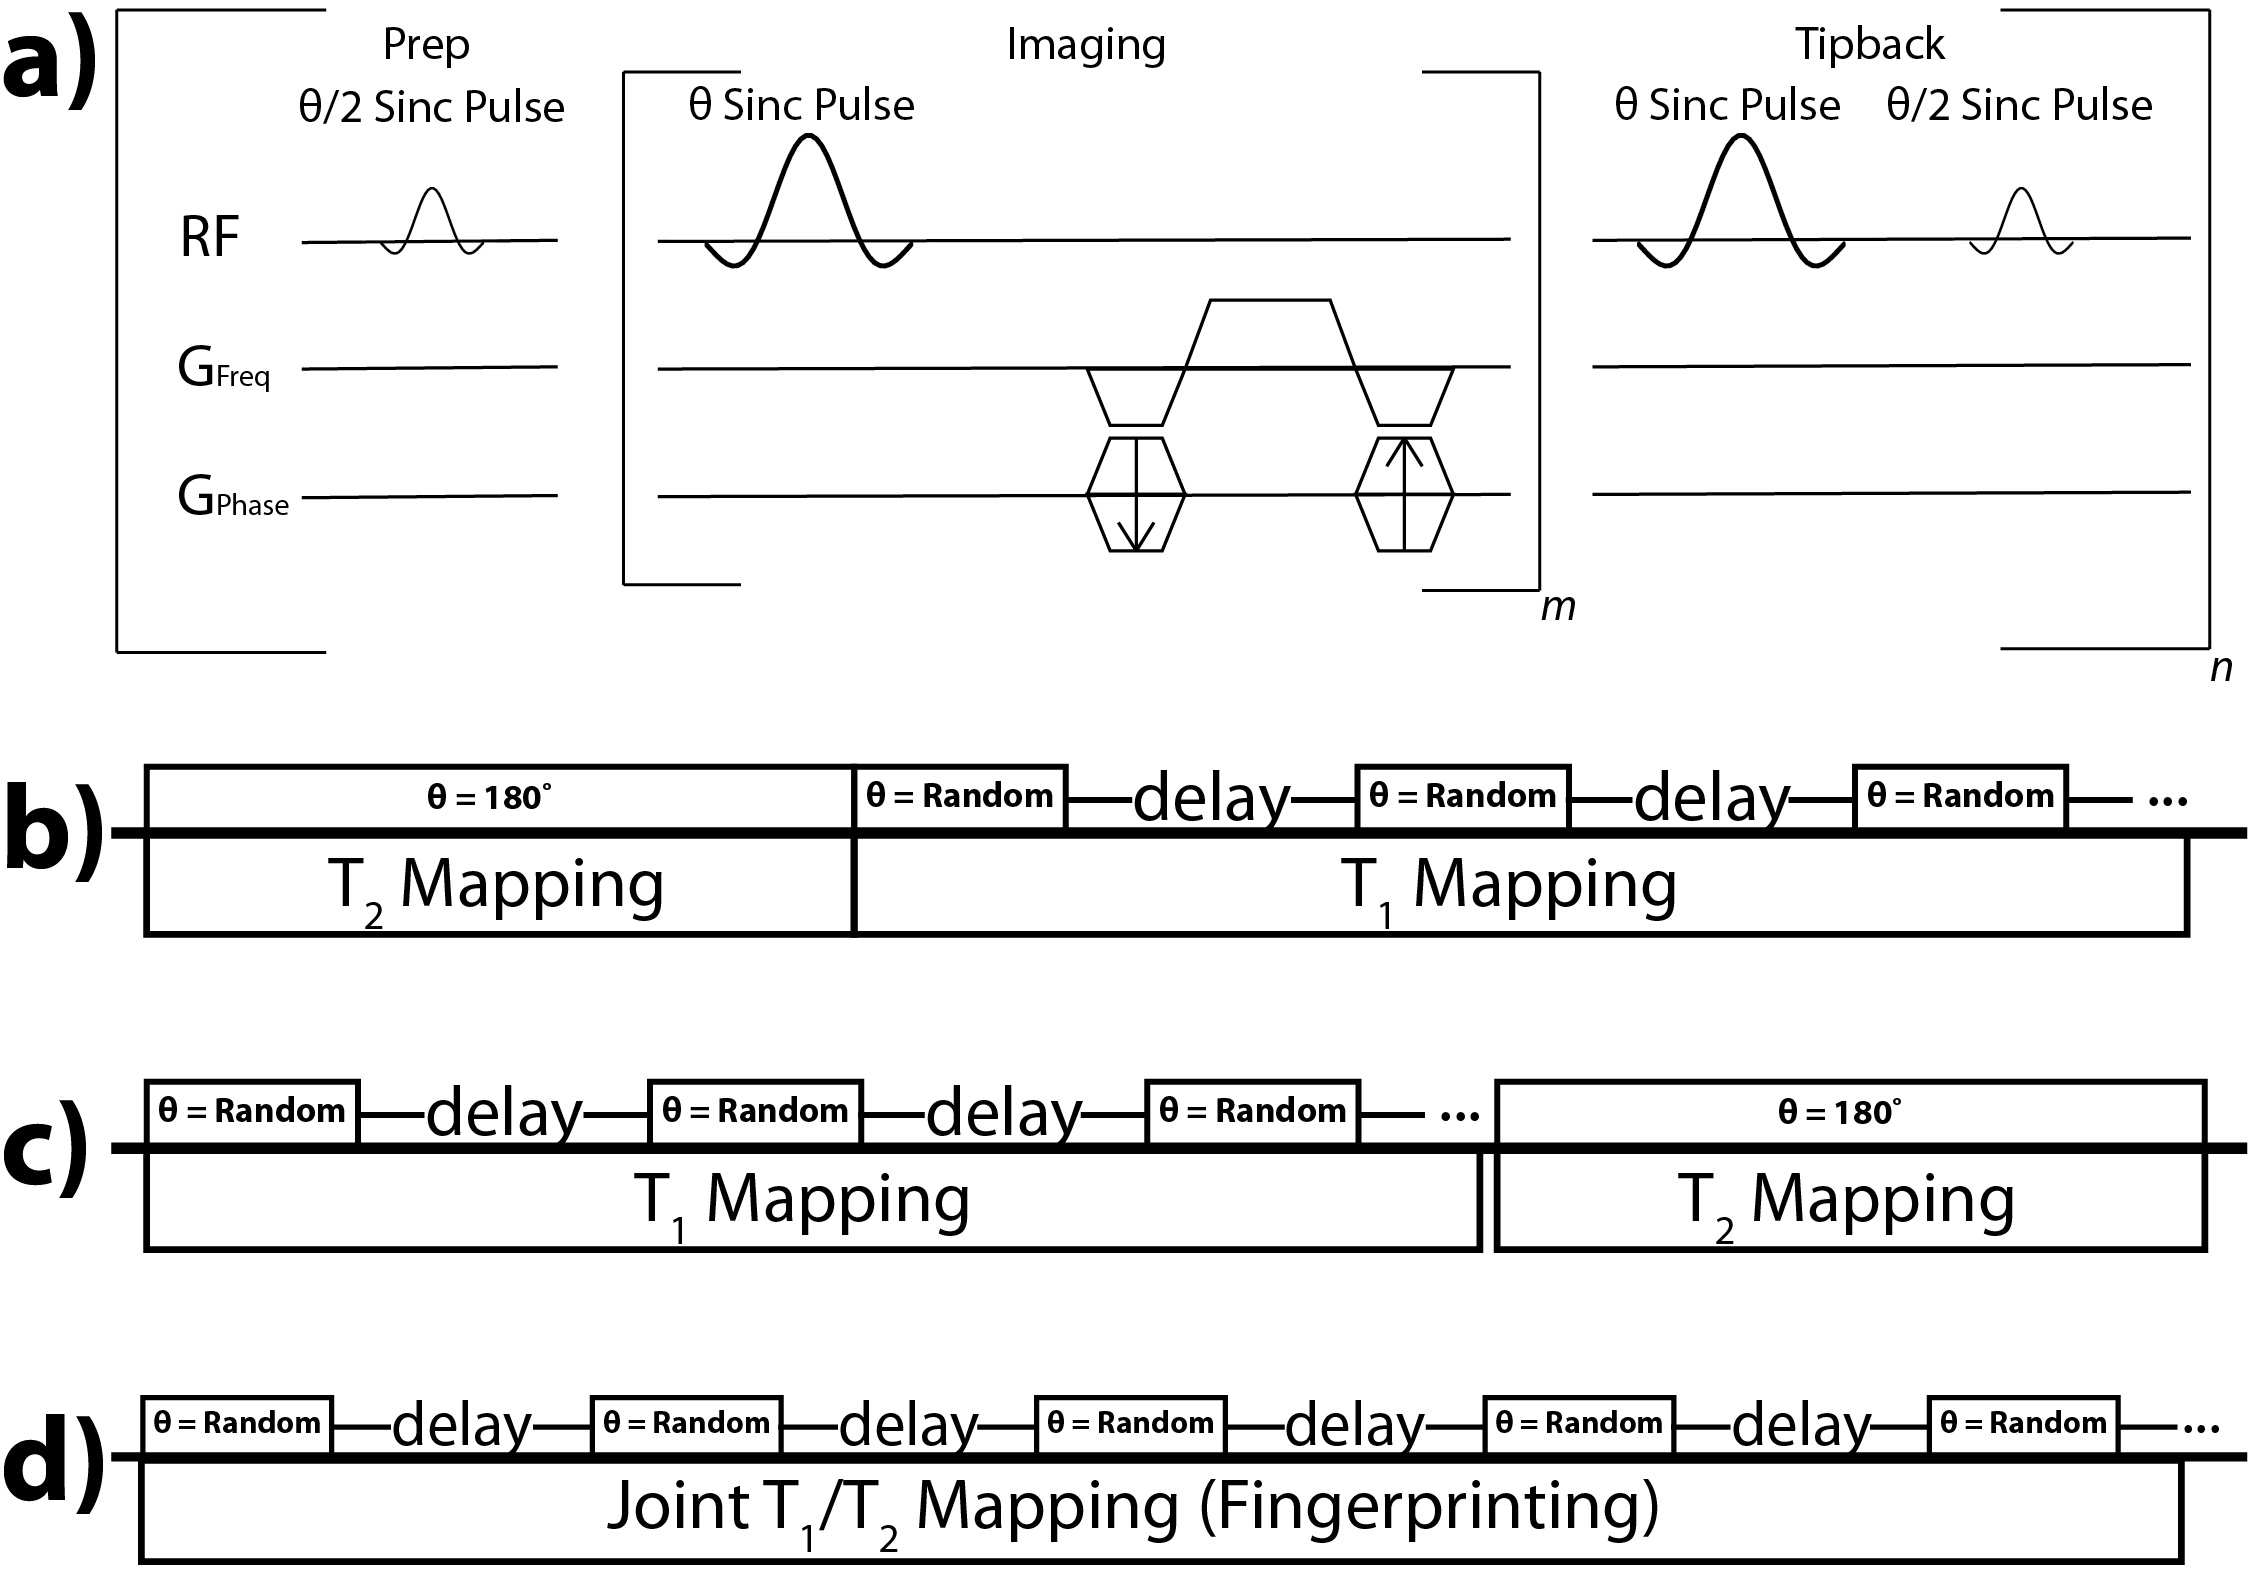
A custom bSSFP sequence was developed for this study,6 whereby each acquisition consisted of one of two approaches (Figure 1): either two independent scanning modules (dual module) or modified MR fingerprinting.7,8 The dual module approach featured one T2 mapping module6 and one T1 mapping module, which involved using delays between imaging, whereby the magnetization tipped back onto the longitudinal axis after imaging would decay by T1. Initial studies utilized both constant and variable delays and constant and variable flip angles during the T1 mapping module, to investigate potential in vivo SNR limitations and consequent signal fitting. The MR fingerprinting approach involved random delays and flip angles throughout the entire acquisition. The signal train for each approach can be modeled using the bSSFP signal equation developed by Scheffler9:
$$M_{xy,n}=M_{z,0} sin\frac{θ}{2} (E_1 (cos\frac{θ}{2})^2+E_2 (sin\frac{θ}{2})^2)^n$$
where θ is the flip angle, E1=exp(-TR/T1), E2=exp(-TR/T2), and n is the pulse number (i.e. phase encode). During the delay portion of the T1 mapping module the magnetization decays by exp(-delay/T1).
The fitting procedure was done on a voxel-by-voxel basis in Matlab for both approaches. For the dual module approach, T1 and T2 were fit via least-squares based on the signal equation above. For the MR fingerprinting approach, T1 and T2 were fit using dictionary matching via the maximum inner product method, where the dictionary was created with a range of T1’s, T2’s, and B1’s.
The experiments were conducted on a 3T GE MR scanner. All in vivo acquisitions were acquired as coronal projections and featured the following parameters: 14x7cm2 FOV, 1.25x1.25-4x4mm2, 5.6-6.4ms TR, scans starting at 30s after start of injection. For some experiments, individual low flip angle EPI10 and bSSFP T2 maps5,6 were acquired for comparison. DNP experiments used a HyperSense polarizer, and 100mM HP001, 110mM [13C]urea, 110mM [13C,15N2]urea, and 80mM [2-13C]pyruvate was injected over 12s via tail vein catheters in normal Sprague-Dawley rats.
Results
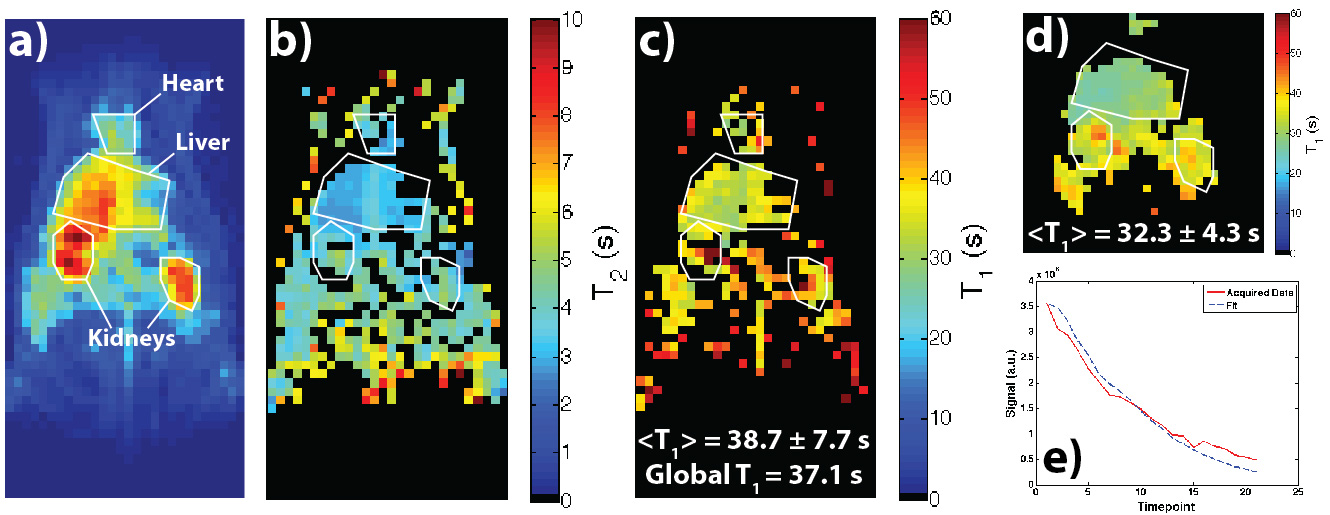
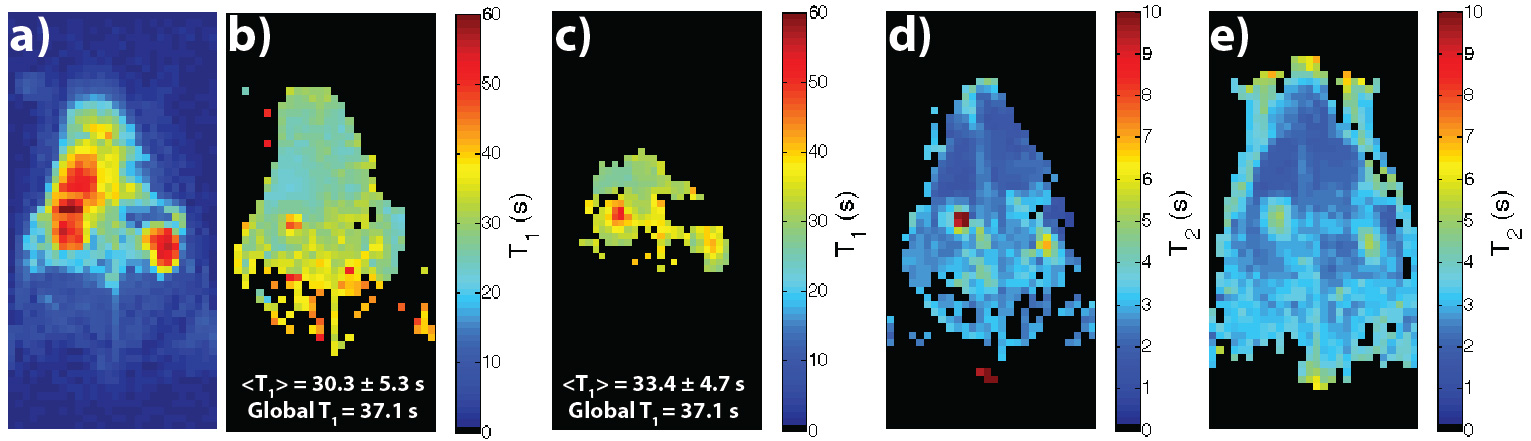
Figure 2 shows results for an HP001 acquisition of the dual module approach (T2 mapping followed by T1 mapping), including a representative time-point (a), T2 map (b), T1 map (c), EPI T1 Map (d), and an example signal fit from a kidney voxel (e). The mean and intra-voxel standard deviation of the T1 map was 38.7±7.7s, matching up well with the global T1 of 37.1s, with the T1 distribution matching well with the EPI T1 map in the abdomen. The relevant anatomical structures are outlined, with the locations being similar in all acquisitions. Figure 3 shows results for an HP001 acquisition of a different iteration of the dual module approach (T1 mapping followed by T2 mapping), including a representative time-point (a), T1 map (b), EPI T1 Map (c), T2 map (d) and bSSFP T2 map (e). The mean and intra-voxel standard deviation of the T1 map was 30.7±5.9s, with the T1 and T2 distribution matching well with the EPI T1 map and bSSFP T2 map, respectively.
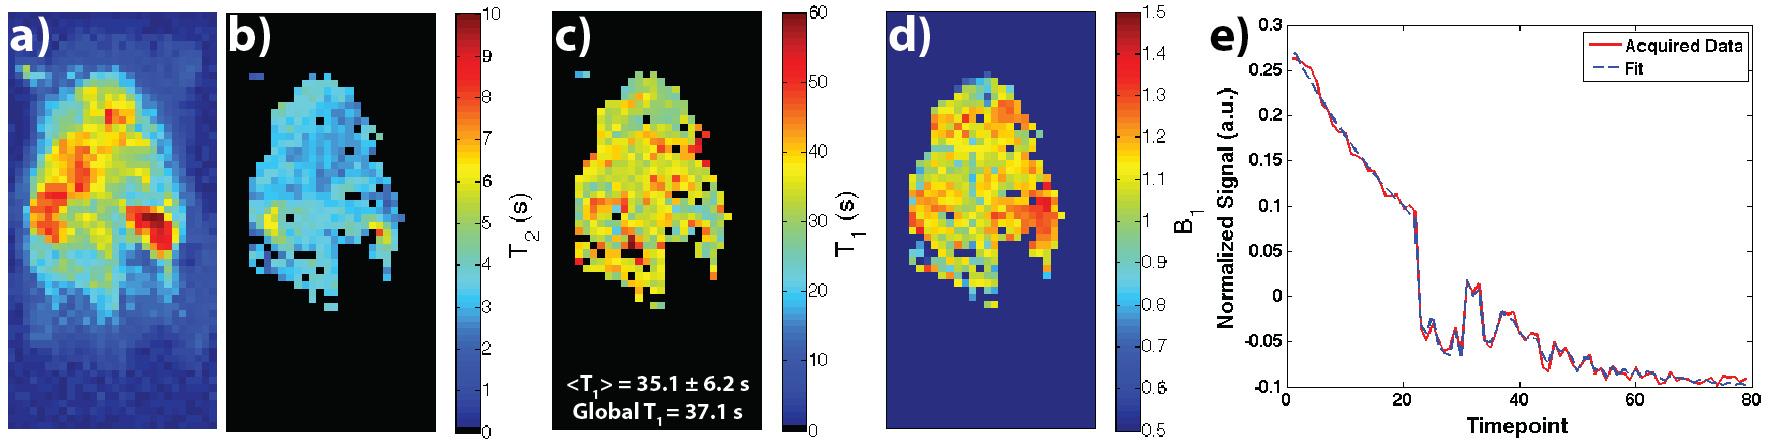
Figure 4 shows results for an HP001 acquisition of the MR fingerprinting approach, including a representative time-point (a), T2 map (b), T1 map (c), B1 Map (d), and an example signal fit from a kidney voxel (e). The mean and intra-voxel standard deviation of the T1 map was 35.1±6.2s. The additional B1 map calculated with this approach matched up with the expected coil profile for a rat heart/abdomen acquisition.
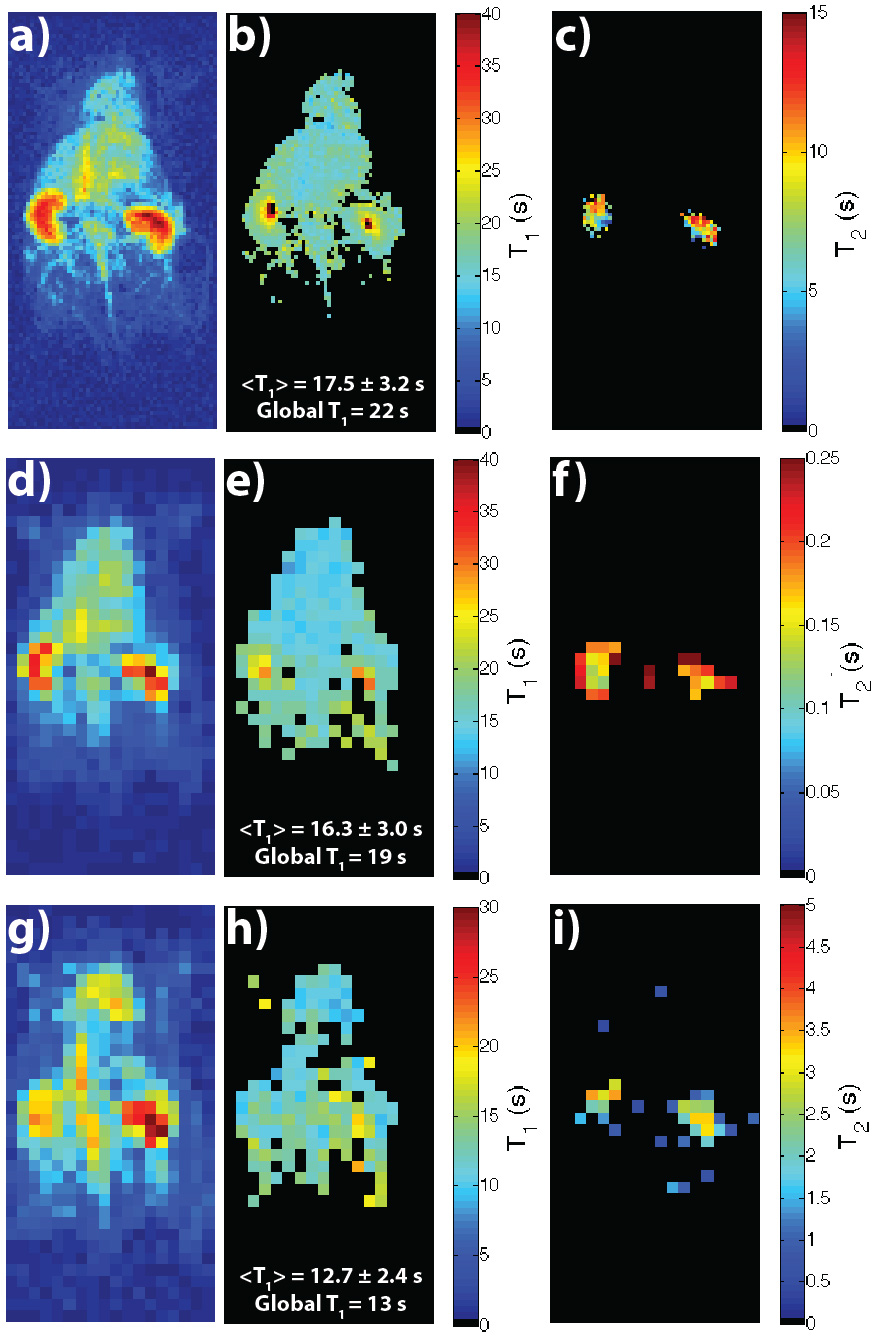
Figure 5 shows results from other compounds, with the global T1 being close to or within the mean and intra-voxel standard deviation of the T1 map, and T2 maps matching up with previously acquired maps.5,6
Conclusion
In this study, we developed a framework for simultaneous in vivo T1 and T2 mapping with HP 13C compounds using a specialized bSSFP sequence, with two different approaches successfully tested. Future work will focus on optimizing the acquisitions for each compound, incorporating compressed sensing11,12 to improve spatial resolution, and accounting for dynamic changes in T1 and T2 via metabolism and renal filtration.Acknowledgements
NIH grants R01EB017449 and P41EB013598.References
1. Kurhanewicz, J. et al. Analysis of cancer metabolism by imaging hyperpolarized nuclei: prospects for translation to clinical research. Neoplasia 13, 81–97 (2011).
2. Von Morze, C. et al. Simultaneous Multiagent Hyperpolarized 13C Perfusion Imaging. Magn. Reson. Med. 72, 1599–1606 (2014).
3. Chen, H. Y. et al. Assessing prostate cancer aggressiveness with hyperpolarized dual-agent 3D dynamic imaging of metabolism and perfusion. Cancer Res. 77, 3207–3216 (2017).
4. Shang, H. et al. Variable Flip Angle Design for Balanced SSFP Transient State Imaging to Improve HP 13C MRI. in Proc. Intl. Soc. Mag. Reson. Med. 23 (2015) 3768.
5. Reed, G. D. et al. High Resolution 13C MRI With Hyperpolarized Urea: In Vivo T2 Mapping and 15N Labeling Effects. IEEE Trans. Med. Imaging 33, 362–371 (2014).
6. Milshteyn, E. et al. Development of high resolution 3D hyperpolarized carbon-13 MR molecular imaging techniques. Magn. Reson. Imaging 38, 152–162 (2017).
7. Ma, D. et al. Magnetic resonance fingerprinting. Nature 495, 187–192 (2013).
8. Buonincontri, G. & Sawiak, S. J. MR fingerprinting with simultaneous B1 estimation. Magn. Reson. Med. 76, 1127–1135 (2016).
9. Scheffler, K. On the transient phase of balanced SSFP sequences. Magn. Reson. Med. 49, 781–783 (2003).
10. Gordon, J. W., Vigneron, D. B. & Larson, P. E. Z. Development of a Symmetric Echo Planar Imaging Framework for Clinical Translation of Rapid Dynamic Hyperpolarized 13C Imaging. Magn. Reson. Med. 1–7 (2016).
11. Tamir, J. I. et al. T2 shuffling: Sharp, multicontrast, volumetric fast spin-echo imaging. Magn. Reson. Med. 77, 180–195 (2017).
12. Doneva, M. et al. Compressed sensing reconstruction for magnetic resonance parameter mapping. Magn. Reson. Med. 64, 1114–1120 (2010).
Figures