5618
T1 and T2 relaxation times of uterus and cervical cancer in vivo at 1.5T1Radiation Oncology, Washington University in St Louis, St Louis, MO, United States, 2Radiation Oncology, Barnes-Jewish Hospital, St Louis, MO, United States
Synopsis
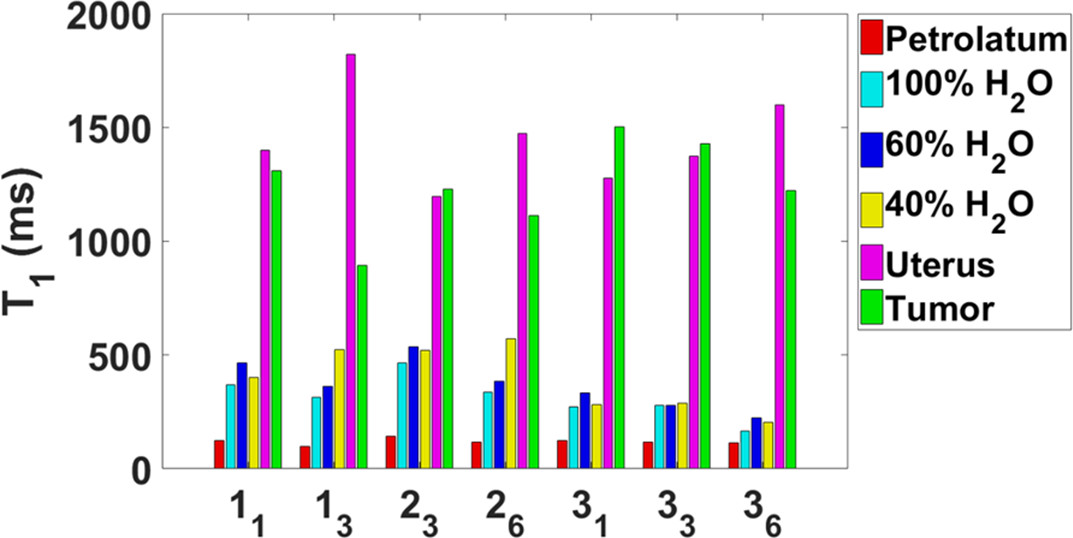
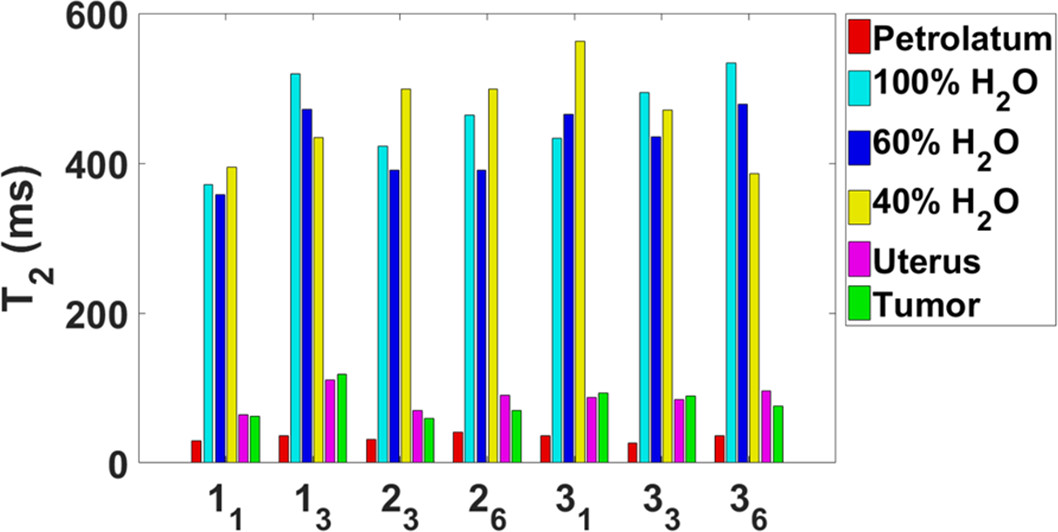
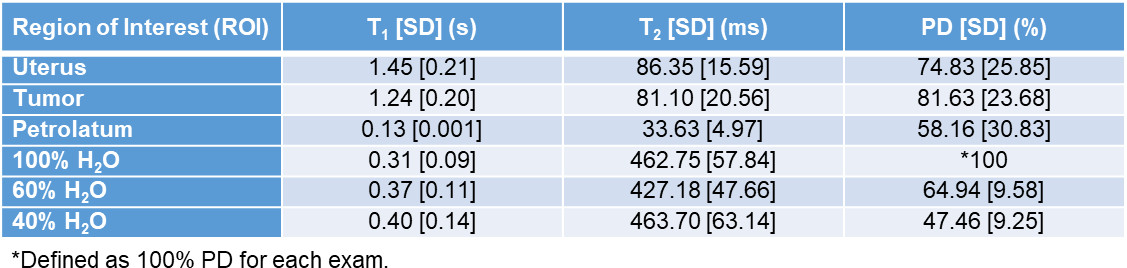
T1 and T2 maps were acquired at 1.5 T in three cervical cancer patients (52.3±9.0 years) receiving brachytherapy and external beam radiation therapy. Measurements occurred at weeks 1, 3, and 6, where possible. The average T1 values were 1448.2 ± 209.1ms in the uterus and 1242.9 ± 202.4 ms in the tumor tissue (cervical carcinoma). The average T2 values were 86.4 ± 15.6 ms in the uterus and 81.1 ± 20.6 ms in the tumor. There was no significant difference in the T1 and T2 in the uterus and tumor based on an analysis of variance.
Purpose
Delineation of tumors from adjacent organs on MRI requires knowledge of tissue relaxation times and proton densities to optimize contrast-to-noise. The aim of this study was to measure T1, T2, and proton density (PD) in cervical cancer at 1.5 T since there are no published values.Methods
Three radiation therapy patient volunteers with cervical carcinoma (mean age 52.3 ± 9.0 years) received MRI relaximetry during MRI simulations. The patients received external beam radiation and six weekly fractions of tandem/ovoid brachytherapy. Relaximetry measurements were scheduled for simulations for Weeks 1, 3, and 6. However, Volunteers 1 and 2 were only imaged twice. Volunteers were scanned on a 1.5T Philips Ingenia MRI. One petrolatum phantom and three D2O/H2O proton density phantoms (100%, 60% and 40% H2O, doped with 2 mM NiSO4) were placed inside the field of view.
B1 fits were acquired using a 2D turbo spin echo (TSE) sequence (TE/TR: 15 ms/4 s, slice thickness/gap: 5/0 mm, Matrix: variable, 50 slices, flip angles (FAs): 450 and 900). The flip angle correction (c) was calculated using the signals from the two flip angle images (Sθ and S2θ):
$$c(\overrightarrow{r})=\frac{4}{\pi}acos[0.5\cdot\frac{S_{2\theta}(\overrightarrow{r})}{S_{\theta}(\overrightarrow{r})}]$$
T1 fits were acquired using a variable flip angle 3D FLASH sequence (TE/TR: 2 ms/4 ms, slice thickness/gap: 5/0 mm, Matrix: variable, 40-50 slices, FAs (θinput): 2°, 5°, 10°, 15°, 20°, and 25°). T1 was calculated using the actual flip angle $$$\theta_{act}(\overrightarrow{r})=\theta_{input}\cdot c(\overrightarrow{r})$$$, and the FLASH signals (SFLASH):
$$ S_{FLASH}\left(\overrightarrow{r}\right)=A\left(\overrightarrow{r}\right)\cdot\sin\left[\theta_{act}\left(\overrightarrow{r}\right)\right]\frac{1-\exp\left[-TR/T_{1}\left(\overrightarrow{r}\right)\right]}{1-\cos\left[\theta_{act}\left(\overrightarrow{r}\right)\right]\exp\left[-TR/T_{1}\left(\overrightarrow{r}\right)\right]}+B\left(\overrightarrow{r}\right) $$
T2 fits were acquired using a multislice 2D Carr Purcell Meiboom Gill (CPMG) sequence (TEs: n·40 ms (n=1-8), TR: variable, slice thickness/gap: 5/0 mm, Matrix: variable, 12, 25 and 30 slices). T2 and PD (ρ) were calculated using a three-parameter fit to the CPMG signal ($$$S(\overrightarrow{r})$$$):
$$ S\left(\overrightarrow{r}\right)=D\left(\overrightarrow{r}\right)\cdot\exp\left[-\frac{TE}{T_{2}\left(\overrightarrow{r}\right)}\right]+E\left(\overrightarrow{r}\right) $$
The fitting parameter D includes the proton density (ρ), B1 inhomogeneity (c) and coil/system sensitivity (g):
$$ D\left(\overrightarrow{r}\right)=\rho\left(\overrightarrow{r}\right)\cdot\sin\left[c\left(\overrightarrow{r}\right)\frac{\pi}{2}\right]\cdot g\left(\overrightarrow{r}\right)\approx\rho\left(\overrightarrow{r}\right)\cdot\sin\left[c\left(\overrightarrow{r}\right)\frac{\pi}{2}\right]\cdot g $$
the rightmost equation assumes the prescan normalization removed the spatial dependence of g.
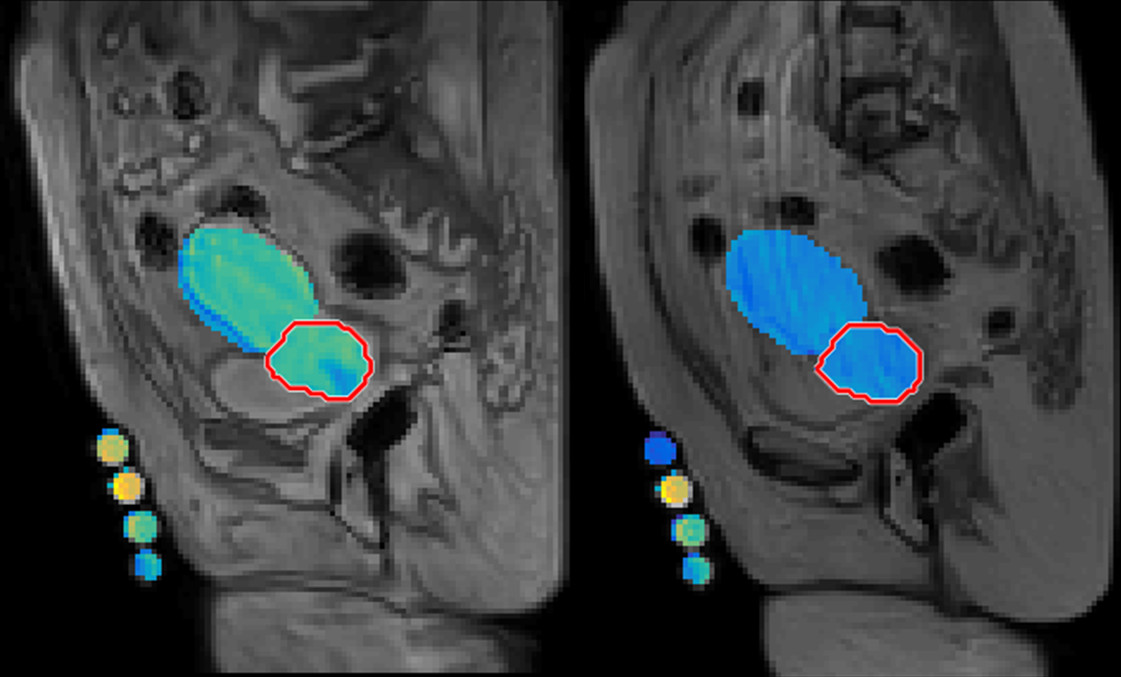
Gross tumor volume (GTV) and healthy tissue regions of interest (ROIs) were extracted from contours registered to high-resolution PD-weighted (PDW) TSE MRIs (TE/TR = 5.5 ms/variable, slice thickness/gap: 2.5/0 mm) during treatment planning, and co-registered to the B1, T1, and T2 images. B1, T1, and T2 were calculated for each tissue and phantom ROI within a single slice, not pixel-by-pixel.
Results
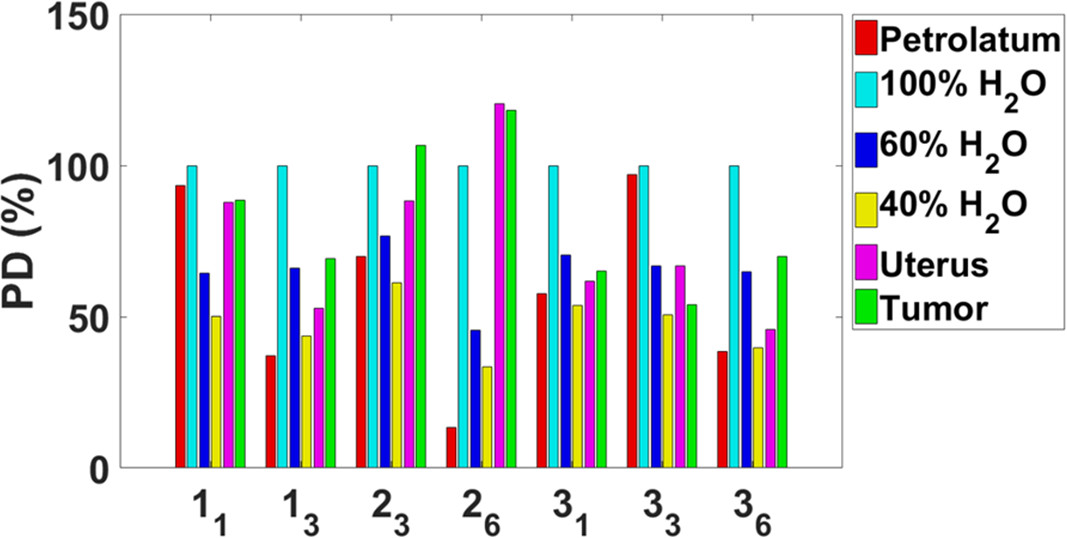
T1, T2, and PD values are shown in Figures 2-4. The results represent measurements from a central slice while avoiding the tandem. T1, T2, and PD averaged over all volunteers and scans are summarized in Table 1. An analysis of variance (ANOVA) indicated no significant differences between the uterus and tumor for T1, T2, or PD (p>0.05).Discussion
For each patient, T1 values increased for the uterus during treatment and decreased for the GTV. Changes in T2 values varied across patients. T1 and T2 relaxation times measured in the uterus were consistent with a previous study.1 Only one study on the T1 and T2 of cervical cancer in vivo has been published but the measurements were conducted at <0.5 T.2 Cervical cancer is hyperintense on PDW and T2W MRI relative to uterus at the beginning of radiotherapy, implying that T2 and/or PD of cervical cancer is longer than uterus.
We are still recruiting patients for this study but recruitment is challenging due to the discomfort associated with the MRI simulation immediately after implantation of the tandem/ovoids. Another major confounding factor is motion artifacts.
T1 values were derived only from the central slices to avoid errors from slab selection inhomogeneity.3 However, we can derive and correct the slab excitation profile using the petrolatum phantom to obtain measurements in additional slices.4
The T1 values calculated from FLASH for the D2O/H2O phantoms were significantly lower than our inversion recovery TSE (IR-TSE) measurements (T1 ~1 s) and the T2. We assume the underestimations are from fluid motion during the FLASH acquisitions since the petrolatum phantom T1 values were consistent. The PD values were high for the 40% and 60% standards because the phantoms were topped off with distilled water due to evaporation. We estimate the true values to be 58% and 65% assuming an equivalent rate of evaporation, consistent with the MRI fits.
Conclusion
These are the first 1.5 T measurements of T1, T2, and PD of cervical cancer in vivo. The results are preliminary given the small number of volunteers. Additional patient datasets are needed to improve the statistical sensitivity.Acknowledgements
This research was supported by Washington University in St. Louis’s Department of Radiation Oncology.References
1. de Bazelaire CM, Duhamel GD, Rofsky NM, Alsop DC. MR imaging relaxation times of abdominal and pelvic tissues measured in vivo at 3.0 T: preliminary results. Radiology 2004;230(3):652-659.
2. Santoni R, Bucciolini M, Chiostrini C, Cionini L, Renzi R. Quantitative magnetic resonance imaging in cervical carcinoma: a report on 30 cases. Br J Radiol 1991;64(762):498-504.
3. Parker GJ, Barker GJ, Tofts PS. Accurate multislice gradient echo T1 measurement in the presence of non-ideal RF pulse shape and RF field nonuniformity. Magn Reson Med 2001;45(5):838-845.
4. Gach HM, Wang H, Mason NS, Tsien C, Robinson C. B1 inhomogeneity correction for measuring T1 from DCE MRI. 2016 July 31-August 4, 2016; Washington D.C. AAPM. p SU-D-207A-204.
Figures