5617
Single Breath-hold 3D T2-weighted bSSFP Imaging (T2-TIDE) for Treatment Planning on a Low-field MRI-guided Radiotherapy System1Department of Radiological Sciences, University of California, Los Angeles, Los Angeles, CA, United States, 2Physics and Biology in Medicine IDP, University of California, Los Angeles, Los Angeles, CA, United States, 3Department of Radiation Oncology, University of California, Los Angeles, Los Angeles, CA, United States
Synopsis
A T2-transition into driven equilibrium (T2-TIDE) technique along with compressed sensing reconstruction was proposed to generate 3D T2-weighted images in a single breath-hold for radiotherapy treatment planning on a low-field MRI-guided radiotherapy system. Phantom and volunteer studies were performed to determine the optimal parameters that provided the best contrast. Five patients with abdominal tumors were recruited to compare the proposed T2-TIDE technique with the conventional bSSFP approach. Improved tumor/organ contrast
Introduction
Magnetic resonance image (MRI) and MRI-guided radiotherapy (MRgRT) is increasingly accepted in radiation oncology field. For the 0.35T MR-guided tri-cobalt 60 radiotherapy system at our center (ViewRay, Oakwood Village, OH), balanced steady-state free precession (bSSFP) is the primary sequence available for treatment planning. Although bSSFP has the advantages of fast acquisition and high signal-to-noise ratio (SNR) efficiency, the T2/T1 contrast may not be desirable for clinical application where a pure T2-weighting might provide better contrast for tumor and organ delineation1. T2-transition into driven equilibrium (T2-TIDE) technique has been proposed to generate T2 weighting by applying 180˚ flip angle (FA) at the transient stage2. However, due to the specific absorption rate (SAR) limitation at high field (1.5T or higher), variable flip angle strategy with relatively small initial FA (60 ˚) and gradually decreasing FA was usually used3. This will inevitably lead to a loss of T2 contrast and blurring of high-frequency structures. Without concern of SAR at low field, we propose to use the T2-TIDE technique along with compressed sensing to generate 3D T2-weighted images in a single breath-hold.Methods
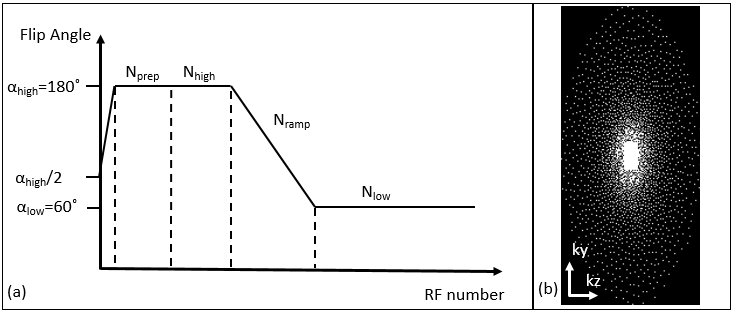
Flip angle scheme used in this study is shown in Figure 1(a). In each shot, a α/2 preparation was used to stabilize the magnetization, then followed by Nprep RF pulses at FA=αhigh to control the T2 weighting. The central Nhigh k-space lines were acquired at αhigh to maintain the T2 contrast. FA was then ramped down to αlow in Nramp pulses and kept at αlow for Nlow pulses. The center 24x12 k-space region was fully sampled and the outer region followed the passion-disk under-sampling pattern as shown in Figure 1(b). In each segment, a centric-out pattern was used to guarantee the central k-space lines were acquired when T2-weighting is strong. L1-ESPRiT was used to reconstruct the under-sampled data4.
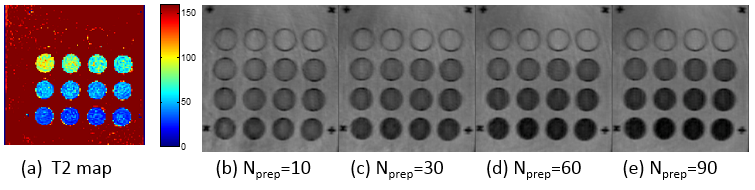
To study the contrast mechanism of the proposed method, a T1-T2 phantom shown in Figure 2(a) was scanned. T2 values were measured using single-echo spin echo sequence with seven TEs from 10ms to 250ms. Effect of Nprep (10, 30, 60, 90), Nhigh (30, 50, 80), Nramp (50, 100), αhigh (180, 120) and αlow (120, 60) were investigated where 30-50-50-180-60 (Nprep-Nhigh-Nramp-αhigh-αlow) was used as the baseline.
One volunteer was recruited to determine an optimal T2-TIDE protocol to be used for the patient study. The standard bSSFP and T2-TIDE with different Nprep (30, 60, 90) were acquired at the end inspiration stage. Detailed imaging parameters are listed in Table 1. Contrast to noise ratio (CNR) between kidney and liver was measured as |Sk-Sl|/σ, where Sk and Sl are signals from kidney and liver, and σ is the standard deviation of background noise. Five patients with abdominal tumors were recruited under IRB approval. Two end-inspiration breath-hold images were acquired using the standard bSSFP and the optimal T2-TIDE protocol determined from the volunteer study.
All studies were performed on the 0.35T MRgRT system.
Results and Discussion
Phantom study indicated that Nprep is the main parameter that controls the T2 weighting. As shown in Figure 2 (b-e), an increased T2-weighting was observed when Nprep was increased from 10 to 90.
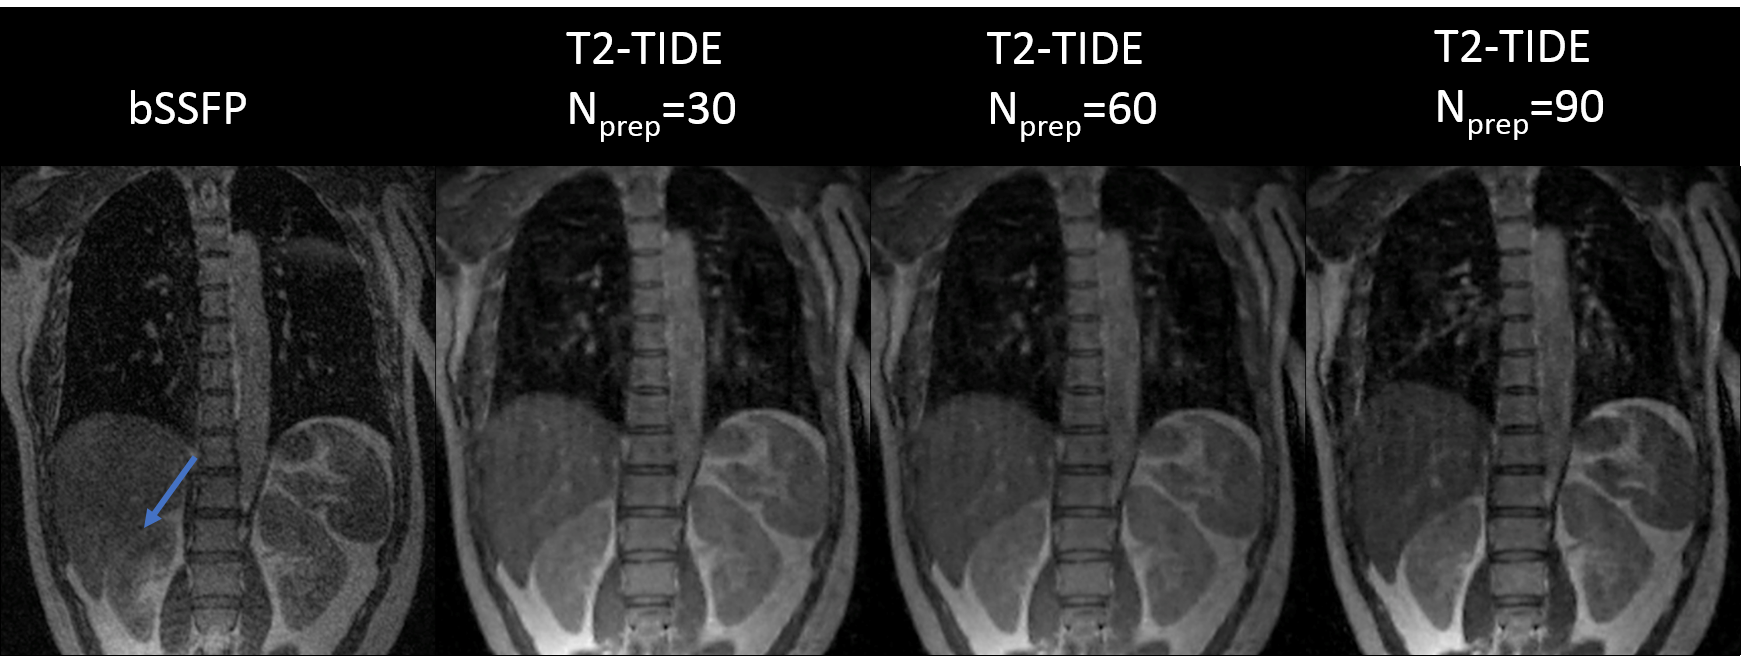
Images from the standard bSSFP and T2-TIDE with Nprep= 30, 60, 90 are shown in Figure 3. Due to the close T2/T1 value of liver and kidney (at 1.5T, the T1 and T2 values for liver are: T1= 576±30ms, T2= 46±6ms, and for kidney are: T1=690±30ms, T2=55±3ms5), the contrast difference between liver and kidney was minimal in bSSFP images. This could cause ambiguity for liver/kidney segmentation. The more T2-weighted T2-TIDE images provided improved contrast between the two organs. CNR between liver and kidney for the four images in Figure 3 were: 3.07, 13.57, 19.31 and 22.96. Therefore, Nprep=90 was chosen in the patient study due to its superior T2-weighting.
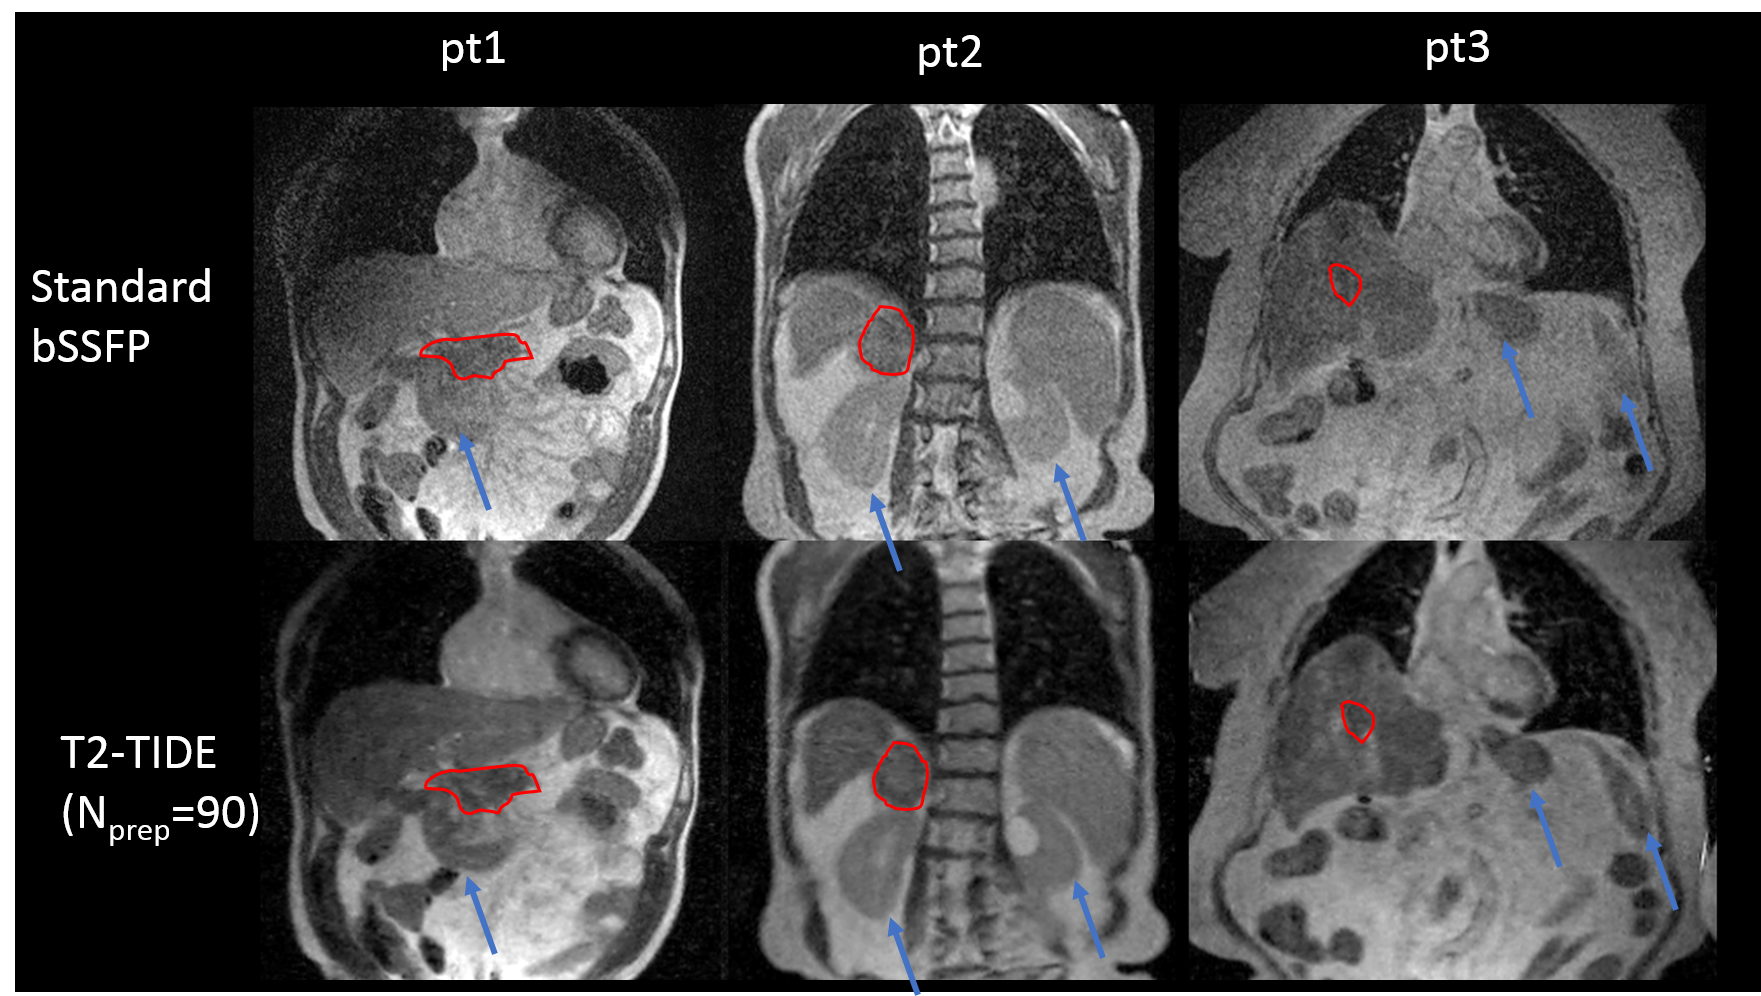
Improved tumor and organ contrast were observed on T2-TIDE images for all five patients. Figure 4 shows the images from three representative patients. Tumor region, as contoured in red, and several normal organs, as indicated by the blue arrows, had improved contrast on T2-TIDE images. Mild blurring was observed on the T2-TIDE images, possibly due to the increased under-sampling rate (12-fold in the T2-TIDE, and 7.5-fold in the bSSFP). Modifications of the sampling pattern and fine-tuning of the reconstruction parameters were underway to provide images with sharper boundary.
Conclusion
In this study, we showed the feasibility of achieving 3D T2-weighted images in a single breath-hold using the T2-TIDE method and compressed sensing reconstruction. The proposed method provided increased contrast for organ and tumor delineation.Acknowledgements
No acknowledgement found.References
1. Schmidt MA, Payne GS. Radiotherapy planning using MRI. Phys Med Biol. 2015;60(22):R323-R361. doi:10.1088/0031-9155/60/22/R323.
2. Paul D, Markl M, Fautz H-P, Hennig J. T2-weighted balanced SSFP imaging (T2-TIDE) using variable flip angles. Magn Reson Med. 2006;56(1):82-93. doi:10.1002/mrm.20922.
3. Srinivasan S, Wu HH, Sung K, Margolis DJA, Ennis DB. Fast 3D T2 -weighted imaging using variable flip angle transition into driven equilibrium (3D T2 -TIDE) balanced SSFP for prostate imaging at 3T. Magn Reson Med. 2015;74(2):442-451. doi:10.1002/mrm.25430.
4. Uecker M, Lai P, Murphy MJ, et al. ESPIRiT-an eigenvalue approach to autocalibrating parallel MRI: Where SENSE meets GRAPPA. Magn Reson Med. 2014;71(3):990-1001. doi:10.1002/mrm.24751.
5. Stanisz GJ, Odrobina EE, Pun J, et al. T1, T2 relaxation and magnetization transfer in tissue at 3T. Magn Reson Med. 2005;54(3):507-512. doi:10.1002/mrm.20605.
Figures