5616
Quantitative Assessment of Early Lens Disease in Type 2 Diabetic Patient Using T1 and T2-Mapping1The affiliated hospital of Chinese traditional medical university, Xian Yang, China, 2Siemens Healthcare, Scientific marketing, Xian Yang, China
Synopsis
This study aimed to explore the feasibility of magnetic resonance T1 and T2 mapping techniques in the evaluation of early complications of lens in type two diabetes mellitus. Patients with type two diabetes mellitus with negative eye slit lamp examination and control group underwent eye MRI scanning, T1 and T2 mapping sequences were collected, and two samples t test was used to analyze the differences of T1 and T2 values between groups. The values of T1 and T2 in diabetic group were significantly higher than those in control group. Magnetic resonance T1 and T2 mapping techniques can detect abnormal lens in diabetic patients with negative slit lamp examination.
Purpose
Diabetic cataract is one of the most important complications of diabetes with increasing rate of incidence and blindness [1]. Slit lamp examination as general method is difficult to detect early abnormal lens in diabetic patients, until irreversible damage happened. Therefore, detecting the early complications of lens is important when the slit lamp examination is negatively. Recently, no effective early detection method is available in clinical application. This study attempts to explore the feasibility of magnetic resonance T1 and T2 mapping techniques in the evaluation of early diabetic lens complications.Methods
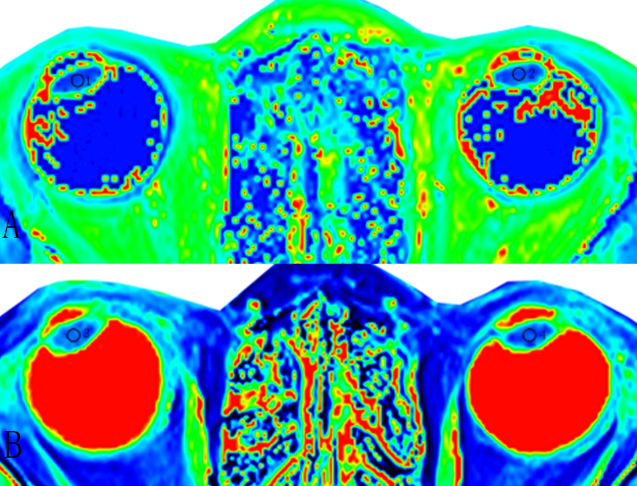
Totally of 28 patients with type 2 diabete were prospectively collected, and 28 non diabetic patients matched with age and sex were selected as control. The exclusion criteria were as following: 1) slit lamp examination with lens opacity; 2) Glaucoma patients; 3) high blood lipids, hyperthyroidism and other metabolic diseases; 4) had a history of ocular trauma. The 3T MRI protocol (MAGNETOM Skyra, Siemens healthcare, Erlangen, Germany) included a two-flip-angle based T1-mapping sequence (TR=15ms, TE=2.2ms, flip angle1 50, flip angle2 260, FOV 170mm x 53mm, thickness 3.0mm, slice number 12), a CPMG based T2-mapping sequence (TR=600ms, TE1=13.8ms, TE2=27.6, TE3=41.4, TE4=55.2, TE5=69.0. flip angle 180o, FOV 170mm x 53mm, thickness 4.0mm, slice number 7). T1 and T2 values of the lens were measured by ROI method on Siemens Syngo workstation (ROI size 0.04cm2, placed in the central region of the lens). Two sample T-test was used to analyze the differences between groups, p<0.01 was used to determine statistical significance.Result
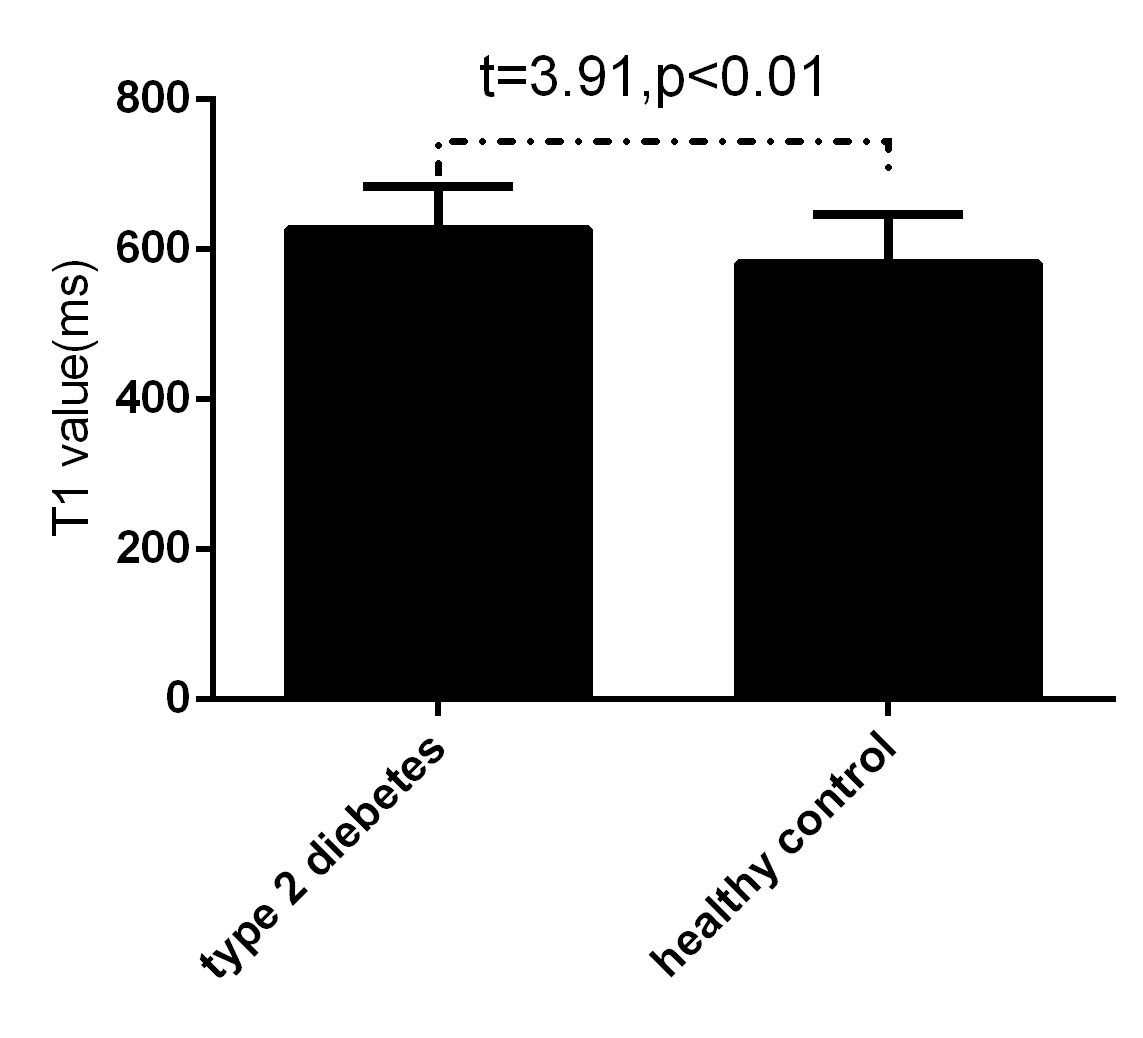
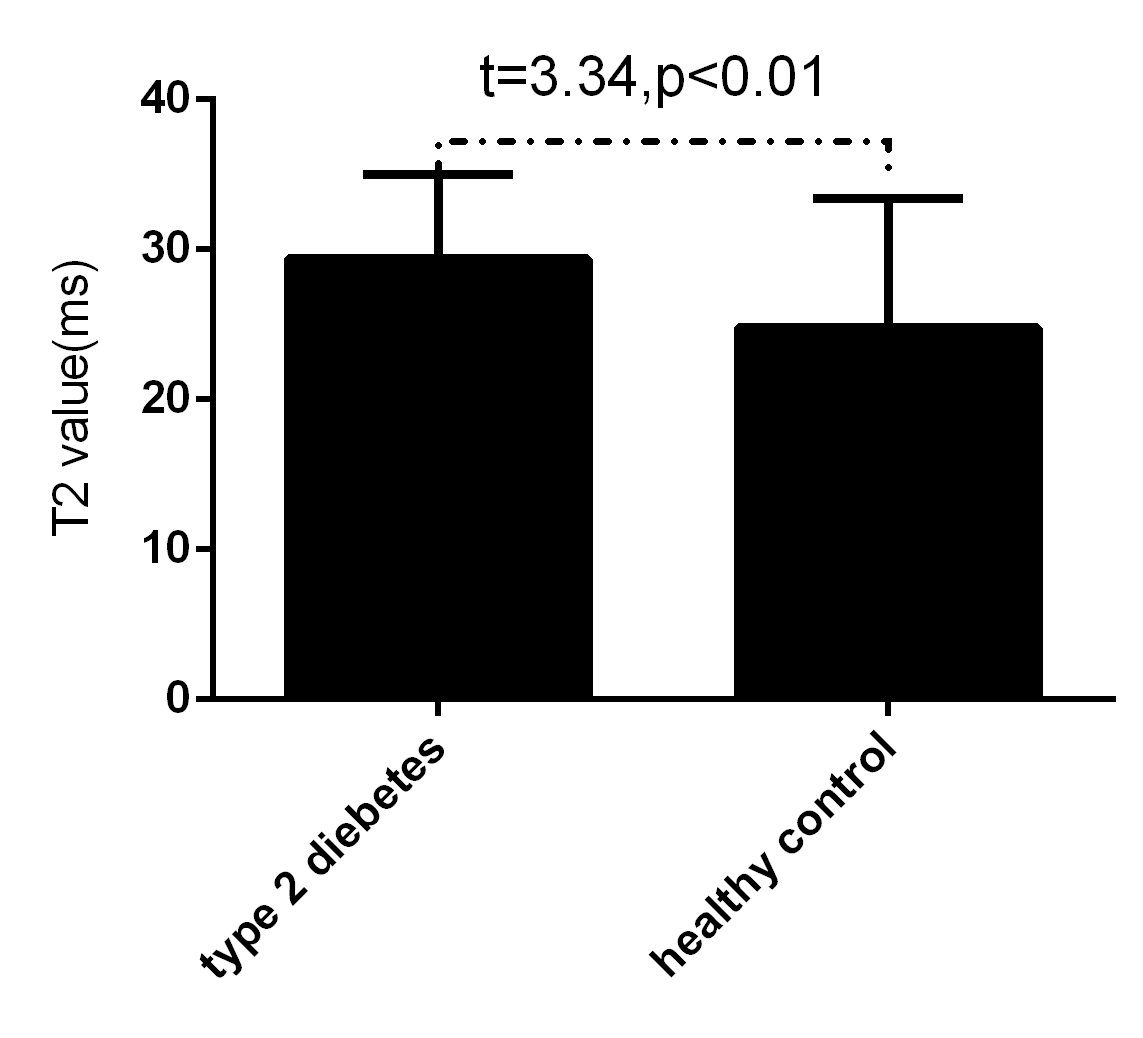
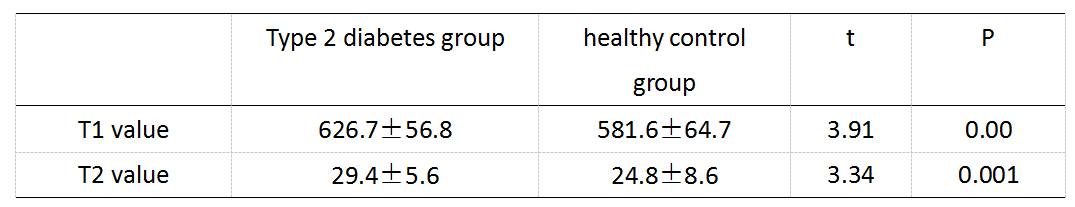
Patients with diabetes (17 males with age 49.1 + 9.2, 11 females with age 50 + 8.9 ) and 28 patients without diabetes (15 males with age 53.5 + 5.5, 13 females with age 45.6 + 98) as control group were included. There was no significant difference in age and sex between the two groups (P>0.05). In type 2 diabetes group, the T1 value was 626.7±56.8 ms, T2 value was 29.4±5.6 ms. In healthy control group, the T1 value was 581.6±64.7 ms, T2 value was 24.8±8.6 ms. The T1 and T2 values of the lens nucleus in diabetic group were significantly higher than those in control group (P<0.01, T1 value: 626.7±56.8 VS 581.6±64.7; T2 value: 29.4±5.6 VS 24.8±8.6).Conclusion
Magnetic resonance T1 and T2 mapping techniques can be used to detect early lens complications in diabetic patients with negative slit lamp examination. The T1 and T2 values of lens in diabetic patients were significantly increased. Some studies have shown that the increase of diabetic lens relaxation may be due to the high concentration of sorbitol in tissues and abnormal glycosylation of lens[2]. The T1 and T2 value might be helpful for early detection of lens disease or evaluation of therapeutic effect.Acknowledgements
No acknowledgement found.References
[1]Cui Y, Zhang L, Zhang M, et al. Prevalence and causes of low vision and blindness in a Chinese population with type 2 diabetes: the Dongguan Eye Study[J]. Sci Rep, 2017,7(1):11195.
[2] Aksoy H, Keles S, Kocer I, et al. Diabetic cataract and the total antioxidant status in aqueous humor[J]. Clin Chem Lab Med, 2001,39(2):143-145.
Figures