5615
Accuracy of Fatty Acid Quantification using Bipolar Multi-Echo MRI for Varying Numbers of Echoes1Pattern Recognition Lab, Department of Computer Science, Friedrich-Alexander-Universität Erlangen-Nürnberg, Erlangen, Germany, 2MR Application Predevelopment, Siemens Healthcare GmbH, Erlangen, Germany, 3MR R&D Collaborations, Siemens Healthineers, Cary, NC, United States, 4Radiology, Duke University Medical Center, Durham, NC, United States, 5Center for Advanced Magnetic Resonance Development, Duke University Medical Center, Durham, NC, United States
Synopsis
Multi-echo MRI data can be used to quantify the fatty acid composition of human adipose tissue. The total echo train readout length and the number of acquired echoes are important parameters affecting the overall accuracy of the fatty acid parameter maps. The purpose of this study was to quantify the expected error in fatty acid estimates depending on the used total echo train readout length, using an oil phantom at 3T. Echo train readout lengths of at least 13-14ms were required to accurately estimate the different fat components. Shorter echo train readouts led to less accurate parameter maps.
Introduction
Hepatic fatty acid composition (FAC) is a potentially useful biomarker of non-alcoholic fatty liver disease. For example, FAC was shown to correlate with histopathologically confirmed hepatocyte ballooning1, which is a hallmark of progression from simple non-alcoholic fatty liver to non-alcoholic steatohepatitis. Since the degree of saturation of triglycerides is reflected in their spectrum, parametric maps of the triglyceride saturation state can be extracted from complex multi-echo MR data, provided that certain confounding factors have been properly taken into account2-5. The duration of a liver MR scan is typically constrained to a breath-hold, a fact that naturally leads to a trade-off between resolution and accuracy. The overall acquisition time is roughly proportional to the echo train readout length, which determines the resolution in the spectral domain. While the dependence of the error propagation for monopolar acquisitions has been described2, the accuracy of MRI-based FAC quantification regarding the total echo train readout length remains unexplored. Our goal was to quantify the expected error in saturated, mono-unsaturated and poly-unsaturated fat maps as a function of the echo train length based on a vegetable oil phantom study.Methods
FAC
quantification: Bipolar
multi-echo MRI data was denoised using a spectral denoising approach6,7
and then fitted to a complex signal model. The non-linear model incorporated 9
spectral fat peaks8 and spatially dependent parameters for the B0
off-resonance frequency9,10, R2*11 and the
eddy-current-induced phase discrepancy12. The relative sizes of
the fat peaks were modeled in terms of the number of double bonds (ndb), number
of methylene-interrupted double bonds (nmidb), and the chain length (cl)8.
Additionally a heuristic approximation for the cl13 was applied.
Parameter maps for the saturated, mono-unsaturated and poly-unsaturated fat
components were determined from ndb and nmidb as proposed by Peterson et al.3
using an implementation in C++.
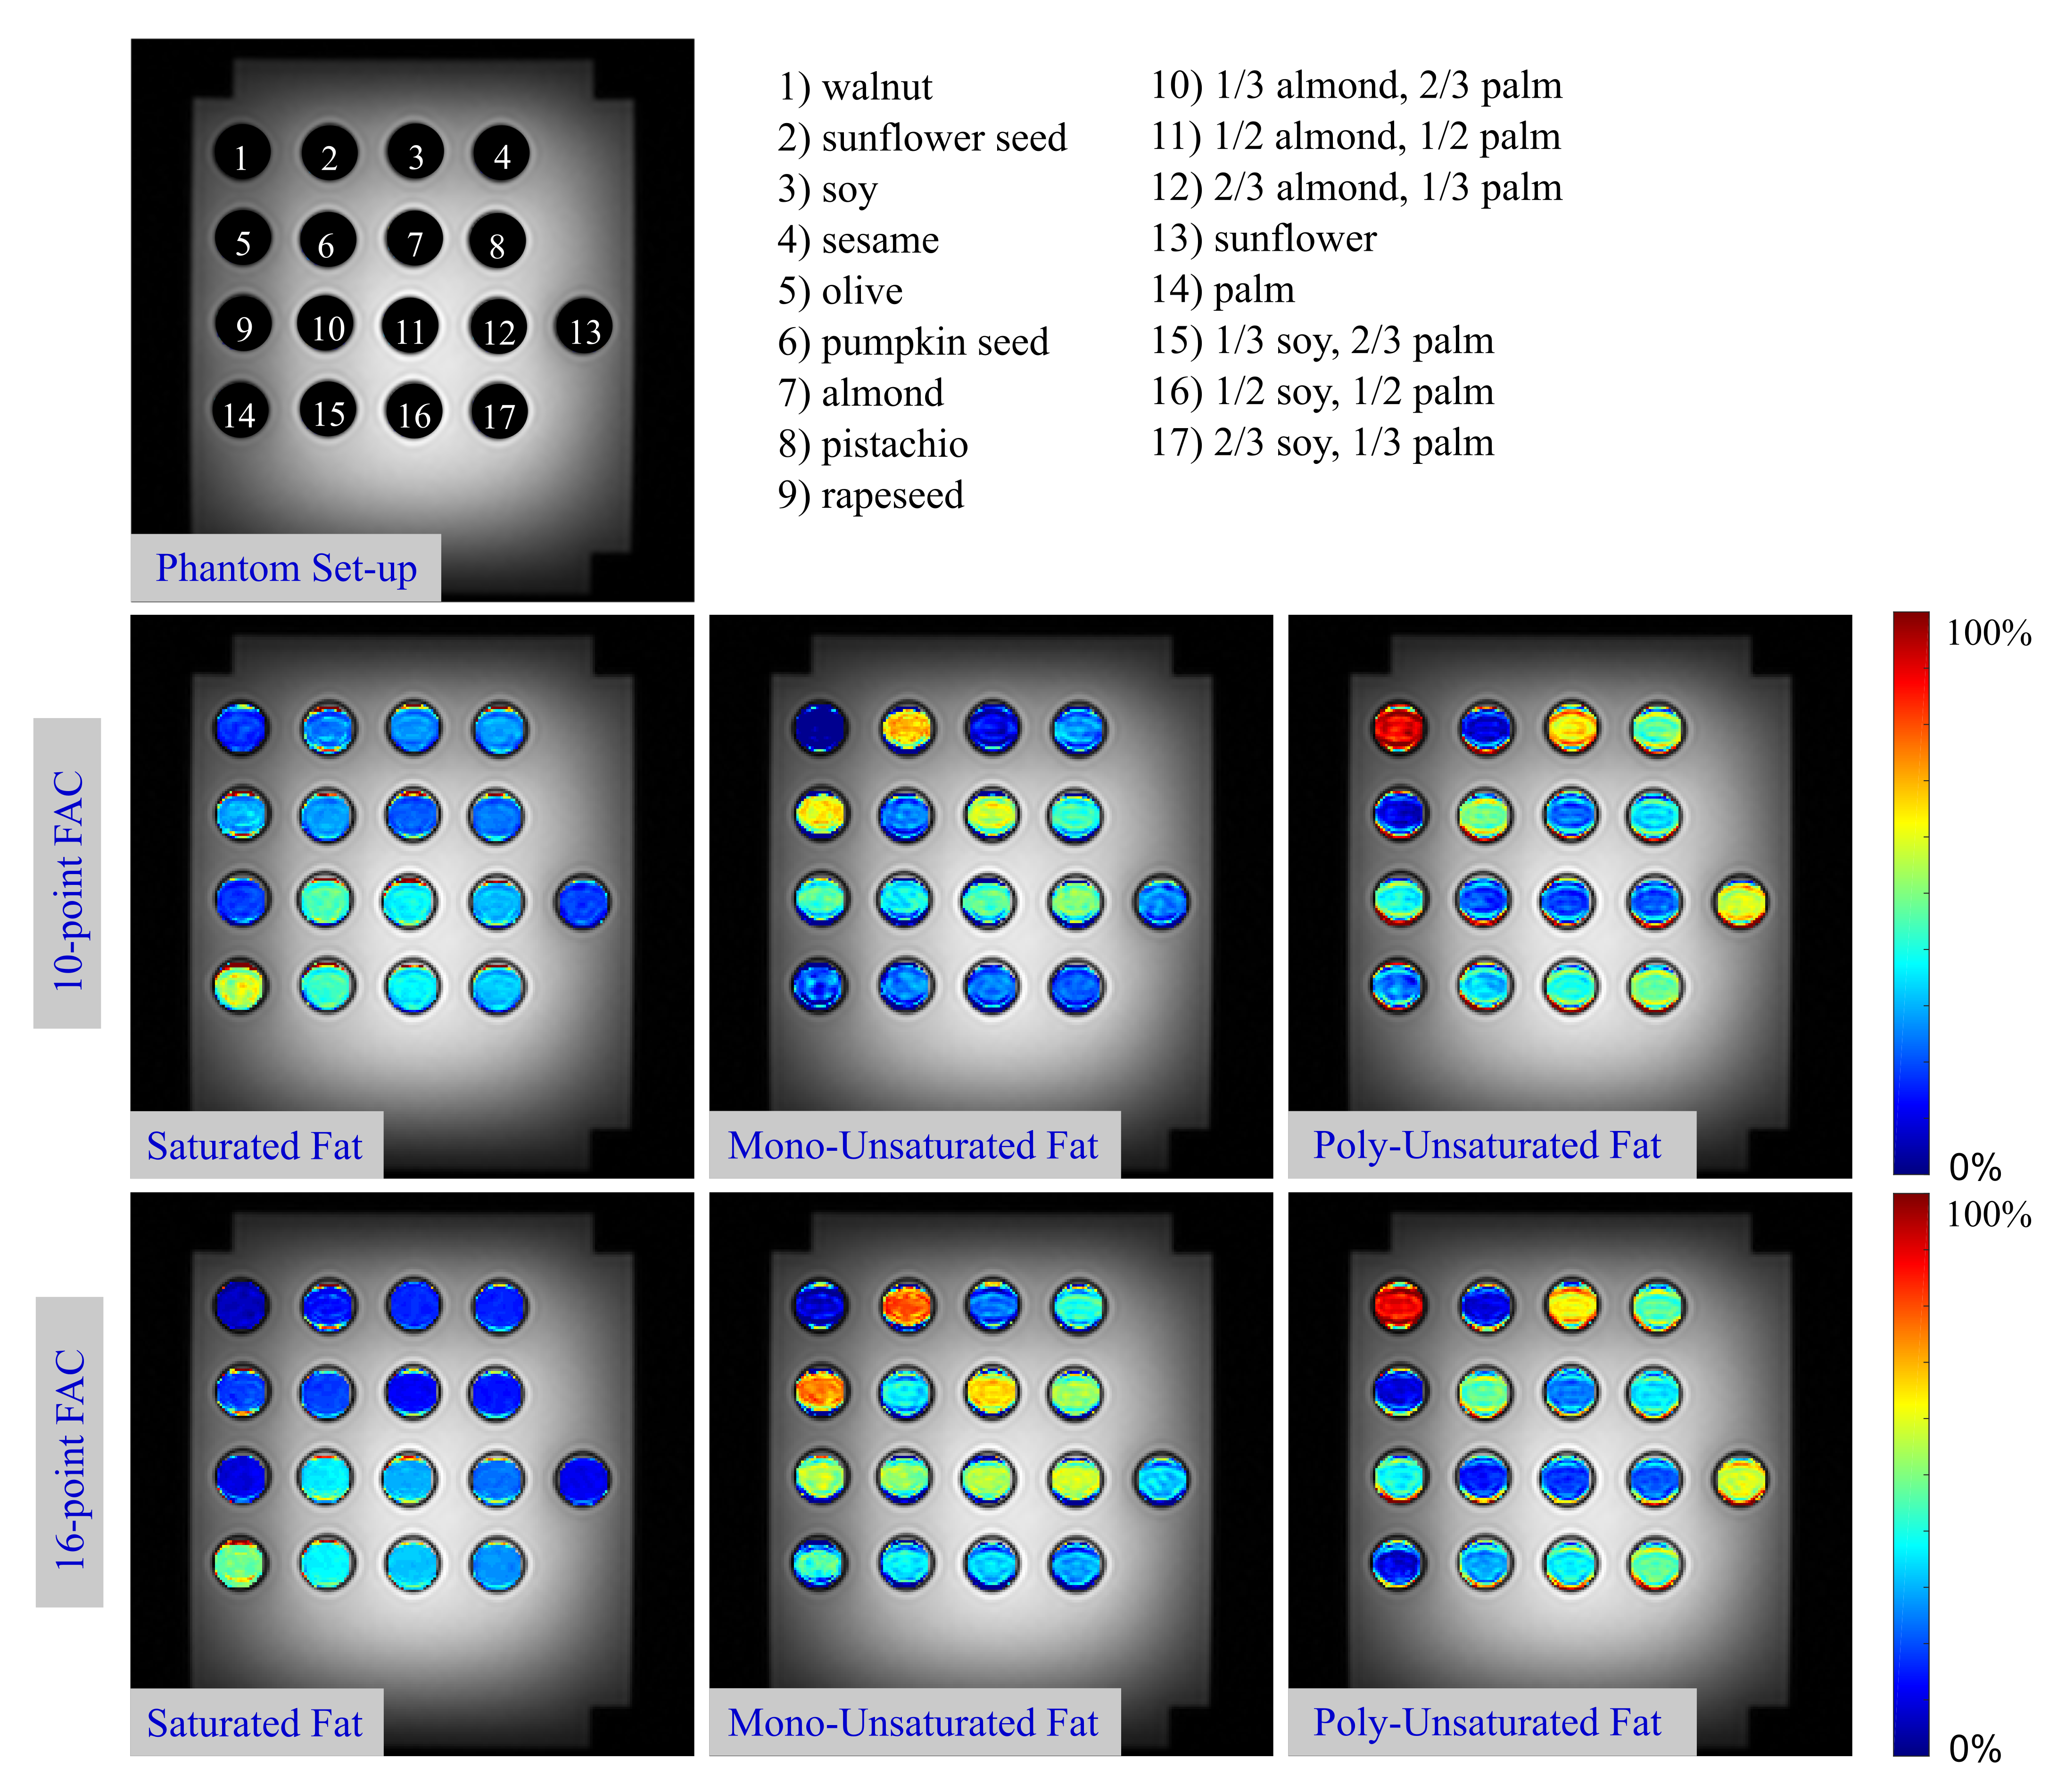
Phantom
study: Different commercially available
vegetable oils and oil mixtures were filled into plastic vials (diameter
= 28mm, volume = 50ml) and placed in a water bath. The phantom set-up is shown in
Fig. 1. Multi-echo MR data of the phantom was acquired on a 3T MR scanner
(MAGNETOM Skyra, Siemens Healthcare, Erlangen, Germany) using an 18-channel
body and a spine array coil and a prototypical 2D multi-slice GRE sequence (12
slices, TE1 = 1.23ms, ΔTE = 0.84ms, FA = 10°, voxel size = 1.3x1.3x5.0mm3,
bipolar readout gradients, bandwidth = 1950Hz/px) and was then processed using
the described method. To evaluate the effect of the echo train readout
length on the estimated FAC, 13 experiments with varying numbers of echoes
(ranging from 6 up to 30 echoes) were conducted. The echo train readout
length, which is governed by TE1, ΔTE and the number of echoes, varied from
5.4ms to 25.6ms.
Statistical analysis: For every measured protocol, mean fatty acid values within cylindrical volumes of interest (VOIs) (comprising 6 slices and approx. 650 voxels) were calculated for the 17 oil mixtures. The accuracy of all quantification results was assessed by estimating the mean absolute error (MAE) with respect to reference values given by the oil manufacturers. Exemplary, for the 10- and 16-echo acquisitions a linear regression analysis was performed.
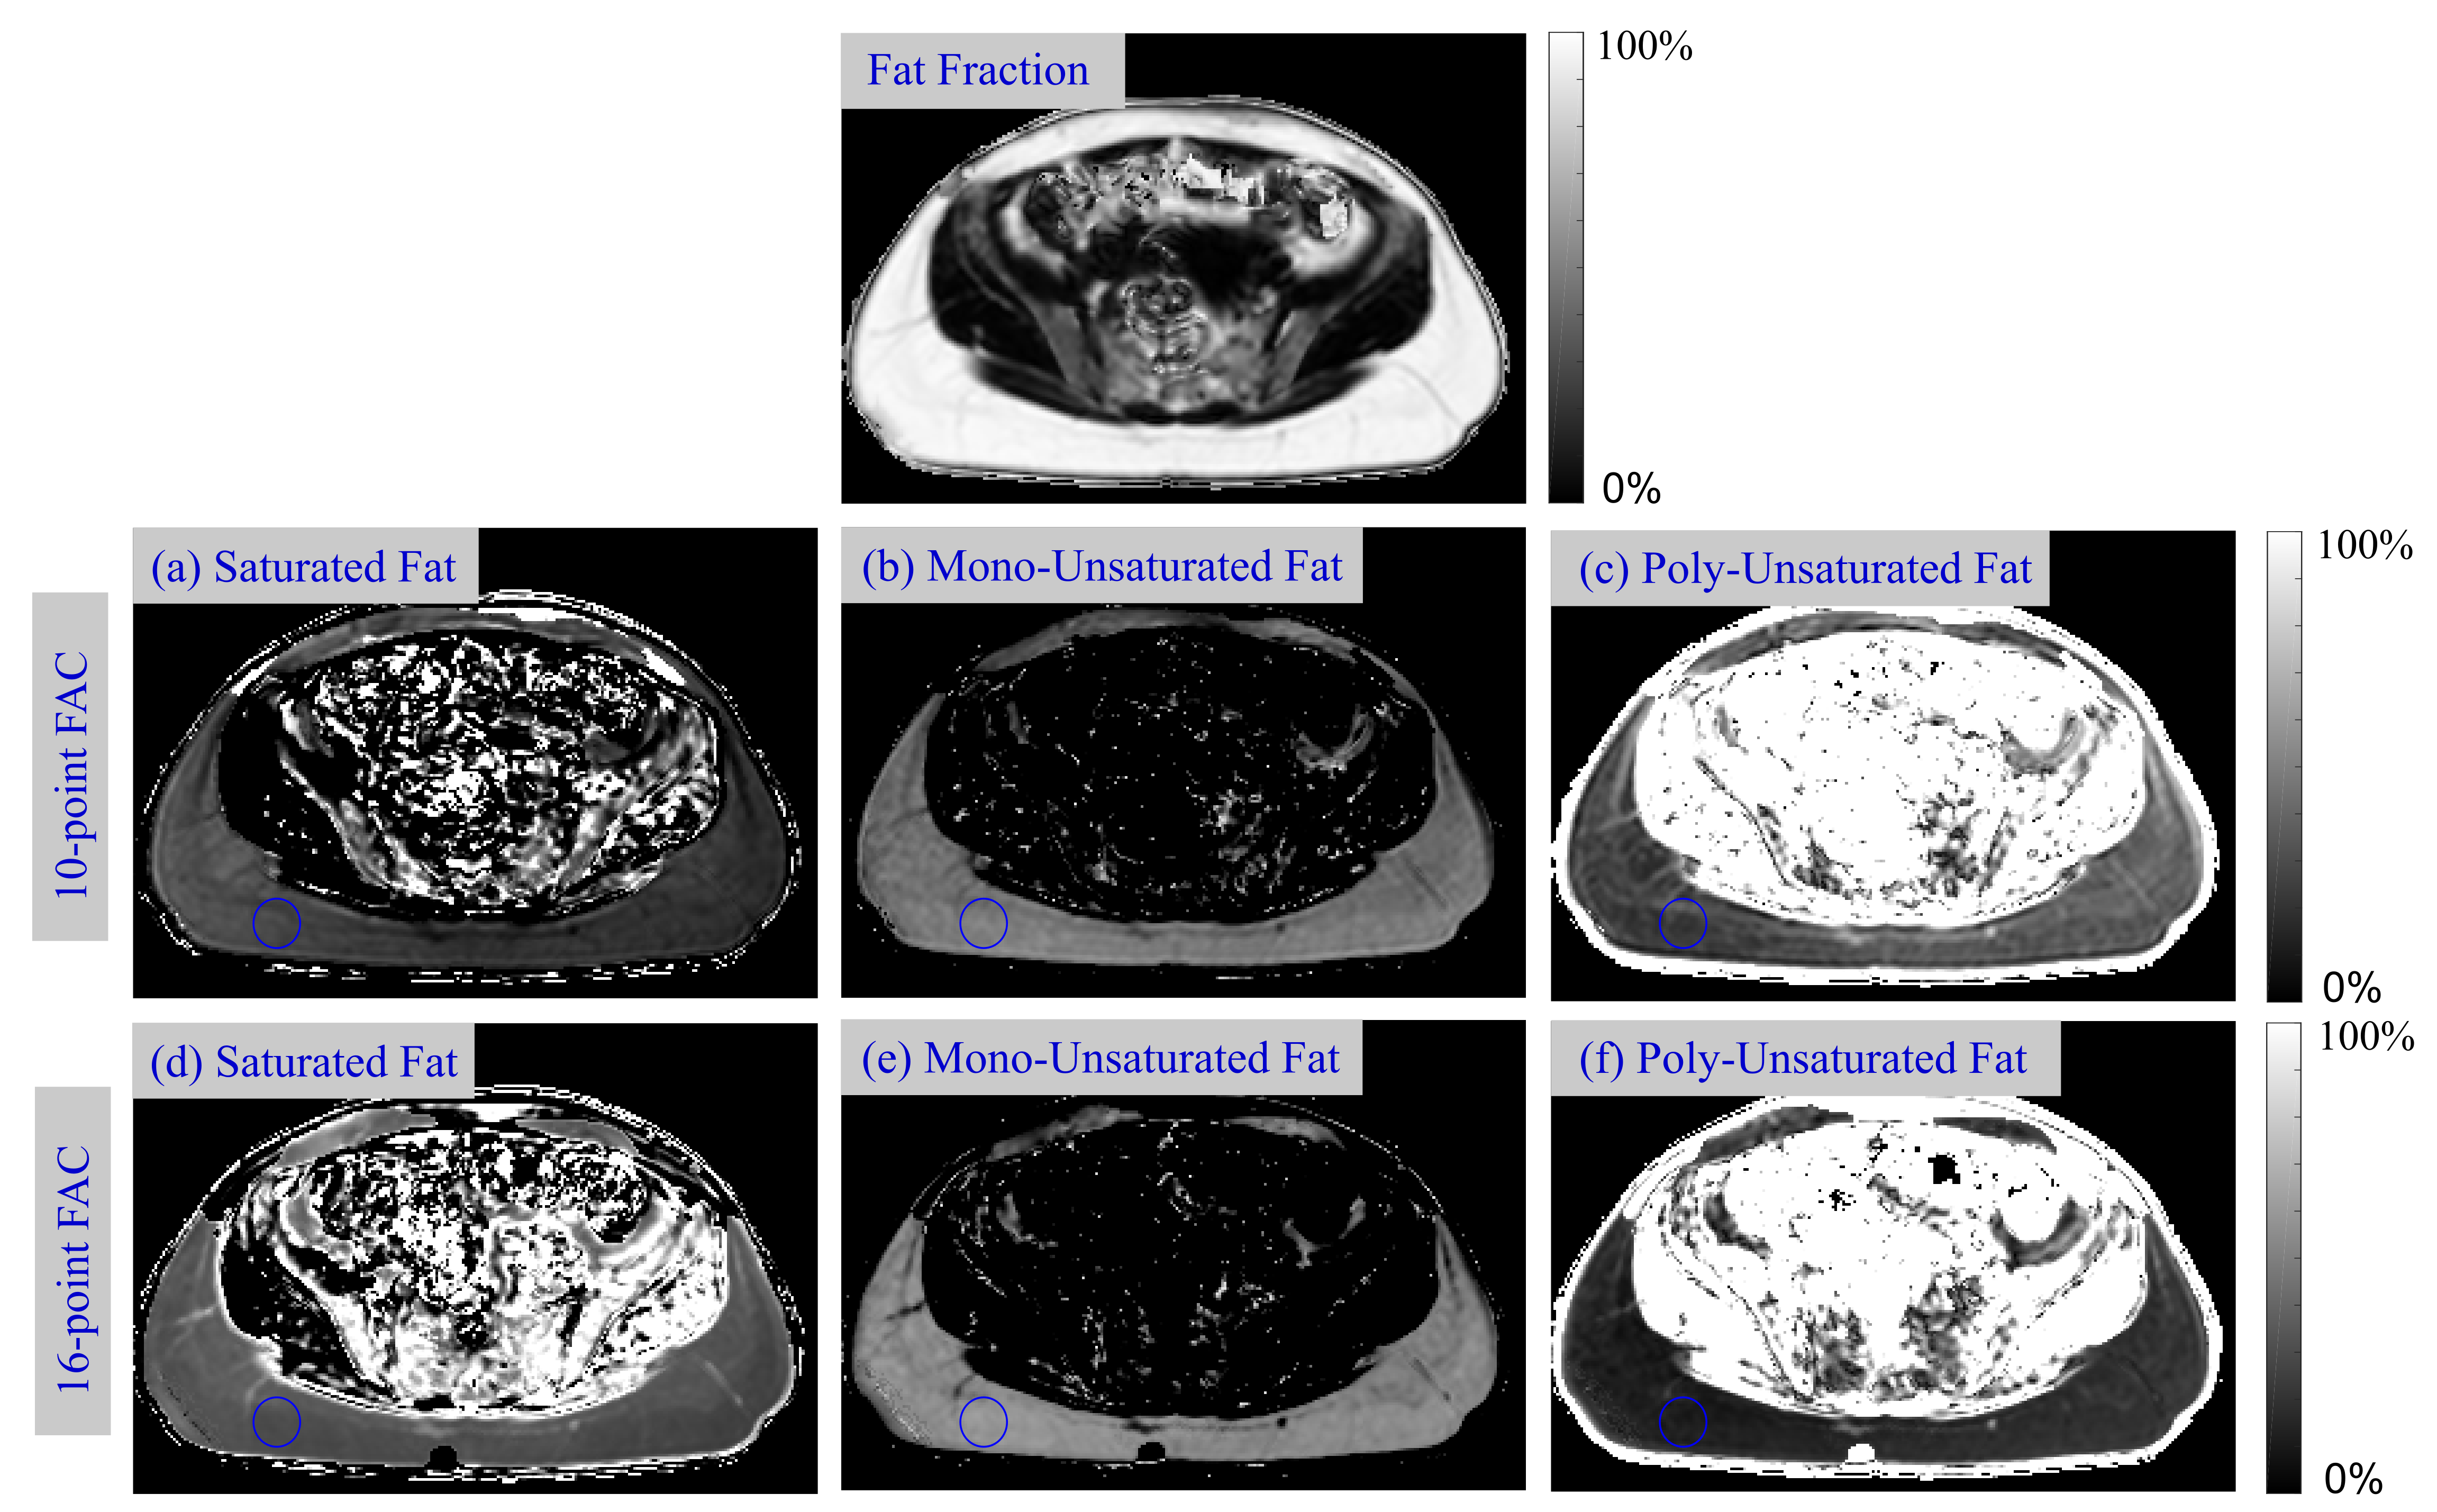
In-vivo measurements: Two datasets from one volunteer were acquired using the 10-echo and 16-echo protocols within a breath-hold (acquisition time = 17s), and were inspected for consistency with the phantom study.
Results and Discussion
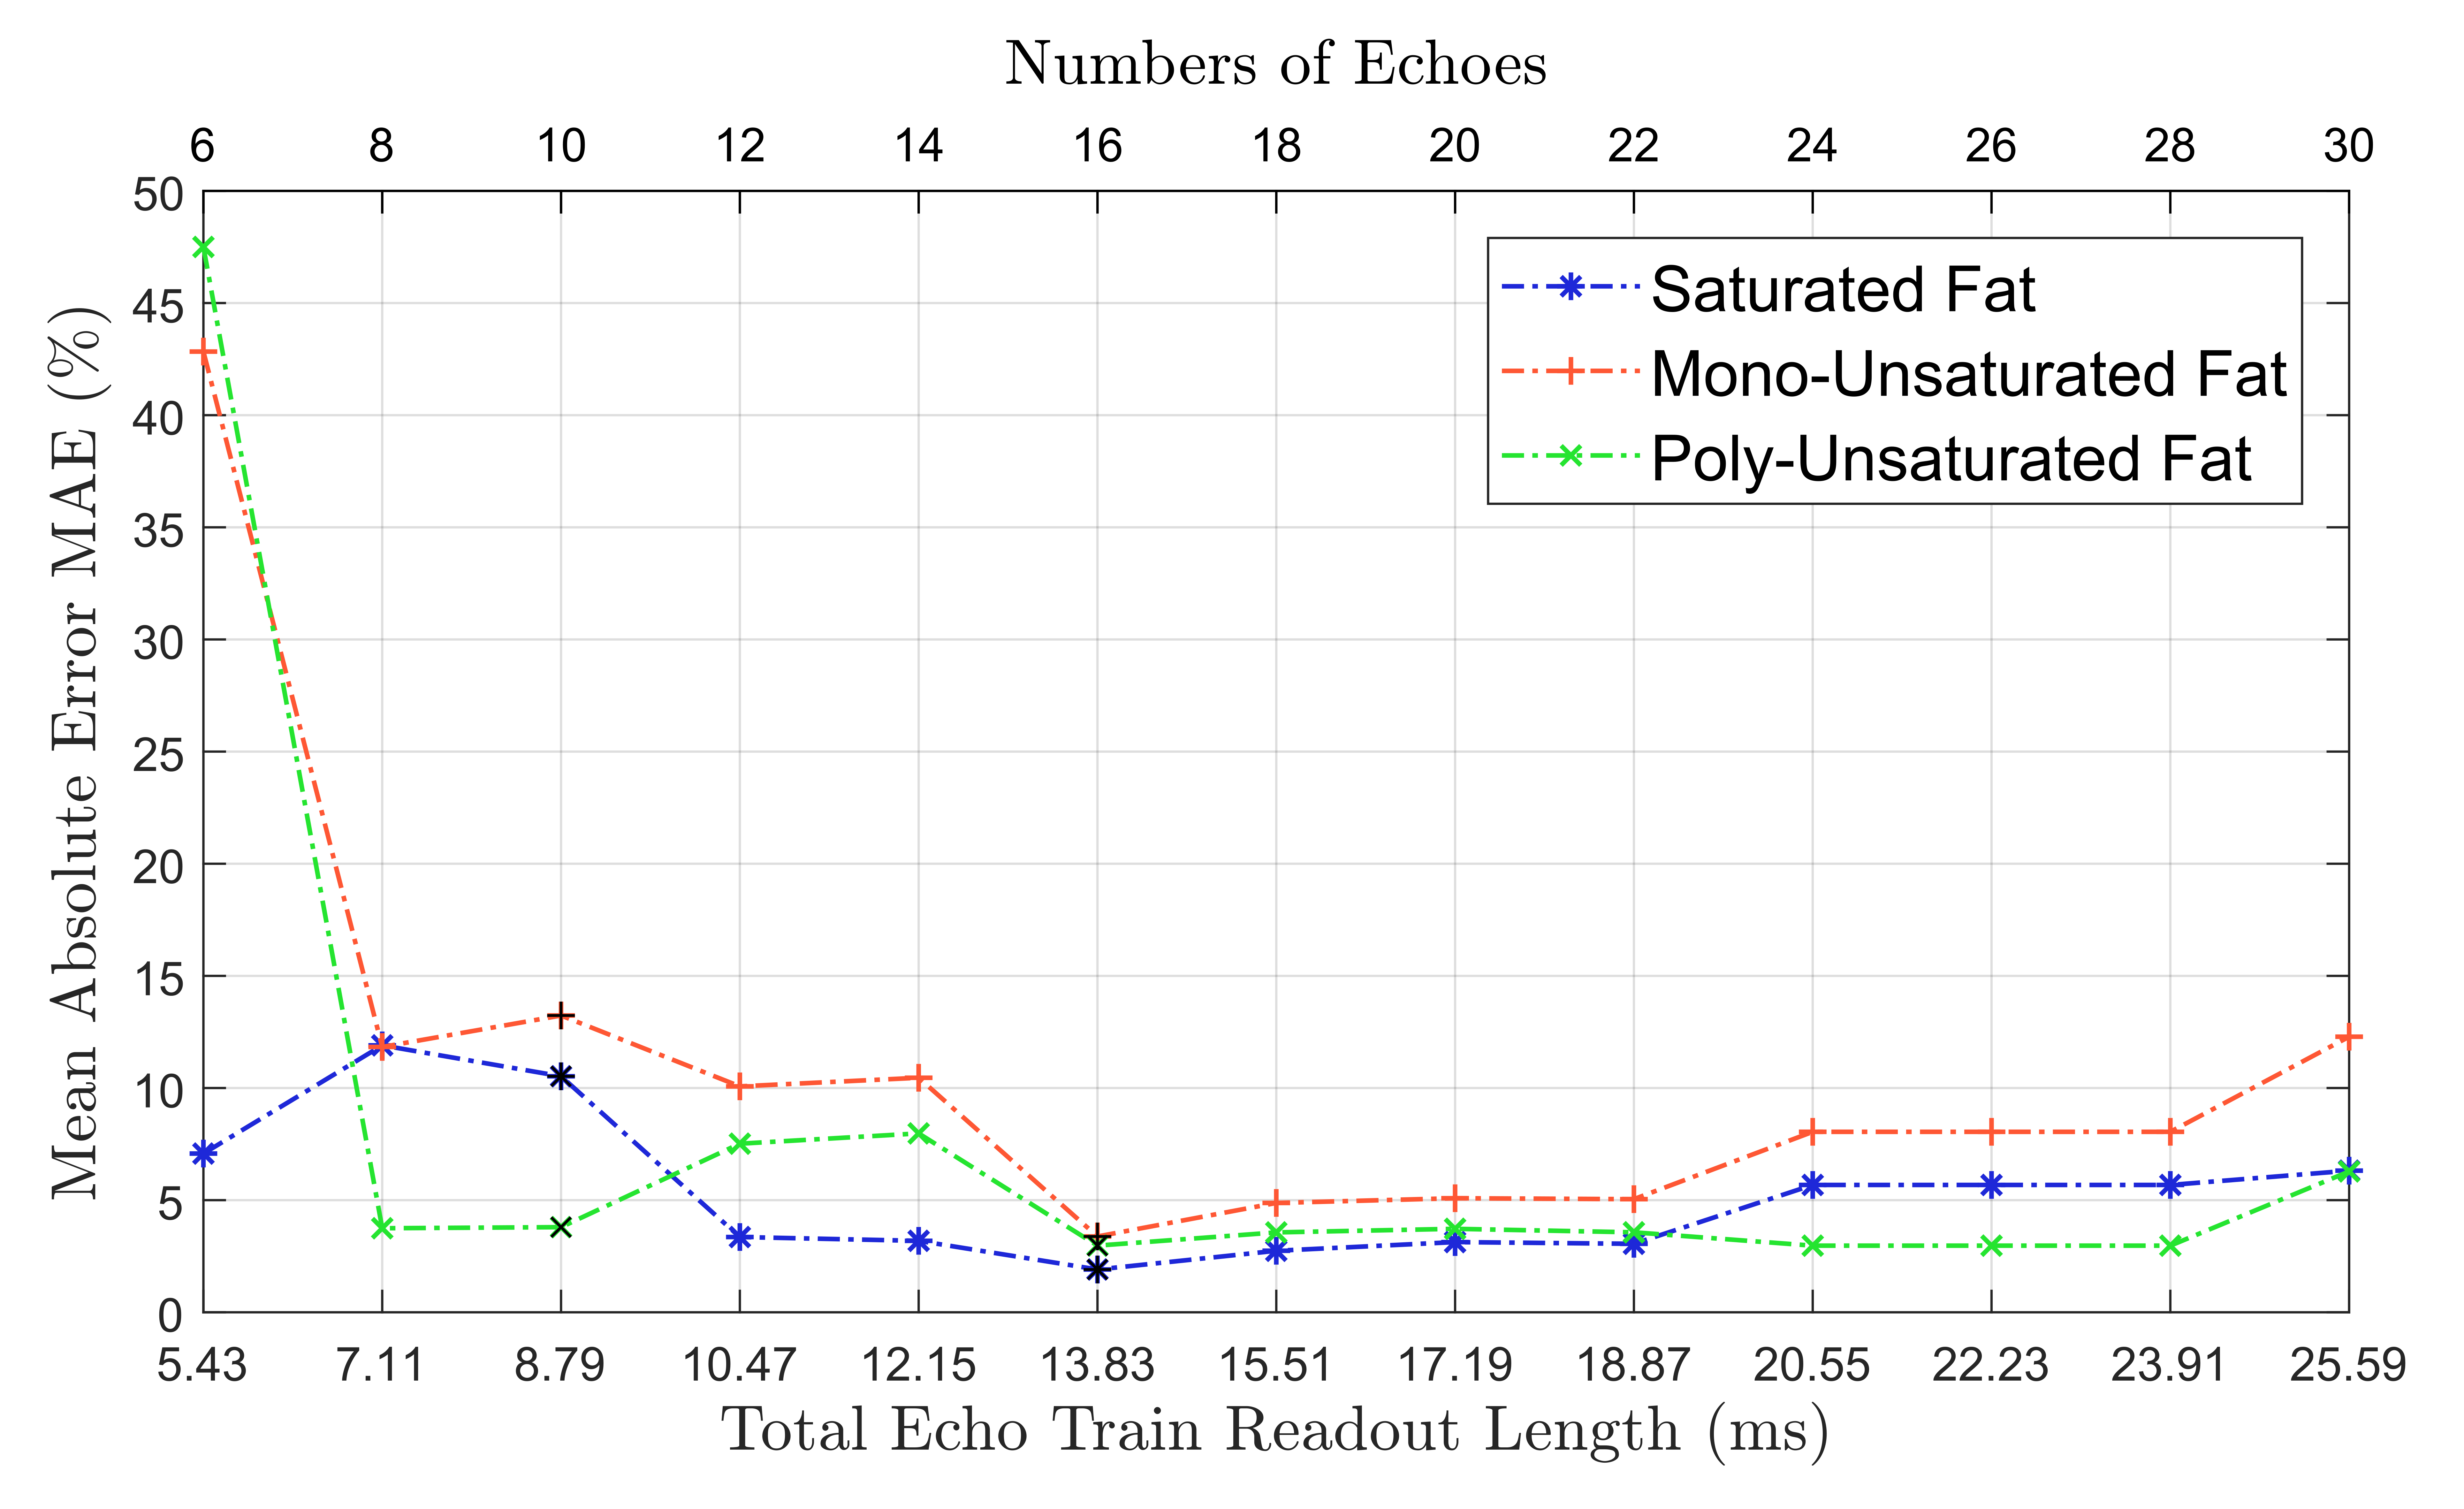
Fig. 2 demonstrates the MAEs for all measured protocols for the phantom study. The smallest MAEs for all three components were achieved using echo train readout lengths from 13-14ms to about 19ms. Shorter echo train readout times led to reduced accuracy in the fatty acid estimates. Interestingly, the accuracy does not monotonically decrease for longer echo train lengths, which may be due to the fact that acquisitions at longer echo times are more sensitive to the spectral modeling or systematic errors in general.
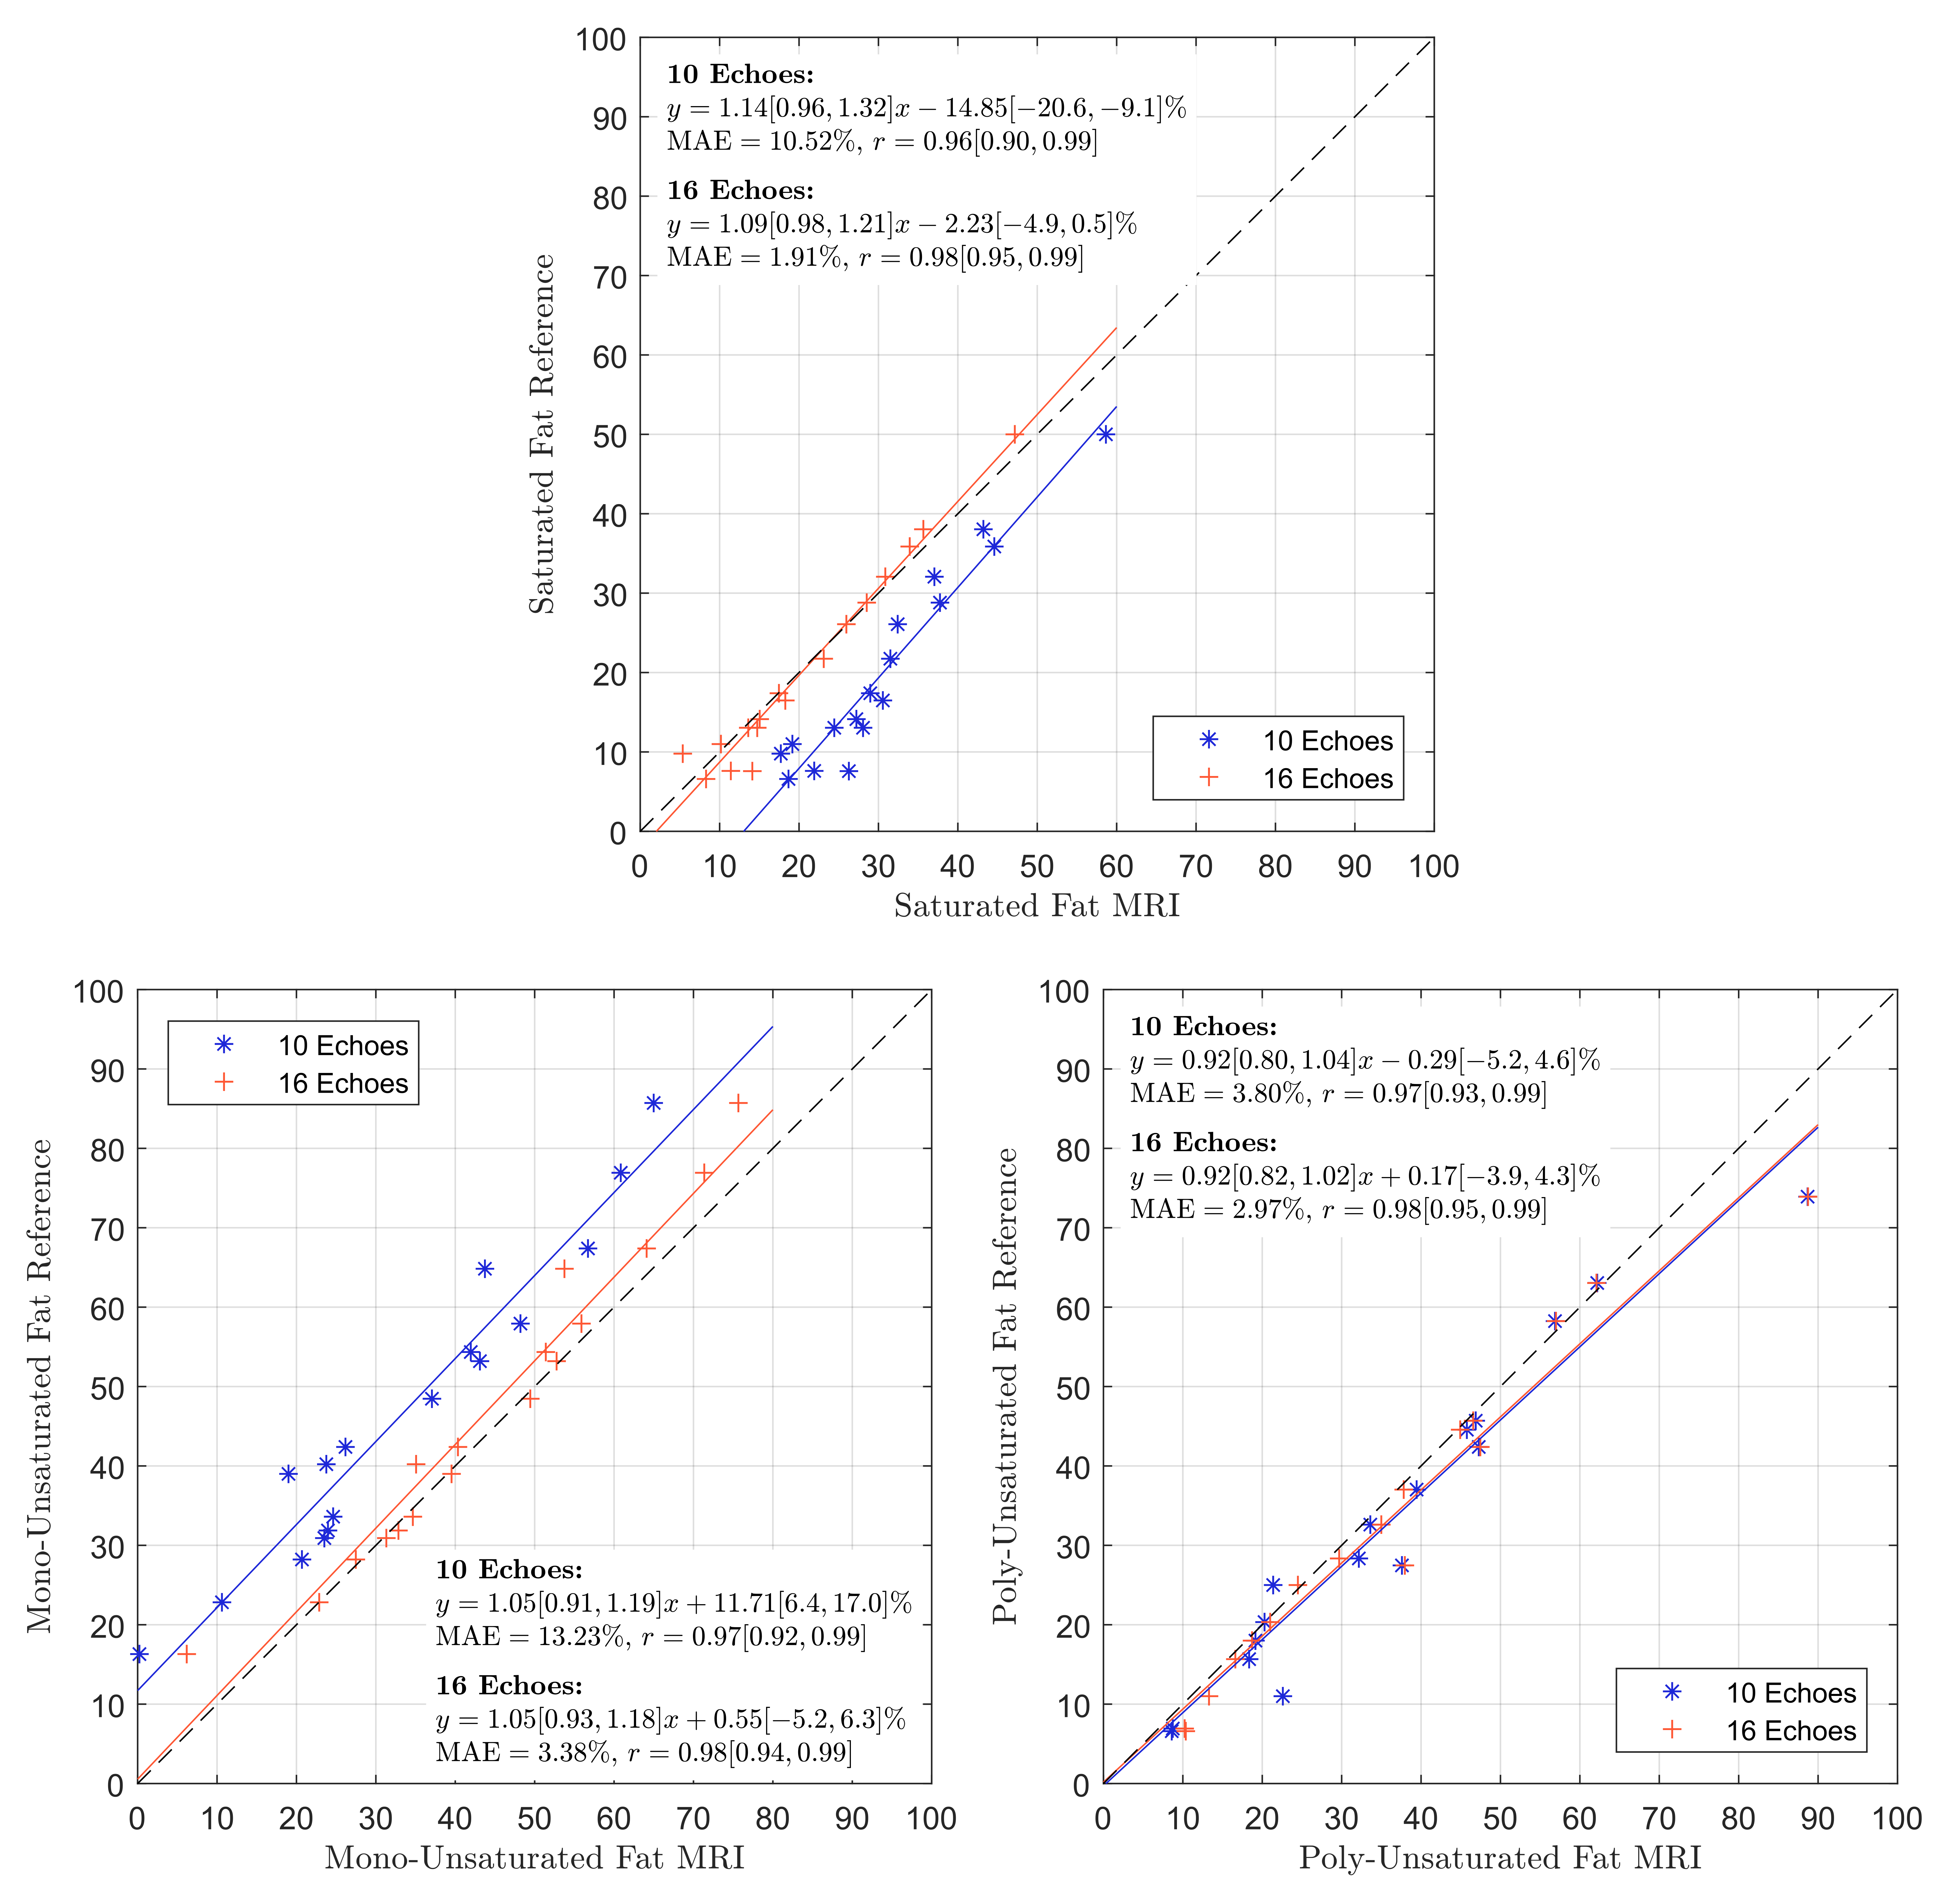
Fig. 3 shows linear regression plots for the 10-echo and 16-echo acquisitions. The 10-echo protocol overestimated the saturated fat component (intercept = -14.85% with 95% confidence intervals of [-20.6%, -9.1%]) and at the same time underestimated the mono-unsaturated component (intercept = 11.71% with 95% confidence intervals of [6.4%, 17.0%]).
Fig. 4 depicts in-vivo fatty acid estimates. A slight right-to-left intensity gradient can be seen visually for the saturated and poly-unsaturated fat components of the 10-point FAC maps. This effect is reduced in the 16-echo parameter maps.
Conclusion
An echo train readout length of at least 13-14ms was required for accurate fatty acid estimation in phantoms. Increasing the sampling further theoretically improves the signal-to-noise ratio in the parameter maps, but may introduce increasing systematic errors.Acknowledgements
No acknowledgement found.References
1. Flintham R, Eddowes P, Semple S, et al. Non-Invasive Quantification and Characterisation of Liver Fat in Non-Alcoholic Fatty Liver Disease (NAFLD) Using Automated Analysis of MRS Correlated with Histology. In: Proceedings of the 24th Annual Meeting of ISMRM; 2016. #0357.
2. Berglund J, Ahlström H, Kullberg J. Model-based mapping of fat unsaturation and chain length by chemical shift imaging - phantom validation and in vivo feasibility. Magn Reson Med. 2012;68(6):1815-1827.
3. Peterson P, Månsson S. Simultaneous quantification of fat content and fatty acid composition using MR imaging. Magn Reson Med. 2013;69(3):688-697.
4. Leporq B, Lambert SA, Ronot M, et al. Quantification of the triglyceride fatty acid composition with 3.0 T MRI. NMR Biomed. 2014;27(10):1211-1221.
5. Leporq B, Lambert SA, Ronot M, et al. Hepatic fat fraction and visceral adipose tissue fatty acid composition in mice: Quantification with 7.0 T MRI. Magn Reson Med. 2016;76(2):510-518
6. Lugauer F, Nickel D, Wetzl J, et al. Robust Spectral Denoising for Water-Fat Separation in Magnetic Resonance Imaging. In: International Conference on Medical Image Computing and Computer-Assisted Intervention. Springer; 2015. p. 667-674.
7. Schneider M, Lugauer F, Nickel D, et al. Improving the Noise Propagation Behavior of Different Fatty Acid Quantification Techniques using Spectral Denoising. In: Proceedings of the 25th Annual Meeting of ISMRM, Honolulu, HI, USA; 2017. #5195.
8. Hamilton G, Yokoo T, Bydder M, et al. In vivo characterization of the liver fat 1H MR spectrum. NMR Biomed. 2011;24(7):784-790.
9. Hernando D, Haldar J, Sutton B, et al. Joint estimation of water/fat images and field inhomogeneity map. Magn Reson Med. 2008;59(3):571-580.
10. Hernando D, Kellman P, Haldar J, et al. Robust water/fat separation in the presence of large field inhomogeneities using a graph cut algorithm. Magn Reson Med. 2010;63(1):79-90.
11. Yu H, McKenzie CA, Shimakawa A, et al. Multiecho reconstruction for simultaneous water-fat decomposition and T2* estimation. J Magn Reson Imaging. 2007;26(4):1153-1161.
12. Peterson P, Månsson S. Fat quantification using multiecho sequences with bipolar gradients: investigation of accuracy and noise performance. Magn Reson Med. 2014;71(1):219-229.
13. Bydder M, Girard O, Hamilton G. Mapping the double bonds in triglycerides. Magn Reson Imaging. 2011;29(8):1041-1046.
Figures