5612
Technical Challenges in Measuring Adipose Tissue T2∗1Diagnostic and Interventional Radiology, Technical Univeristy of Munich, Munich, Germany, 2Philips Research Laboratory, Hamburg, Germany
Synopsis
This work investigates the accuracy and precision of T2∗ estimated from standard water–fat imaging techniques with respect to the a priori assumed fat spectrum. A bias in measuring T2∗ with a low number of echoes and a mismatch of the a priori to the true fat spectrum is detected. Through simulations and in vivo scans it is shown how the bias is reduced by increasing the number of echoes. Results also indicate remaining inaccuracies due to a mismatch in the assumed fat spectrum to the true fat spectrum in a voxel.
Introduction/Purpose
Recently, measuring T2∗ in fat has gained interest in the context of imaging brown adipose tissue in humans [1]. A reliable measurement of T2∗ of fat in combination with the proton-density fat fraction (PDFF) is valuable for differentiating brown from white adipose tissue, estimating the amount of connective tissue, and potentially oxygenation and activation. To estimate T2∗ and PDFF simultaneously, a complex-based water–fat separation technique is typically performed on magnitude and phase data from a multi-gradient-echo sequence [4]. This technique uses an a priori fixed fat spectrum as additional input and is extensively and primarily studied in terms of the accuracy and precision in the PDFF estimate, as T2∗ is often treated as a nuance parameter to account for the otherwise confounding effect of signal relaxation. Echo times are mainly optimized for the estimation of PDFF, which is known to be very robust with respect to different a priori fat spectra [5–7]. Such investigations are yet to be performed for other parameters in a complex water–fat signal model like T2∗. The quantitative T2∗-estimation is more difficult in terms of SNR and the range of T2∗ values reported in literature varies over dozens of milliseconds [9–12]. Thus, the purpose of this work is to investigate problems of current T2∗-measurement techniques in fatty tissues and mitigate them through experimental design to be able to assess more reliable T2∗ values in human adipose tissue.Methods
The effect in estimated T2∗ of different fat spectra varying in their spectral appearance was addressed in simulations and in vivo measurements.
Simulations
A ground truth signal evolution was simulated from a single-T2∗ water–fat model with the following parameters: fat fraction = 95%, cl = 17.5, number of double bonds ndb = 2.83, methylene-interrupted double bounds nmidb = 0.74, field map = 10Hz, T2∗ = 45s, number of fat peaks = 10, peak locations characterized in superficial subcutaneous fat [3]. MR signals of fat spectra varying in the suspected physiological range ndb ∈ [2.83 − 0.2, 2.83 + 0.2] and nmidb ∈ [0.74 − 0.2, 0.74 + 0.2] [2] were simulated without noise and sampled starting from TE1 = 1.22ms with different number of echoes equally spaced by ∆TE = 1ms. Parameter estimation with the T2∗-IDEAL algorithm determined the bias [4]. Additionally, theoretical Cramér-Rao lower bounds (CRLB) of the precision of the estimates were computed [6].
In vivo measurements
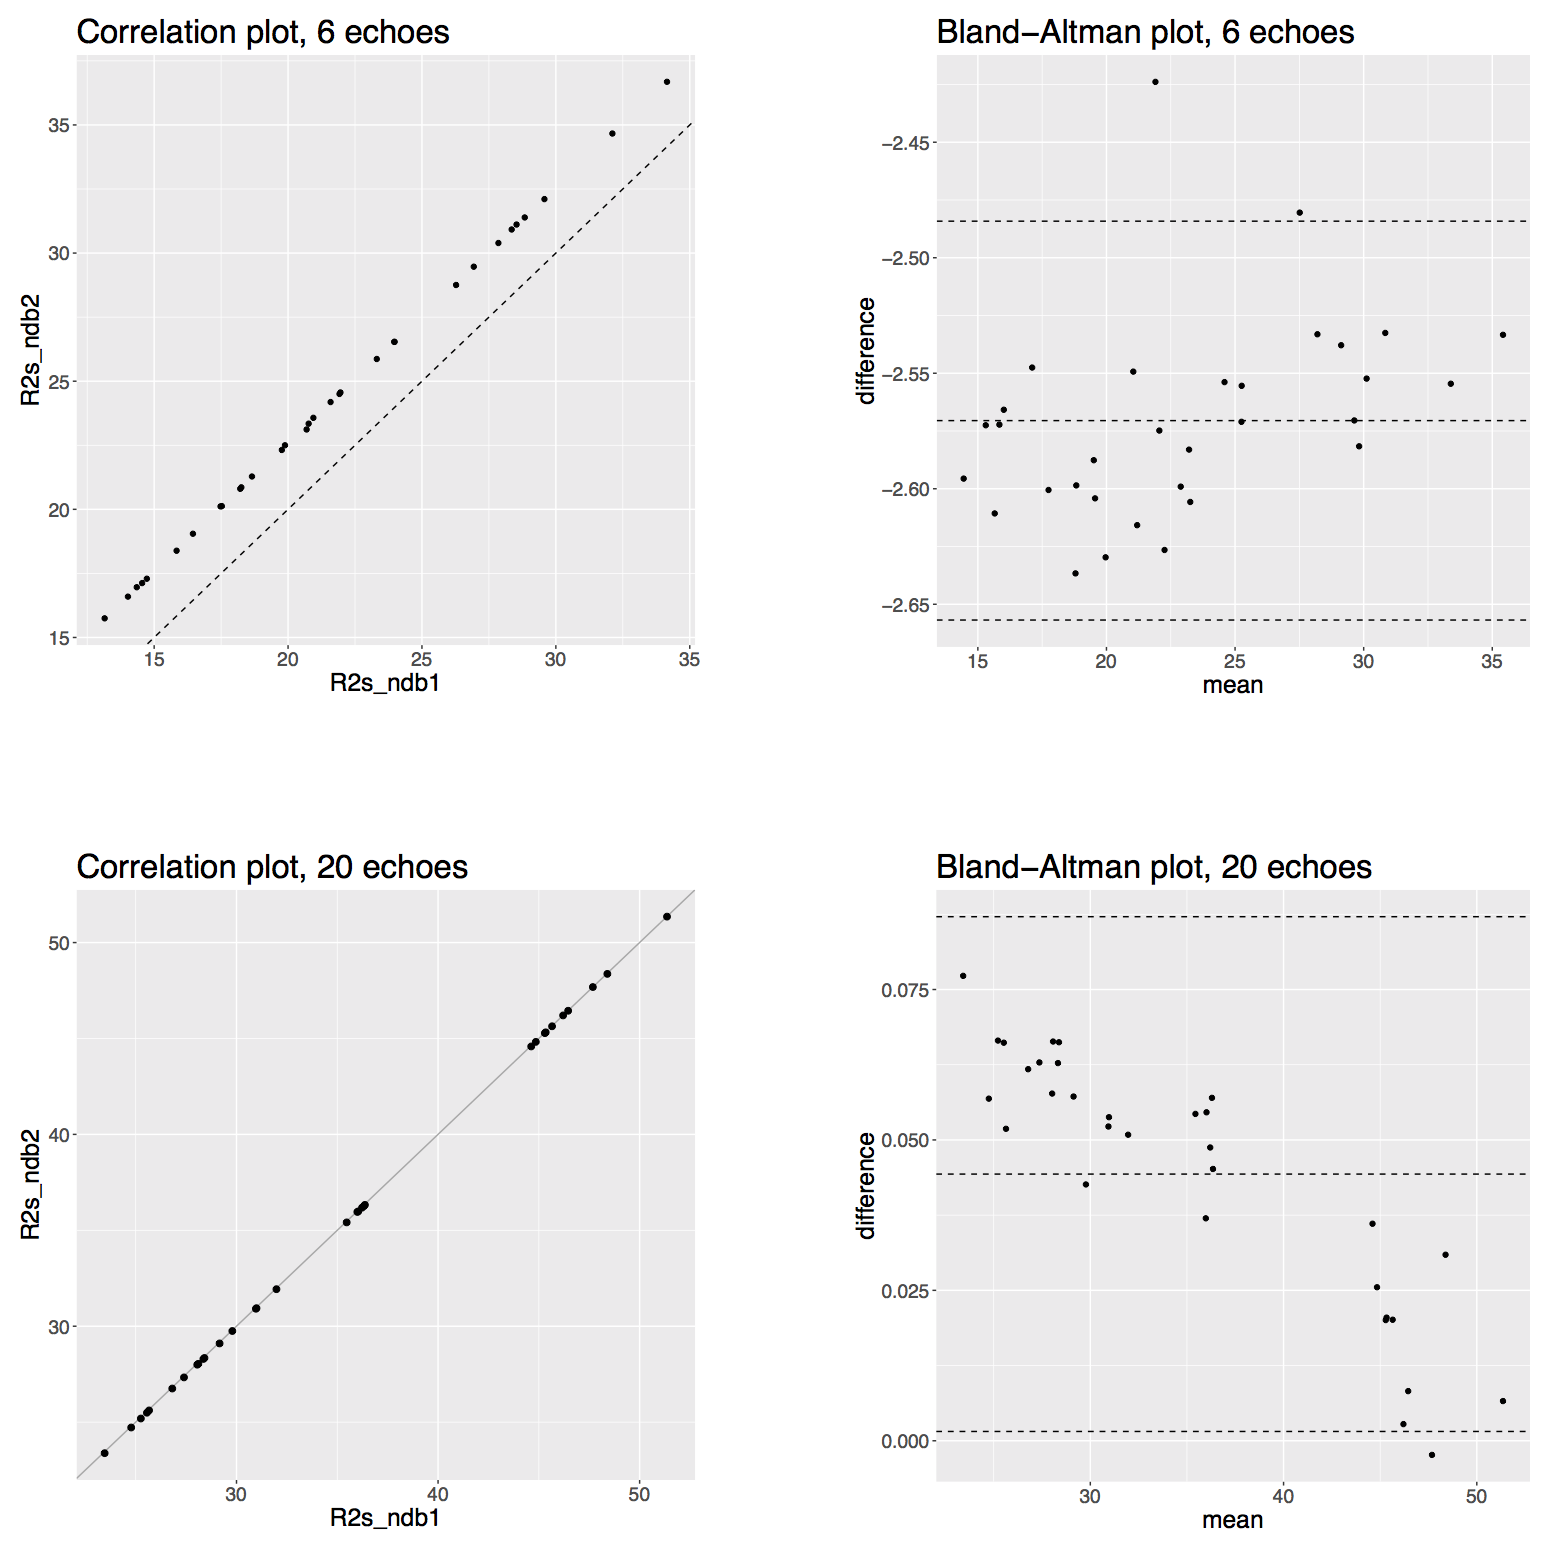
A monopolar multi-gradient-echo sequence with 20 echoes time-interleaved in two acquisitions was performed axially in the gluteal region of 16 healthy volunteers in supine position. Other scan parameters included TR/TEmin/∆TEeff = (24/1.5/1.0)ms, FOV = (400×296×140)mm3, voxel size = (2×2×2)mm3, flip angle = 5°, BWpix = 961.5Hz, SENSE R=2.5, scan time = 3:08 min. Water–fat separation was performed with T2∗-IDEAL [4] for all combinations of two different fat spectra (ndb1 = 2.83, ndb2 = 2.76) with either all 20 echoes or only the first 6 echoes. A semi-automatic algorithm produced two ROIs per dataset in gluteal fat in which mean R2∗ for fixed ndb1 and ndb2 were correlated.
Results
Simulations
As shown in Figure 1 signal magnitude evolution curves of physiologically varying underlying fat spectra with different peak locations and amplitudes can differ noticeably at certain sampled echoes, indicating difficulty in T2∗ estimation when assuming an inaccurate spectrum. Figure 2 shows R2∗(= 1/T2∗) bias maps for the simulated ndb and nmidb ranges. The worst case bias versus the number of echoes is plotted in Figure 3 and shows a strong bias decrease towards parameter estimations using more echoes. The increased accuracy for 20 echo estimations is accompanied by an increase in precision, which is depicted as the decreasing noise variance, or the increasing number of signal averages (NSA), resulting from the CRLB analysis.
In vivo measurements
Figure 4 shows T2∗-maps from an representative dataset reconstructed with different number of echoes and two different fat spectra only slightly varying in ndb (ndb1 = 2.83, ndb2 = 2.74). The quality of T2∗-maps is highly variable when only 6 echoes were used and noticeably more homogeneous for 20 echoes. The correlation results for mean R2∗ = 1/T2∗ in Figure 5 that show how the ndb-difference translates into a systematic T2∗-difference.
Discussion/Conclusion
Simulations and in vivo results clearly show that in contrast to PDFF, the T2∗ estimates in fatty tissues obtained from a standard complex-based water–fat separation technique heavily depend on the assumed a priori fat spectrum and a mismatch can lead to high inaccuracies. In simulations a high number of echoes proved to be more accurate with the additional benefit of higher precision and could produce noise-mitigated T2∗-maps in vivo.Acknowledgements
The present work was supported by the European Research Council (grant agreement No 677661 – ProFatMRI) and Philips Healthcare.References
[1] Hamilton, G., Smith, D. L., Bydder, M., Nayak, K. S., & Hu, H. H., Mr properties of brown and white adipose tissues, Journal of Magnetic Resonance Imaging, 34(2), 468–473 (2011). http://dx.doi.org/10.1002/jmri.22623
[2] Hamilton, G., Yokoo, T., Bydder, M., Cruite, I., Schroeder, M. E., Sirlin, C. B., & Middleton, M. S., In vivo characterization of the liver fat 1h mr spectrum, NMR in Biomedicine, 24(7), 784–790 (2010). http://dx.doi.org/10.1002/nbm.1622
[3] Hamilton, G., Schlein, A. N., Middleton, M. S., Hooker, C. A., Wolfson, T., Gamst, A. C., Loomba, R., Sirlin, C. B., .., In vivo triglyceride composition of abdominal adipose tissue measured by 1 h mrs at 3t, Journal of Magnetic Resonance Imaging, 45(5), 1455–1463 (2016). http://dx.doi.org/10.1002/jmri.25453
[4] Yu, H., Shimakawa, A., McKenzie, C. A., Brodsky, E., Brittain, J. H., & Reeder, S. B., Multiecho water-fat separation and simultaneous r2* estimation with multifrequency fat spectrum modeling, Magnetic Resonance in Medicine, 60(5), 1122–1134 (2008). http://dx.doi.org/10.1002/mrm.21737
[5] Yu, H., McKenzie, C. A., Shimakawa, A., Vu, A. T., Brau, A. C., Beatty, P. J., Pineda, A. R., Brittain, J. H., Reeder, S. B., .., Multiecho reconstruction for simultaneous water-fat decomposition and t2* estimation, Journal of Magnetic Resonance Imaging, 26(4), 1153–1161 (2007). http://dx.doi.org/10.1002/jmri.21090
[6] Pineda, A. R., Reeder, S. B., Wen, Z., & Pelc, N. J., Cramér-rao bounds for three-point decomposition of water and fat, Magnetic Resonance in Medicine, 54(3), 625–635 (2005). http://dx.doi.org/10.1002/mrm.20623
[7] Wang, X., Hernando, D., & Reeder, S. B., Sensitivity of chemical shift-encoded fat quantification to calibration of fat mr spectrum, MagneticResonance in Medicine, 75(2), 845–851 (2015). http://dx.doi.org/10.1002/mrm.25681
[8] Berglund, J., HAhlström, & Kullberg, J., Model-based mapping of fat unsaturation and chain length by chemical shift imaging-phantom validation and in vivo feasibility, Magnetic Resonance in Medicine, 68(6), 1815–1827 (2012). http://dx.doi.org/10.1002/mrm.24196
[9] Hu, H. H., Yin, L., Aggabao, P. C., Perkins, T. G., Chia, J. M., & Gilsanz, V., Comparison of brown and white adipose tissues in infants and children with chemical-shift- encoded water-fat mri, Journal of Magnetic Resonance Imaging, 38(4), 885–896 (2013). http://dx.doi.org/10.1002/jmri.24053
[10] Gifford, A., Towse, T. F., Walker, R. C., Avison, M. J., & Welch, E. B., Characterizing active and inactive brown adipose tissue in adult humans using pet-ct and mr imaging, American Journal of Physiology - Endocrinology And Metabolism, 311(1), 95–104 (2016). http://dx.doi.org/10.1152/ajpendo.00482.2015
[11] McCallister, A., Zhang, L., Burant, A., Katz, L., & Branca, R. T., A pilot study on the correlation between fat fraction values and glucose uptake values in supraclavicular fat by simultaneous pet/mri, Magnetic Resonance in Medicine, 78(5), 1922–1932 (2017). http://dx.doi.org/10.1002/mrm.26589
[12] Hui, S. C., Ko, J. K., Zhang, T., Shi, L., Yeung, D. K., Wang, D., Chan, Q., Chu, W. C., Quantification of brown and white adipose tissue based on gaussian mixture model using water-fat and t2* mri in adolescents, Journal of Magnetic Resonance Imaging, 46(3), 758–768 (2017). http://dx.doi.org/10.1002/jmri.25632
[13] Ruschke, S., Eggers, H., Kooijman, H., Diefenbach, M. N., Baum, T., Haase, A., Rummeny, E. J., Hu, H. H., Karampinos, D. C., Correction of phase errors in quantitative water-fat imaging using a monopolar time-interleaved multi-echo gradient echo sequence, Magnetic Resonance in Medicine, 78(3), 984–996 (2016). http://dx.doi.org/10.1002/mrm.26485
Figures
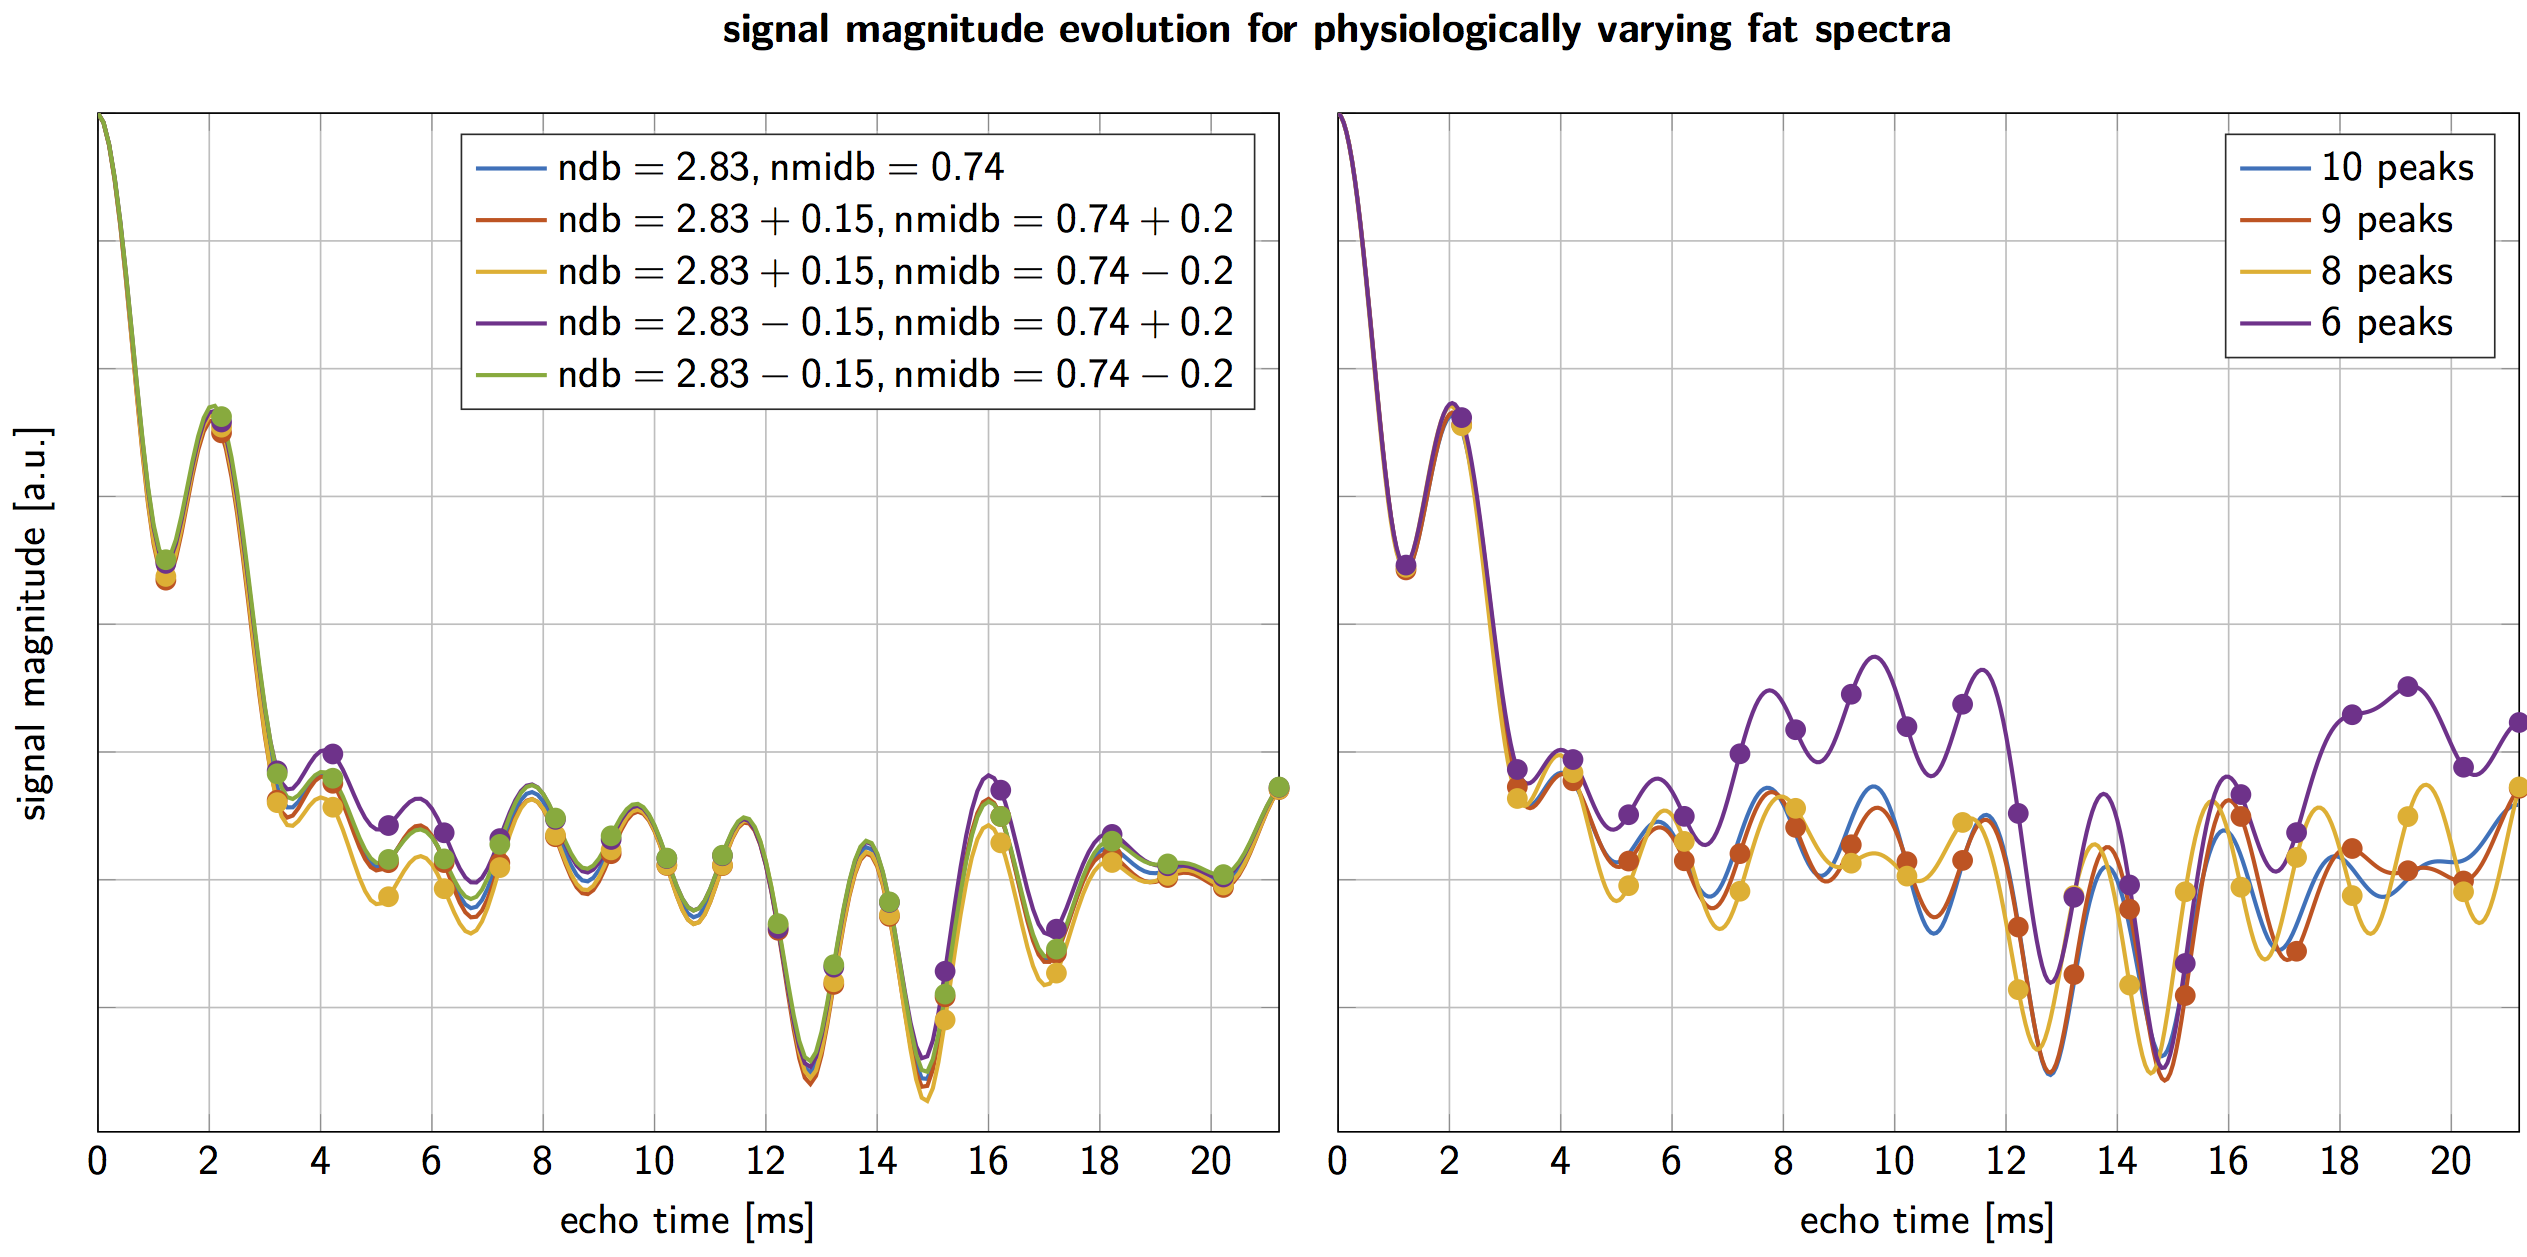
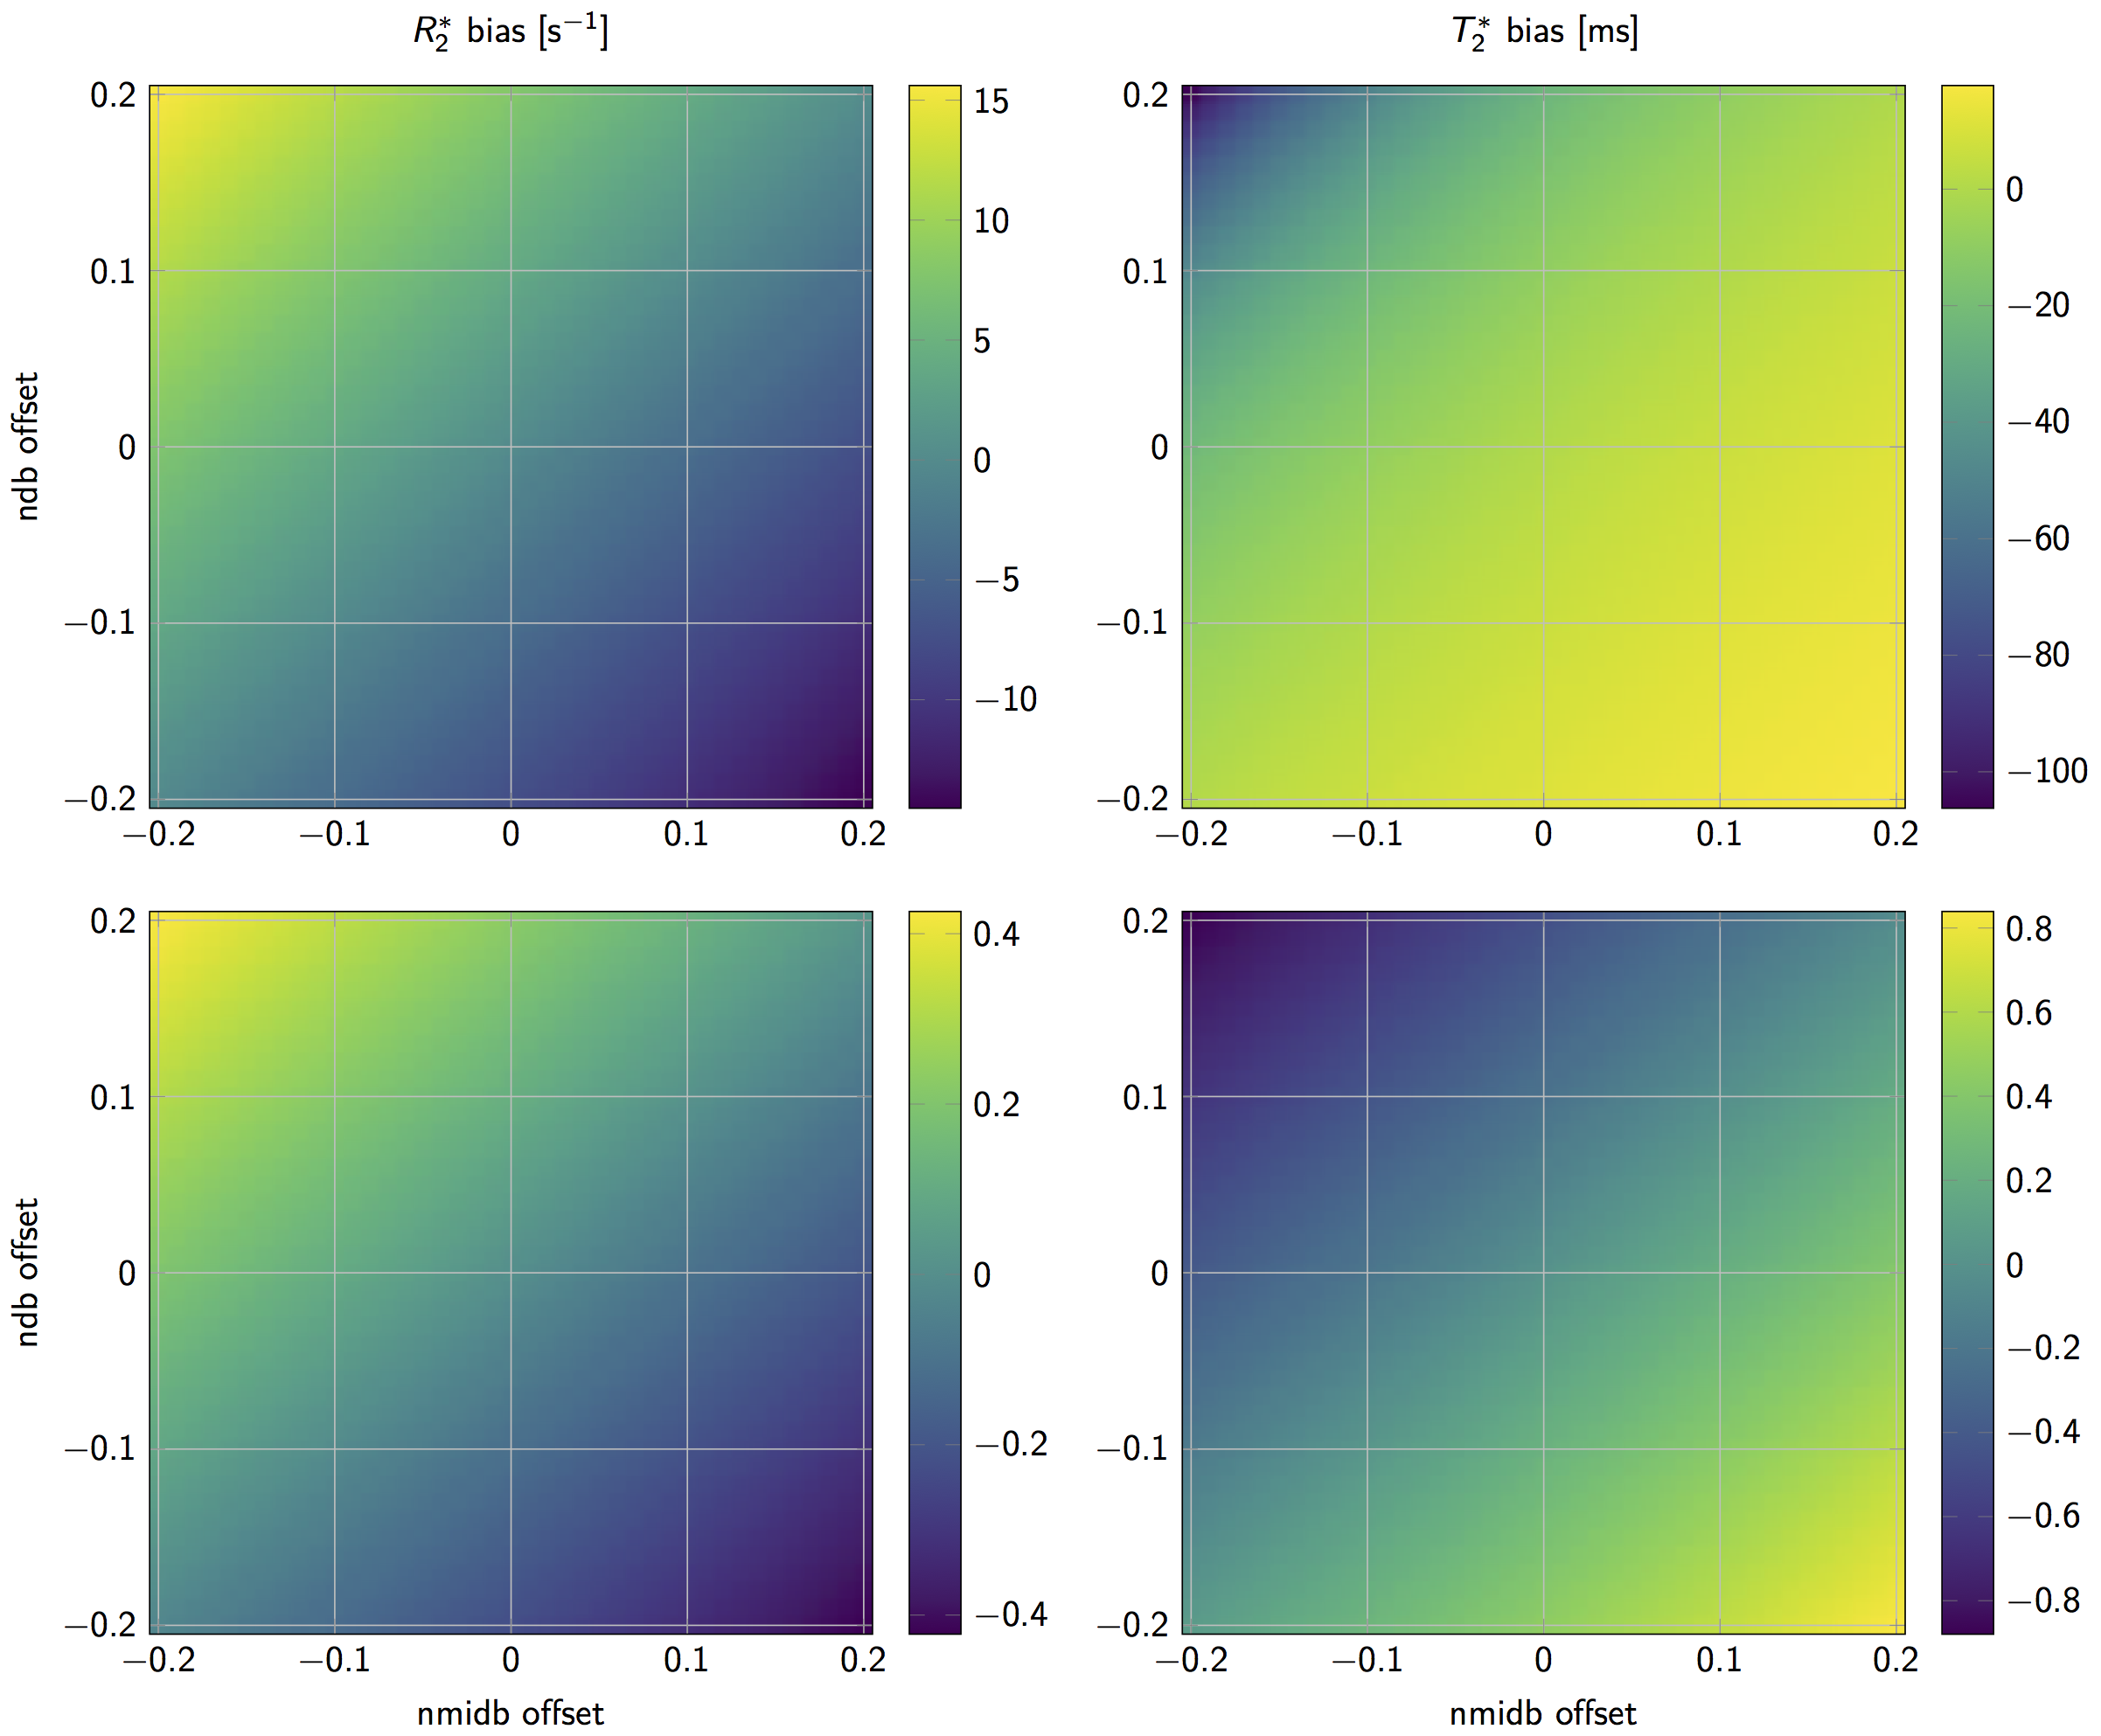
Figure 2: R2* (left) / T2* (right) bias in simulated 6 echo (top) and 20 echo (bottom) data depending on variations of ndb and nmidb offset around ground values of ndb = 2.83, nmidb = 0.74 for fixed a chain length cl = 17.5. Note how the bias range reduces drastically when comparing the top to bottom row.
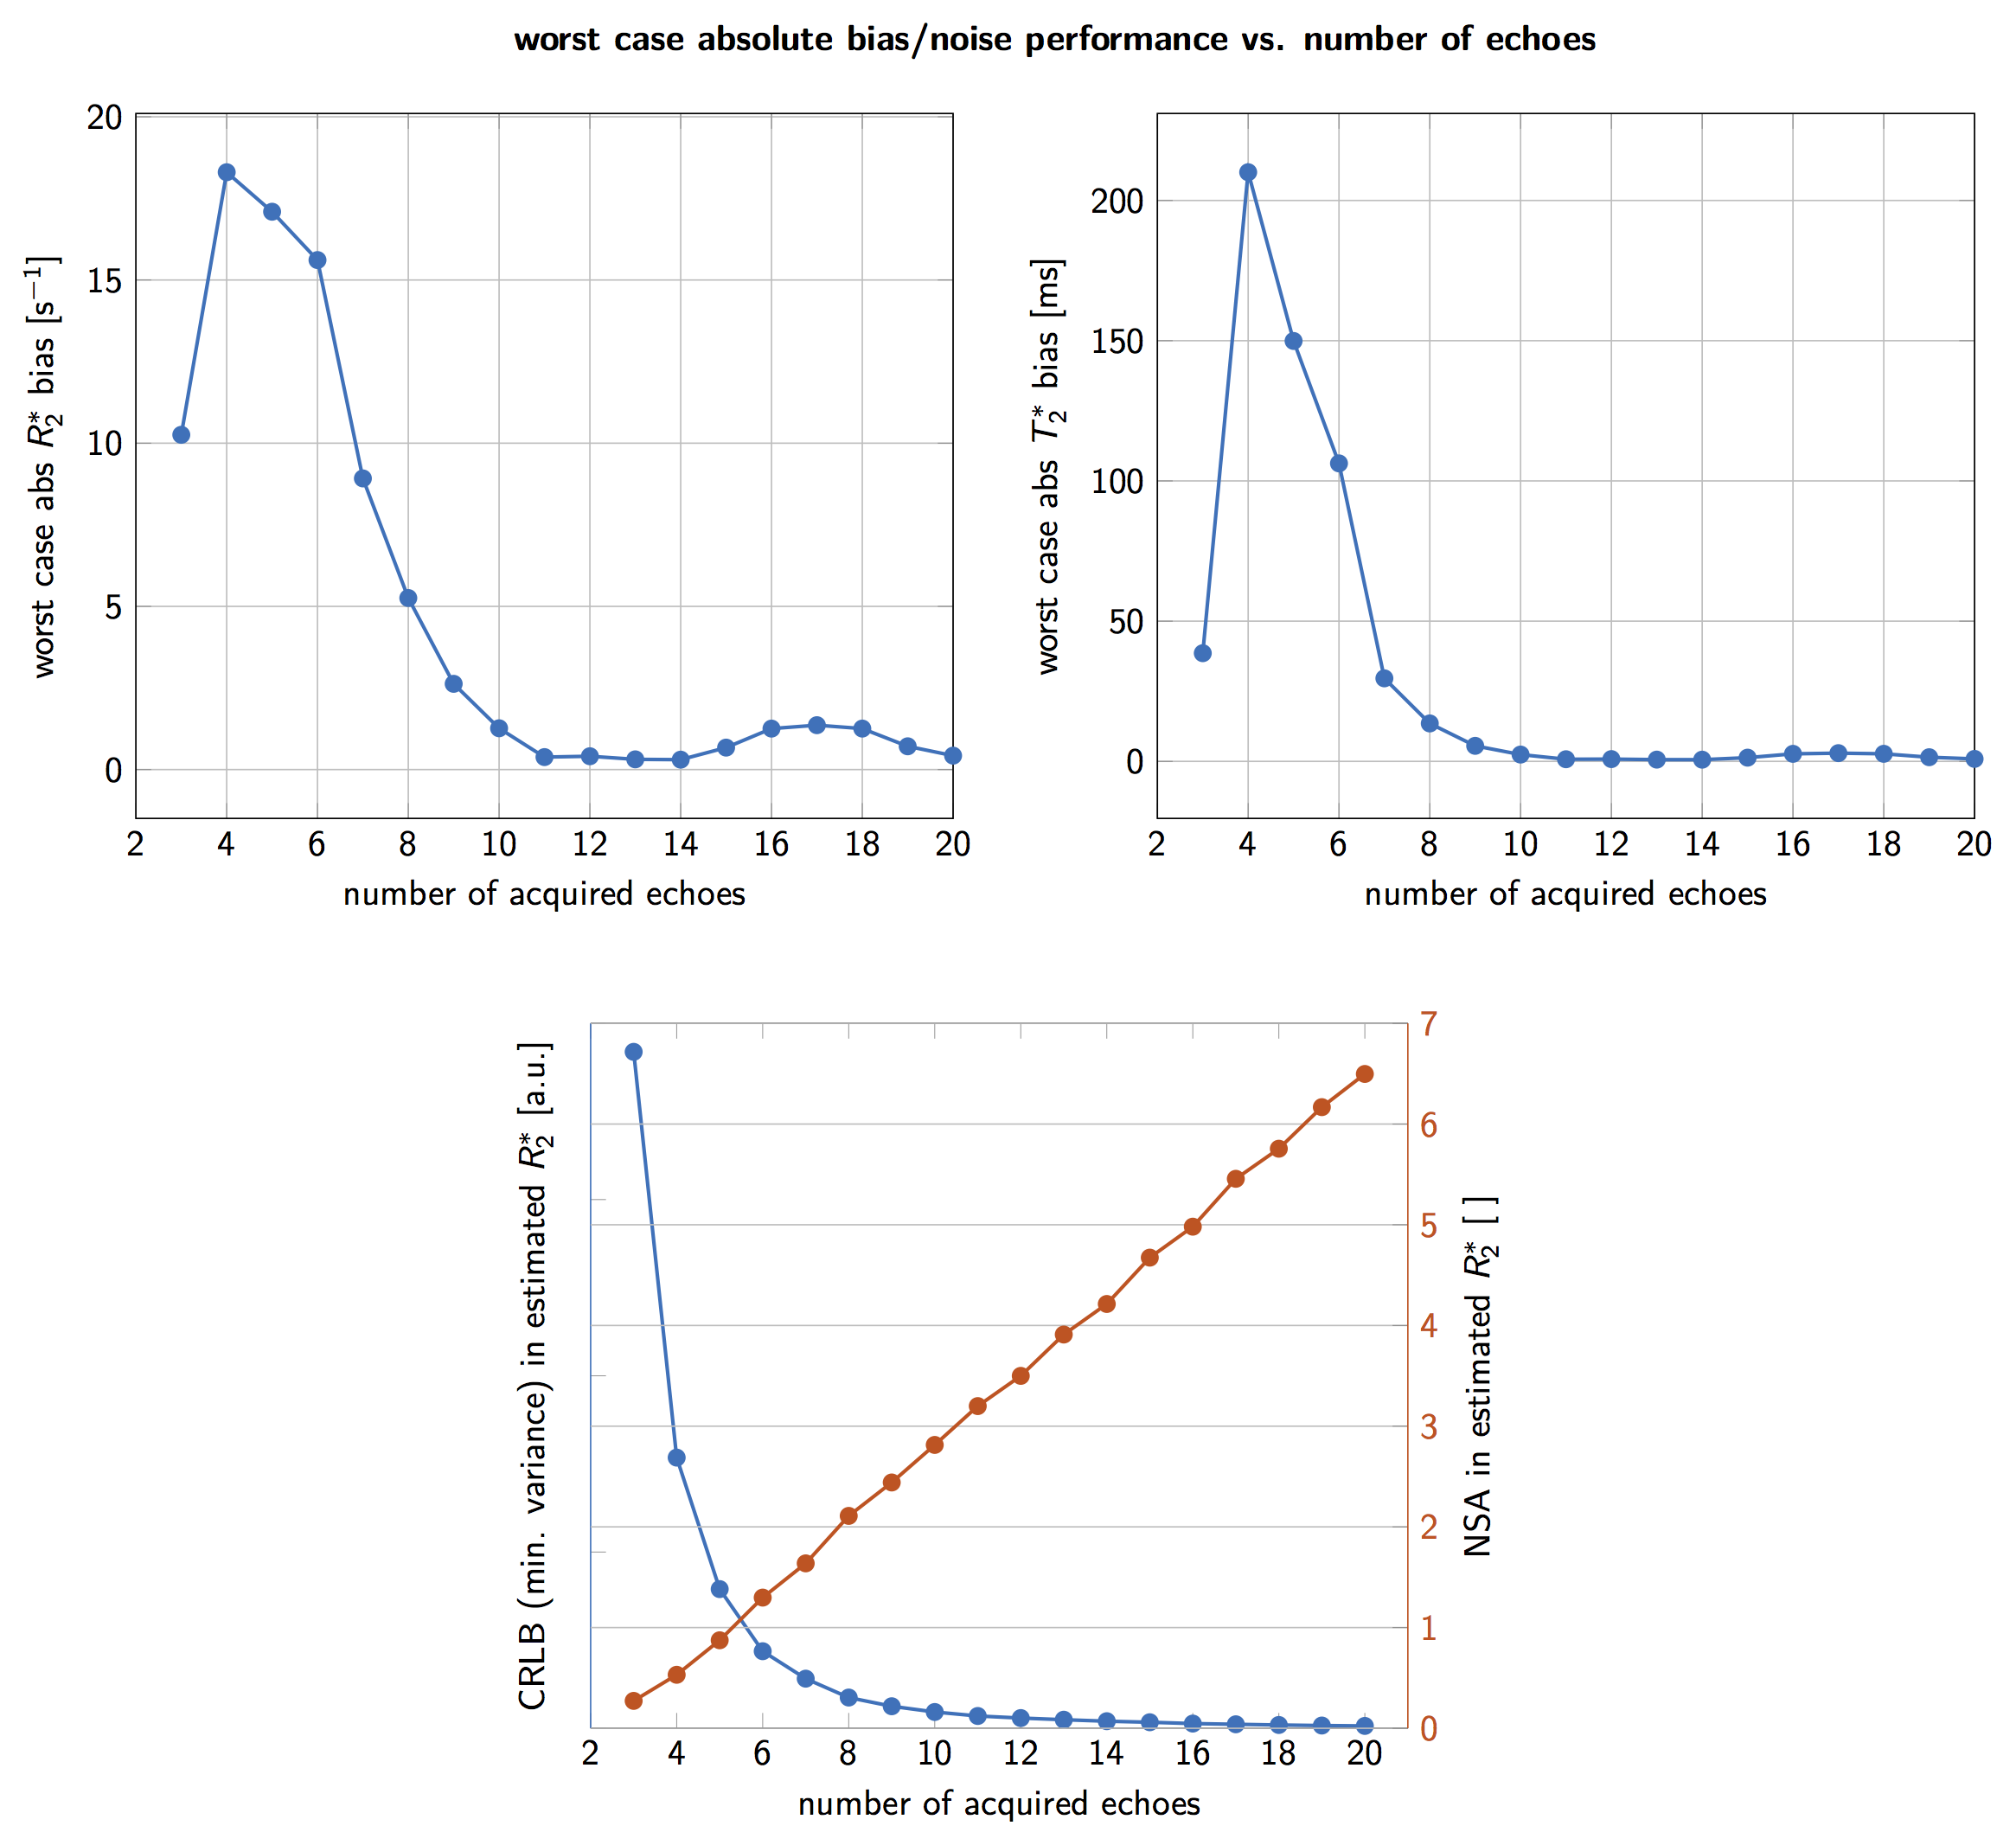
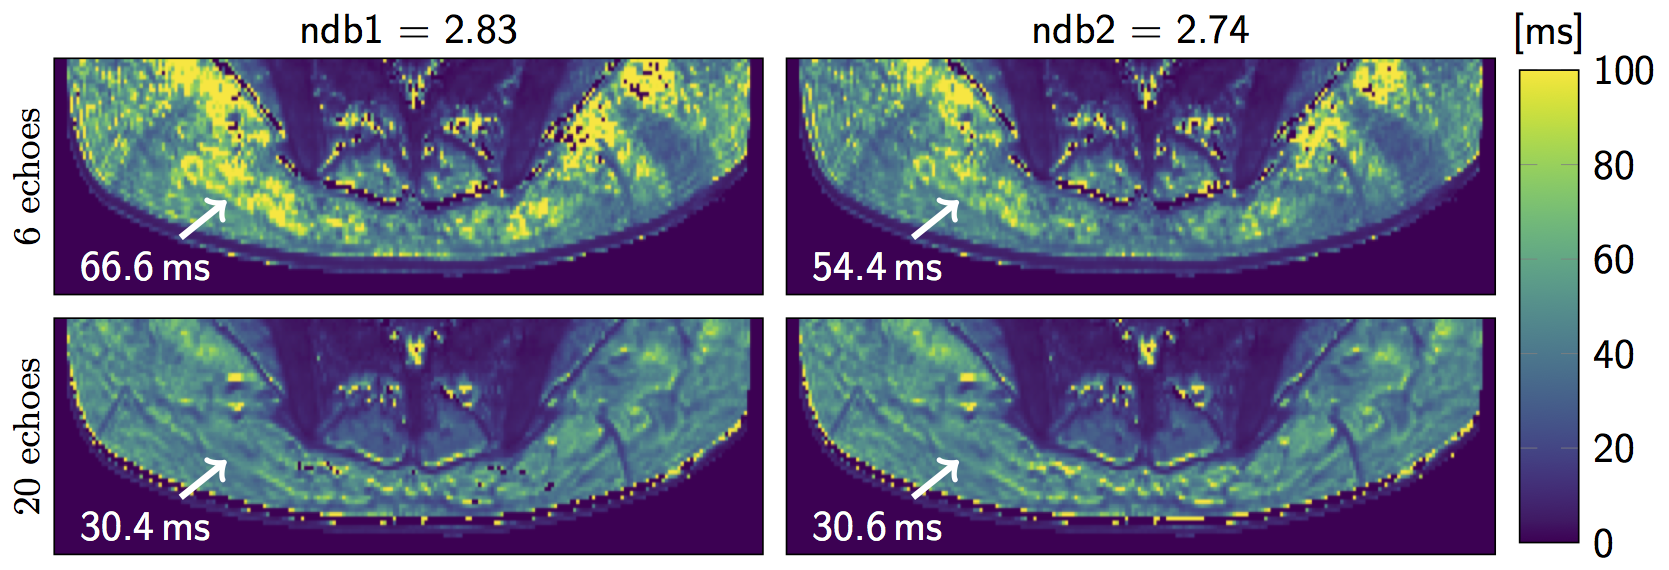
Figure 4: T2*-maps in the gluteal region of a representative healthy subject, reconstructed from 6 (top) and 20 echoes (bottom) with 9-peak fat spectra of only slightly varying peak amplitudes (ndb1 and ndb2). Arrow annotations show the estimated T2* voxel values.