5609
Multicenter Validation of the Magnetic Resonance T2* Technique for Quantification of Pancreatic Iron1Fondazione G. Monasterio CNR-Regione Toscana, Pisa, Italy, 2Presidio Ospedaliero “Giovanni Paolo II”, Lamezia Terme, Italy, 3Ospedale del Delta, Lagosanto (FE), Italy, 4Ospedale "Sandro Pertini", Roma, Italy, 5Azienda Ospedaliero-Universitaria Ospedali Riuniti "Umberto I-Lancisi-Salesi", Ancona, Italy, 6Fondazione di Ricerca e Cura "Giovanni Paolo II", Campobasso, Italy, 7Azienda Ospedaliera "Garibaldi" Presidio Ospedaliero Nesima, Catania, Italy, 8"ARNAS" Civico, Di Cristina Benfratelli, Palermo, Italy, 9Ospedale “SS. Annunziata” ASL Taranto, Taranto, Italy, 10Policlinico "Paolo Giaccone", Palermo, Italy
Synopsis
The gradient-echo T2* MRI technique is an accurate and reproducible means for the calculation of pancreatic iron and may be transferred between MRI scanners in different centers from different manufacturers
Introduction
The gradient echo multiecho T2* MRI technique is the most robust method for the non invasive, sensitive, and fast quantification of organ-specific iron overload1. A crucial aspect is the transferability of the T2* technique among different MRI scanners, in order to expand the availability of high-quality monitoring of iron accumulation to a large population. The intra- and inter-operator reproducibility, inter-study reproducibility, and inter-scanner reproducibility of the T2* MRI method for measuring iron concentrations in the heart and liver have already been demonstrated2-5. However, the transferability of the MRI multislice multiecho T2* technique for pancreatic iron overload assessment has not been evaluated.
The aim of our study was to assess the transferability of this approach among ten MRI sites belonging to the eMIOT (extension-Myocardial Iron Overload in Thalassemia) Network.
Methods
All subjects underwent MRI using conventional clinical 1.5T scanners of three main vendors.
Fifty healthy subjects, five for each site, including the reference centre, were scanned.
Five patients with thalassemia were scanned locally at each site and were rescanned at the reference site in Pisa within 1 month.
T2* image analysis was performed using custom-written, previously validated software (HIPPO MIOT®). T2* values over pancreatic head, body and tail were calculated and the global pancreatic T2* value was obtained as the mean. The lowest threshold of normal T2* value was 26 ms6.
Results
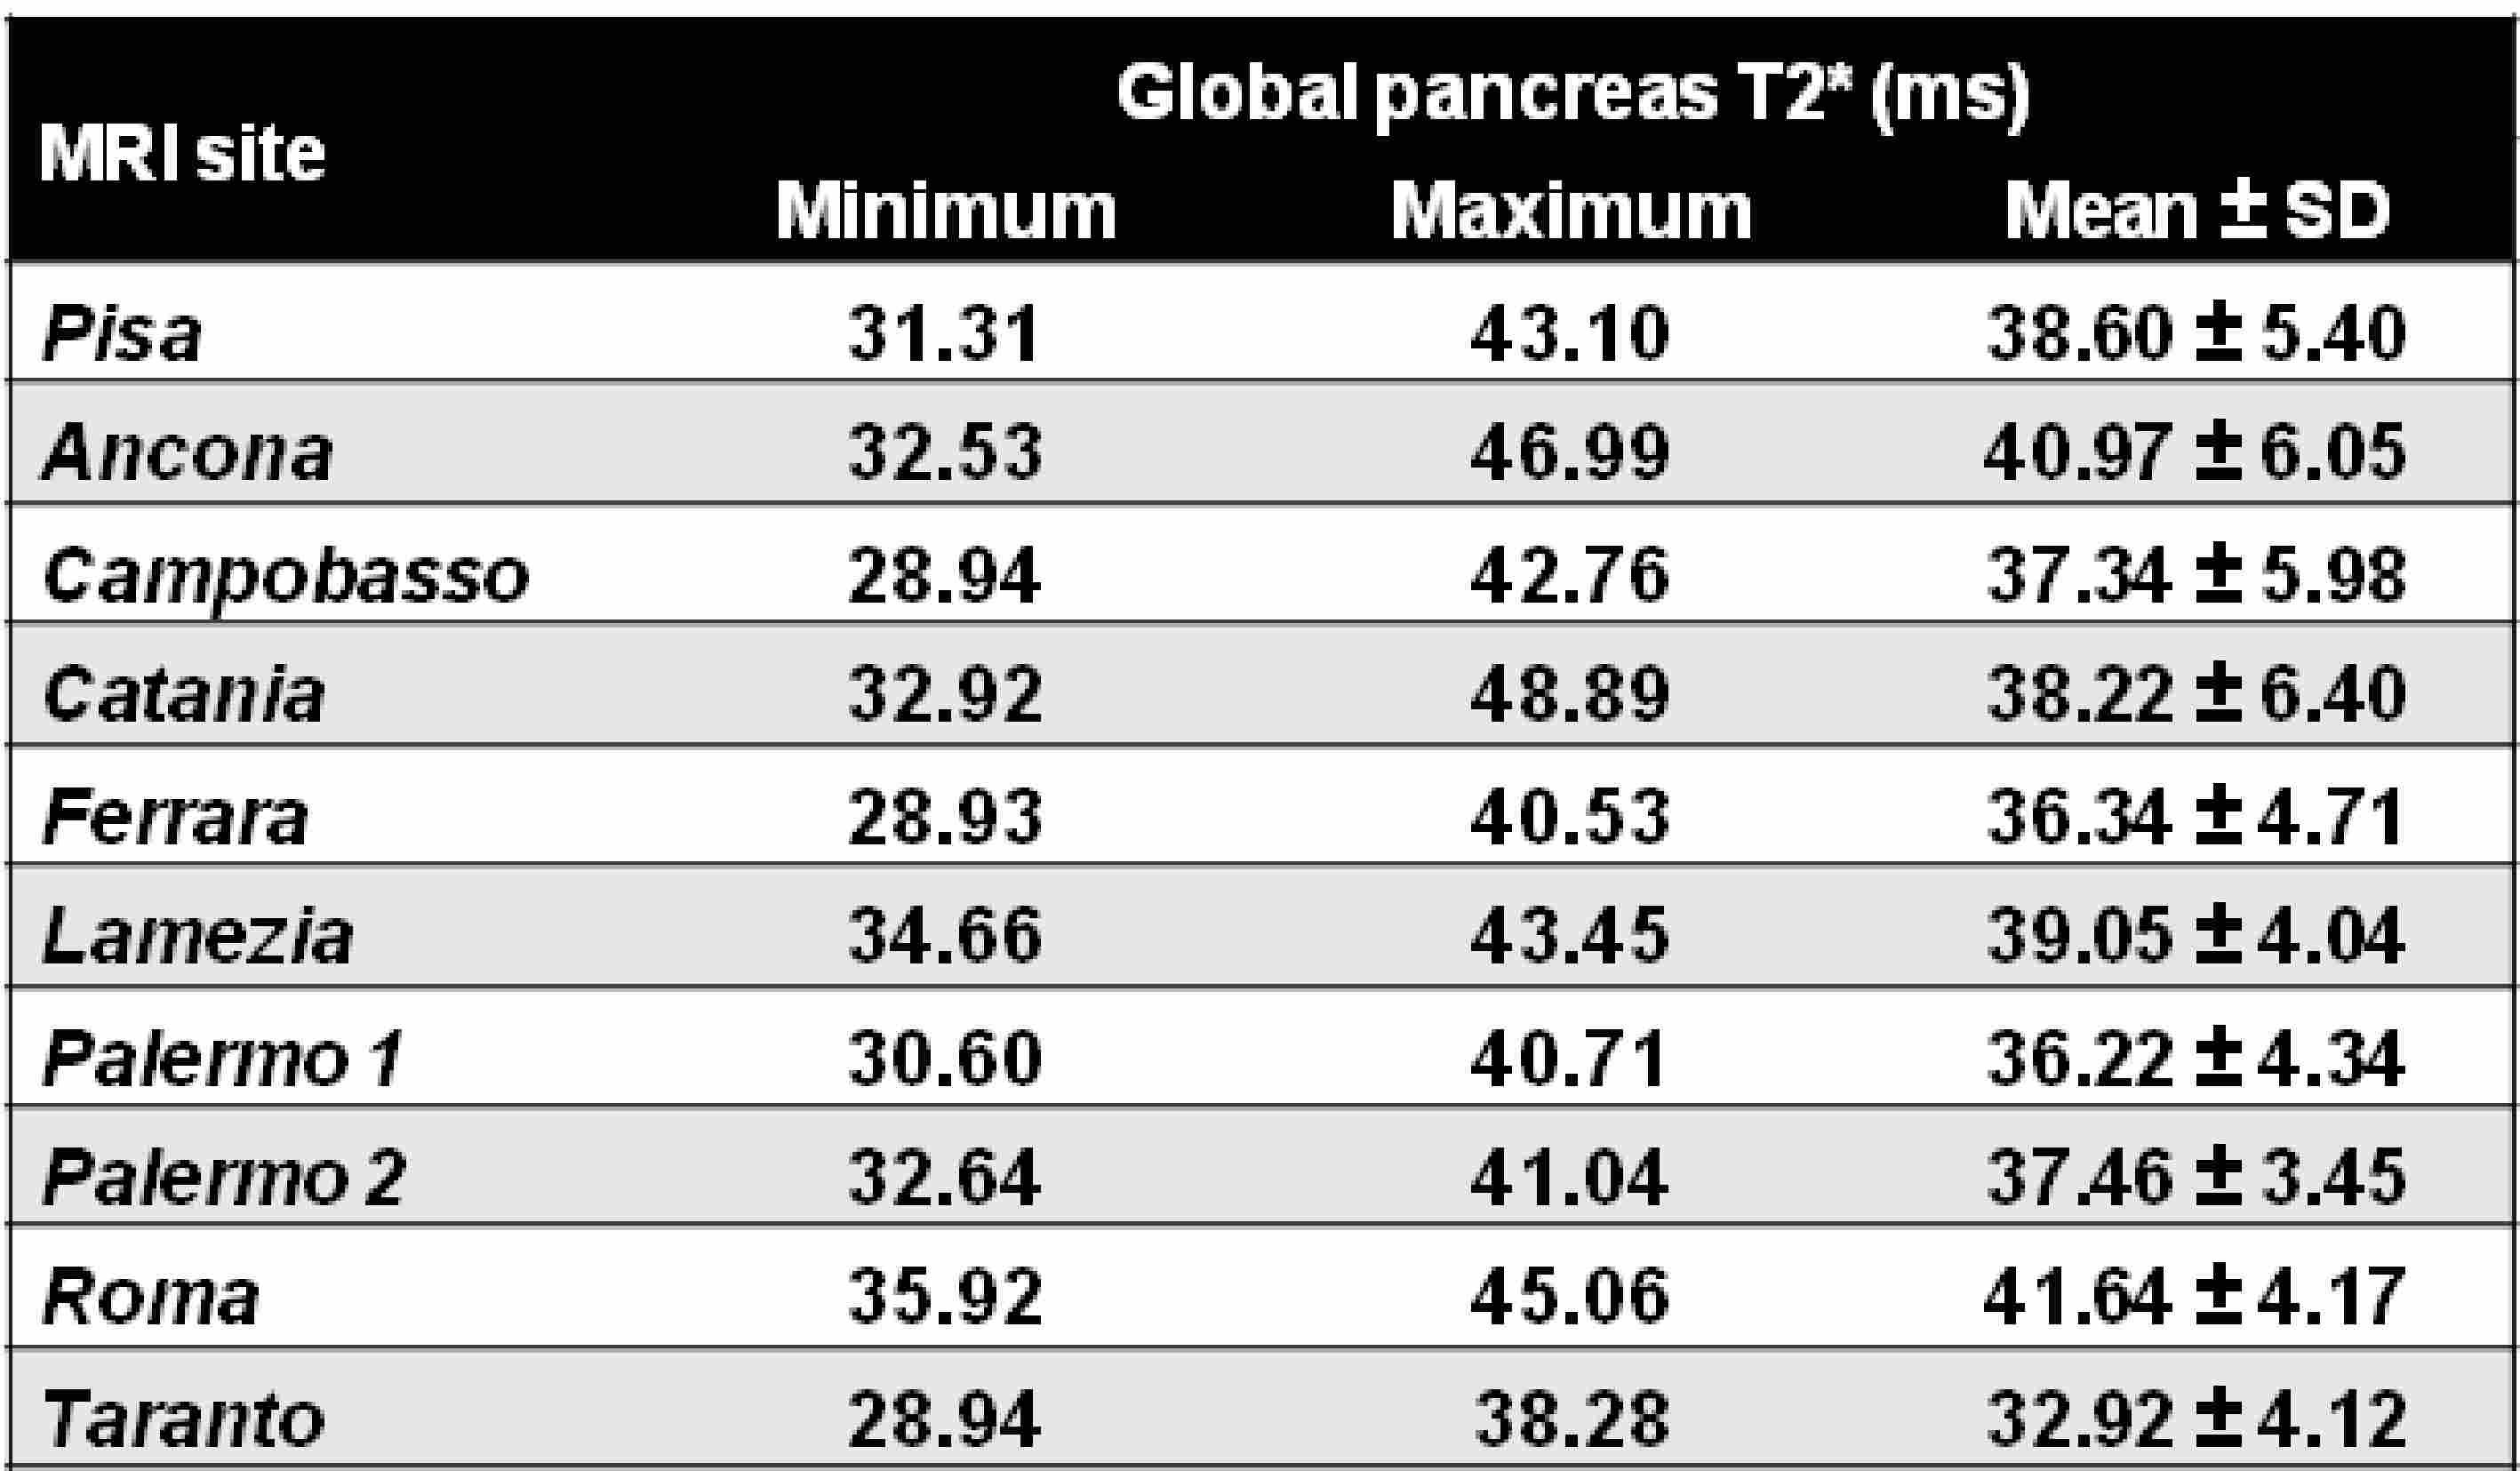
On healthy subjects the global pancreas T2* values ranged from 28.93 to 48.89 ms. Table 1 shows the minimum, maximum and mean global pancreas T2* value for each site. No significant difference was detected among the sites (P=0.334).
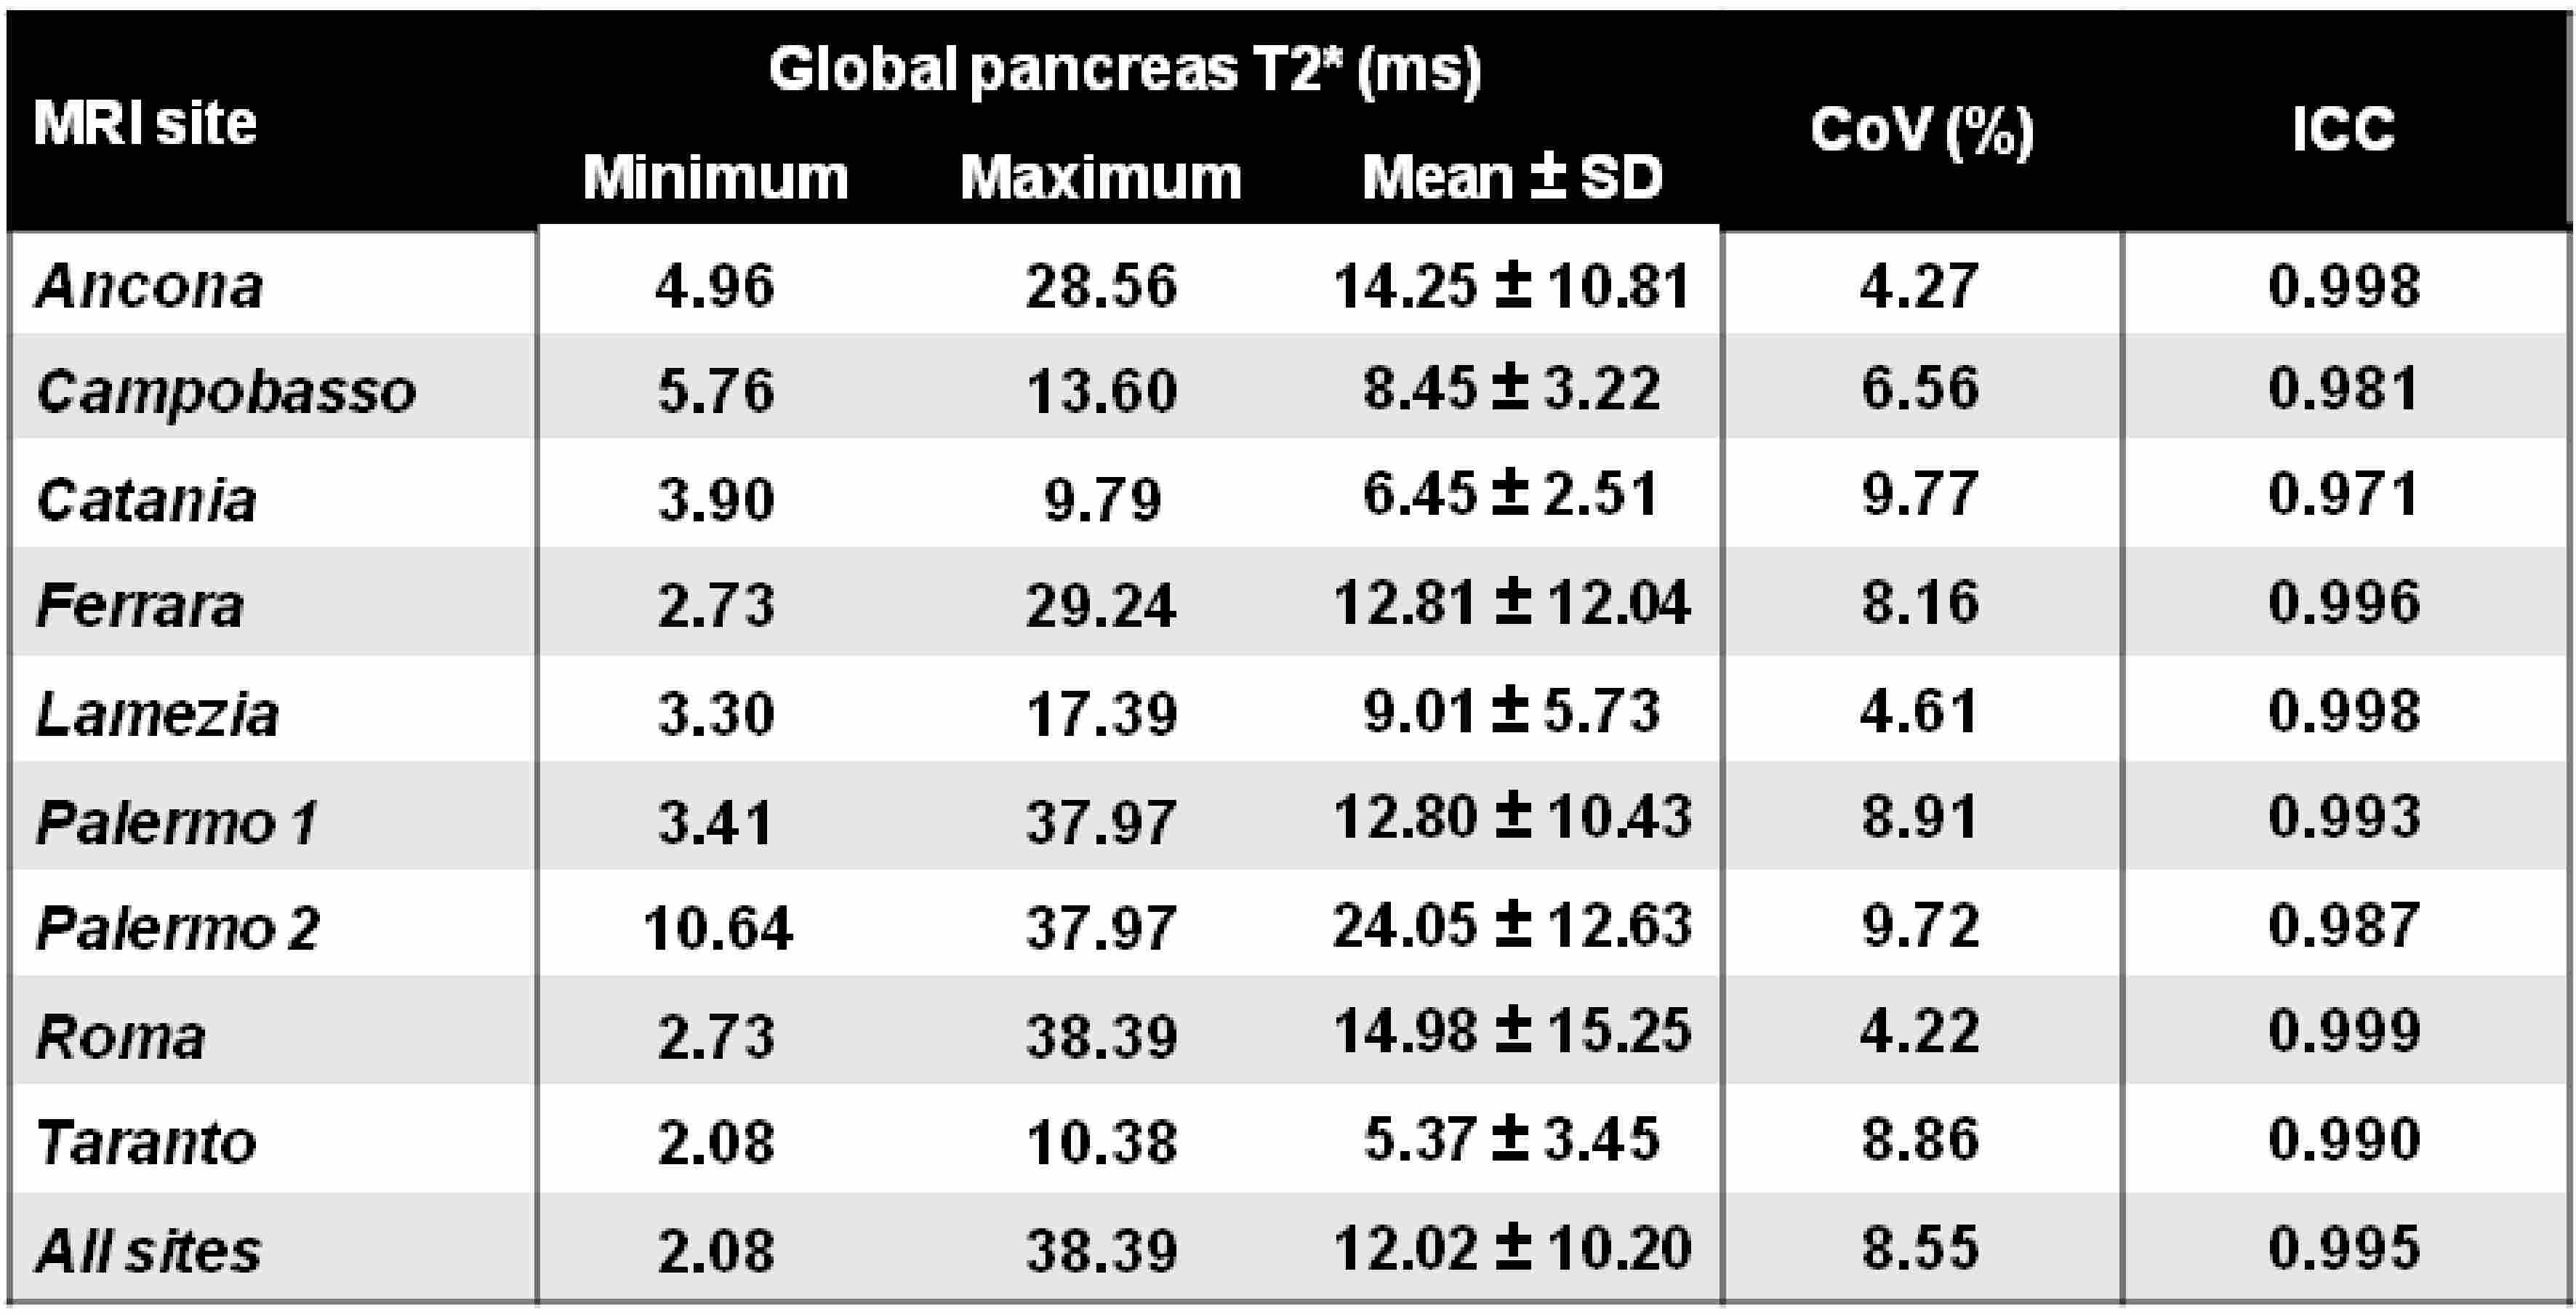
Table 2 shows the global pancreas T2* values measured at the different MRI sites. The global pancreas T2* values ranged from 2.08 to 38.39 ms. There was not a significant difference between the T2* values measured in the MRI sites and the correspondent values observed in Pisa (12.02±10.20 ms vs 11.98±10.47 ms; P=0.808). All patients categorized as having pancreatic iron overload in the MRI sites, fell in the same category after the MRI executed in Pisa. There was a strong correlation between the global pancreas T2* values calculated from images obtained in Pisa and at the other MRI sites (R=0.978, P<0.0001).
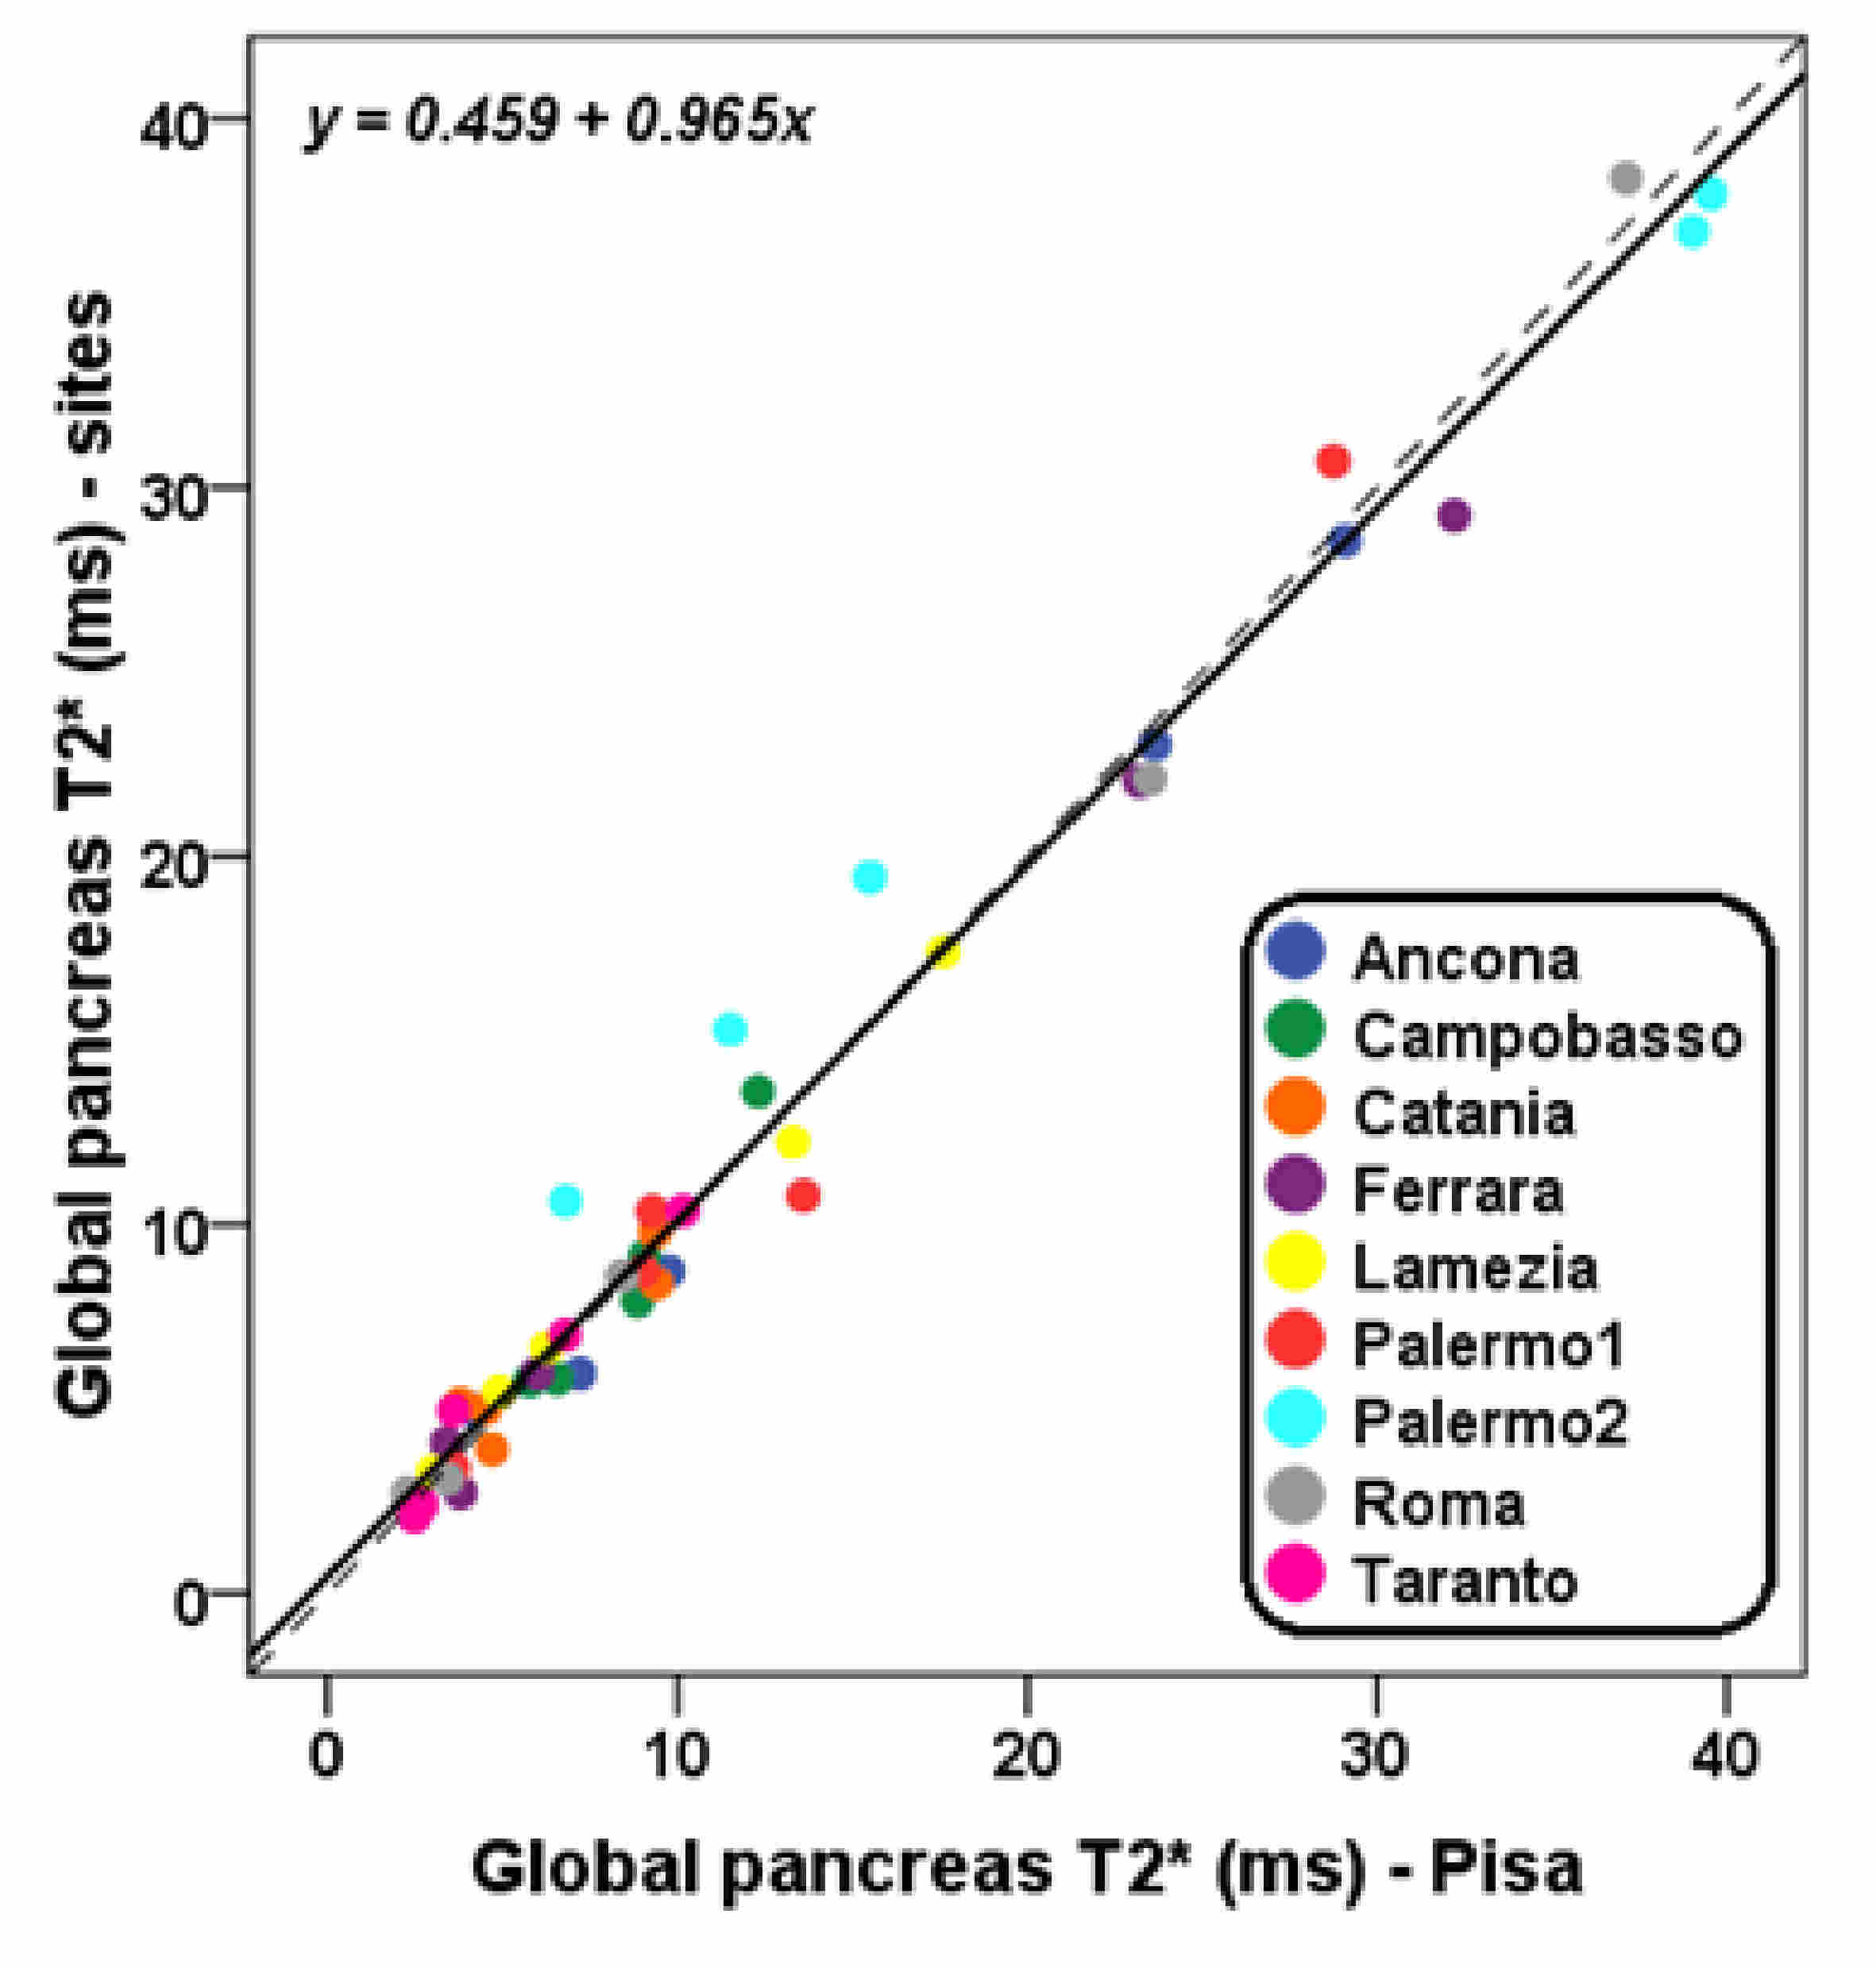
Figure 1 shows the global pancreas T2* values calculated from images obtained at the 9 MRI sites as a function of global pancreas T2* calculated from images obtained in Pisa. The line of best fit had a slope of 0.965 ± 0.021 and an intercept of 0.459 ± 0.328 ms. The R-squared value for the fit was 0.981. Neither constant bias (intercept did not significantly differs from zero) nor proportional bias (angular coefficient did not significantly differ from 1) affected the measurements.
Coeffients of variability (CoVs) for all MRI sites are provided in Table 2; they ranged from 4.22 to 9.77%. The CoV for all the T2* values independently from the sites was 8.55%.
The intraclass correlation coefficient (ICC) considering all the T2* values, independently from the sites, was 0.995. The ICC for each MRI site is provided in Table 2 and it was always excellent.
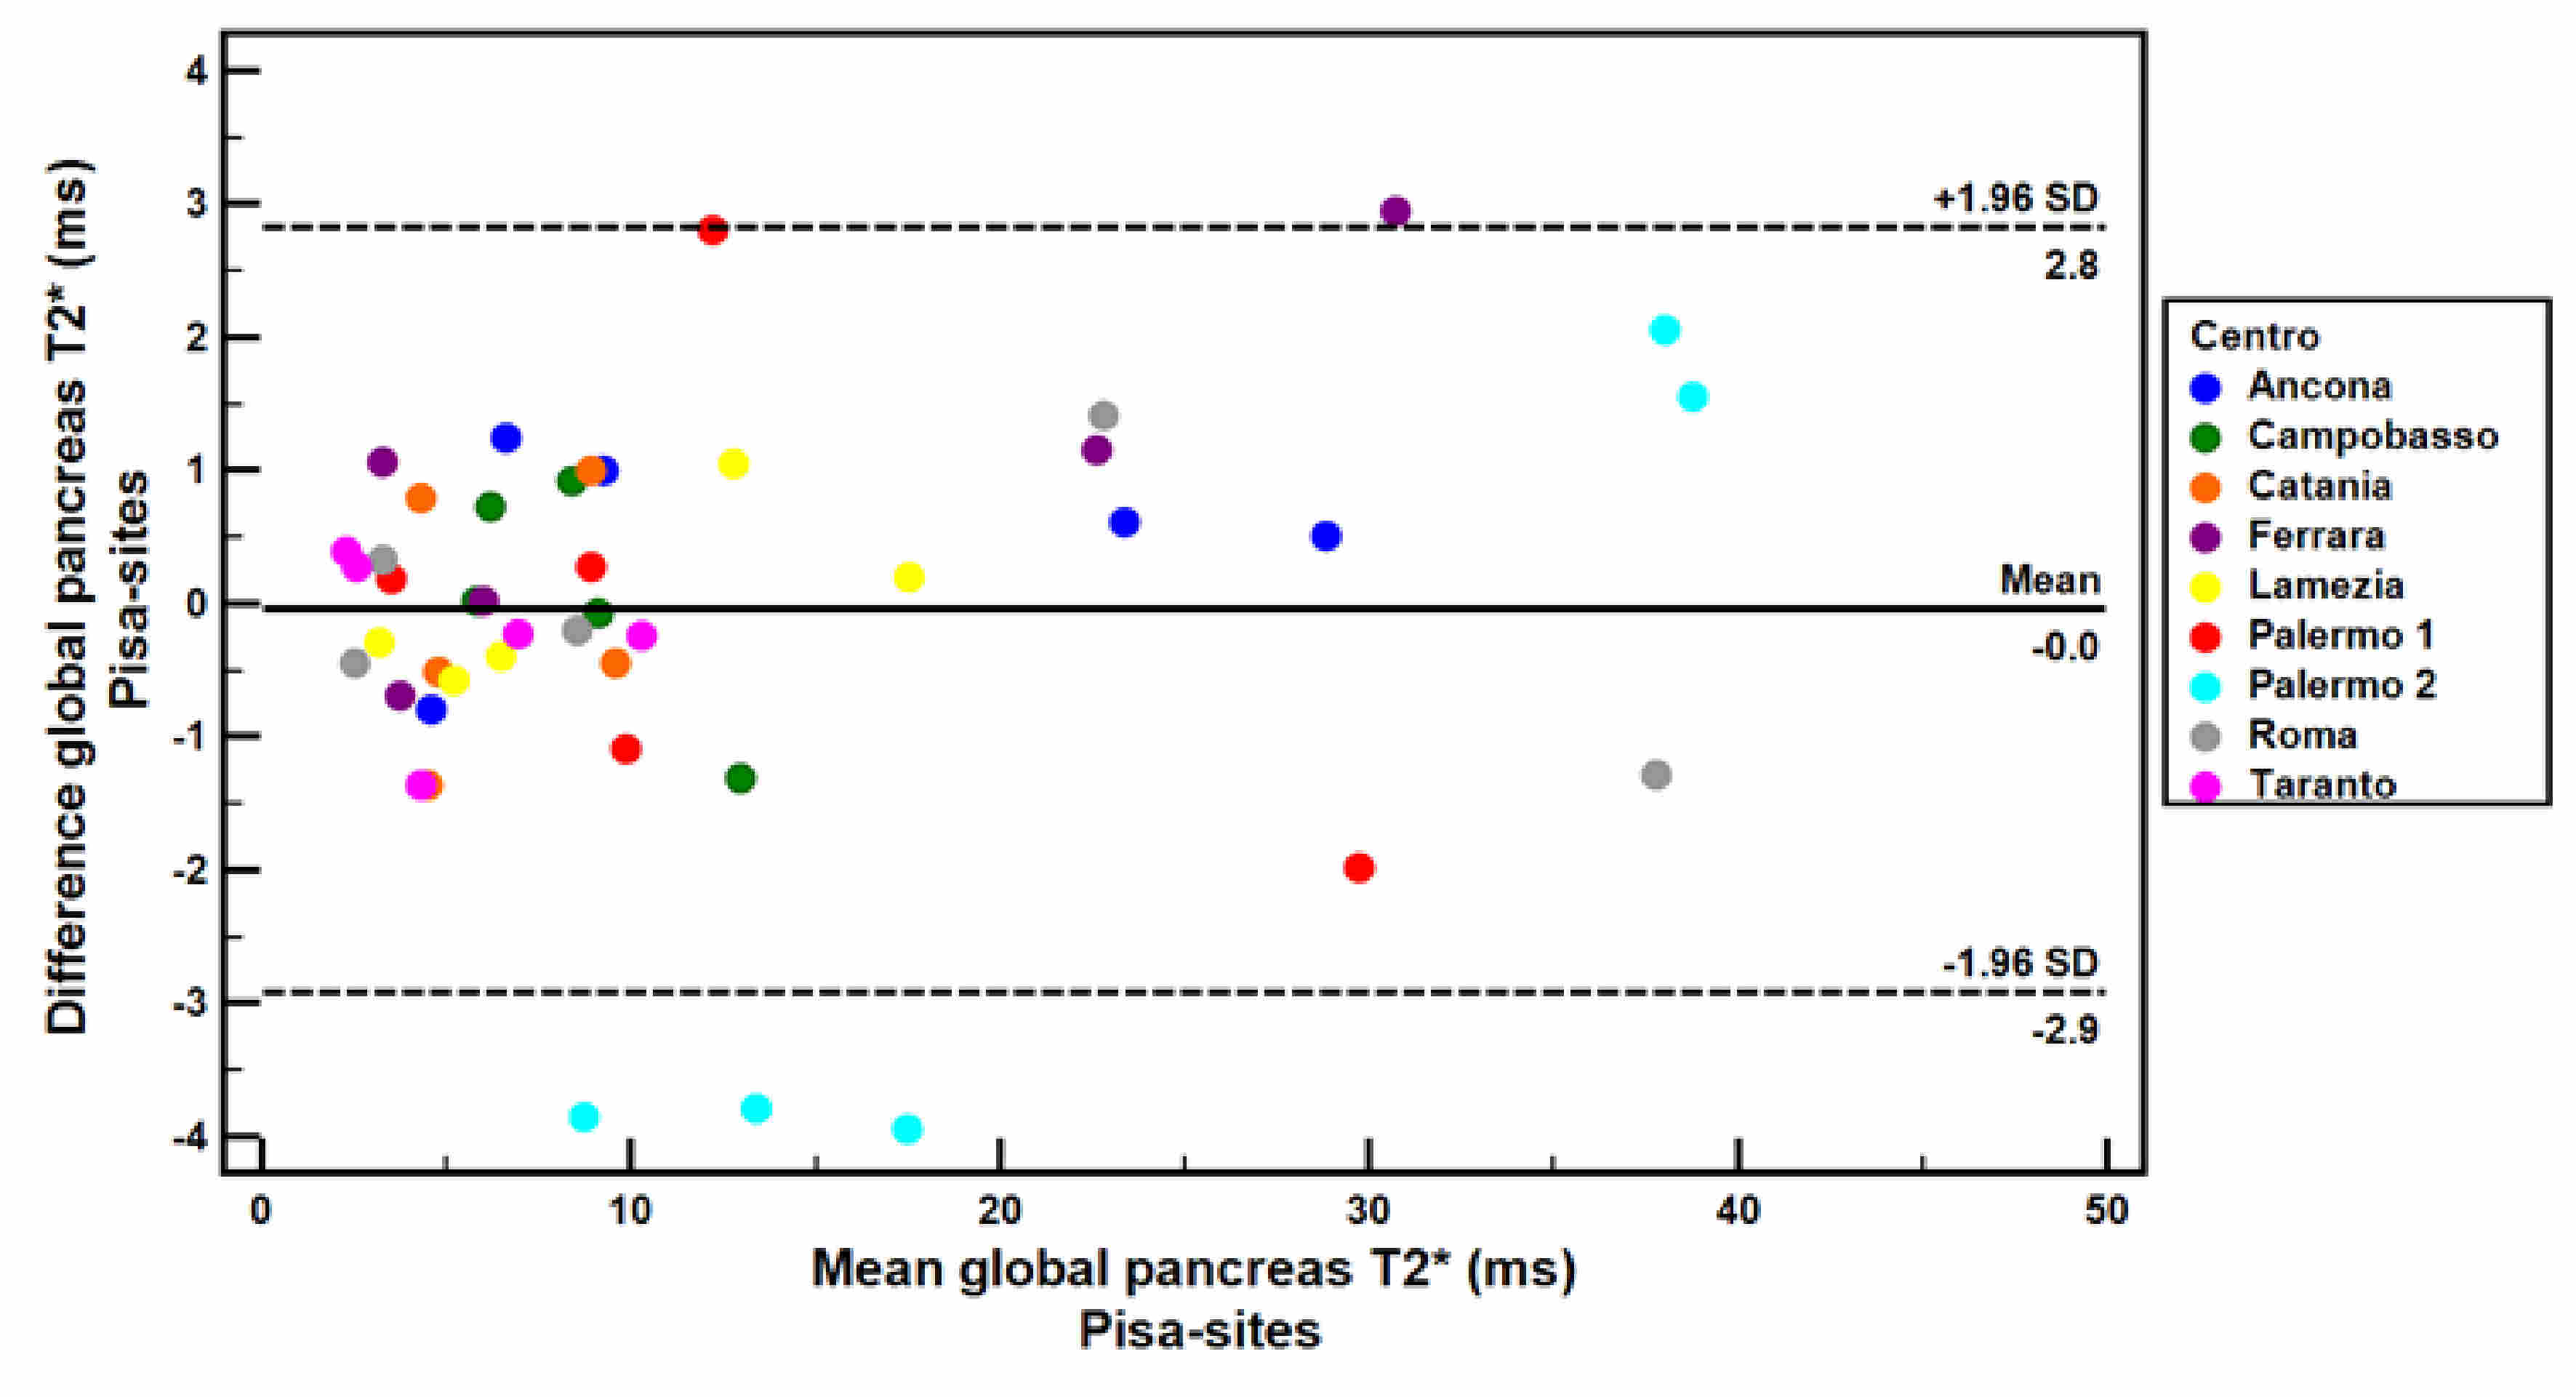
The comparison between Pisa and the other MRI sites by Bland–Altman analysis showed a mean absolute difference of -0.04 ± 1.47 ms for the global pancreas T2* values (Figure 2). No bias was present and no greater differences for higher T2* values were detected.
Conclusion
The gradient-echo T2* MRI technique is an accurate and reproducible means for the calculation of pancreatic iron and may be transferred between MRI scanners in different centers from different manufacturers.Acknowledgements
We would like to thank all the colleagues involved in the eMIOT project (https://emiot.ftgm.it/) and all patients for their "double" cooperationReferences
1. Wood JC, Ghugre N. Magnetic resonance imaging assessment of excess iron in thalassemia, sickle cell disease and other iron overload diseases. Hemoglobin 2008;32(1-2):85-96.
2. Westwood MA, Anderson LJ, Firmin DN, et al. Interscanner reproducibility of cardiovascular magnetic resonance T2* measurements of tissue iron in thalassemia. J Magn Reson Imaging 2003;18(5):616-620.
3. Westwood MA, Firmin DN, Gildo M, et al. Intercentre reproducibility of magnetic resonance T2* measurements of myocardial iron in thalassaemia. Int J Cardiovasc Imaging 2005;21(5):531-538.
4. Pepe A, Lombardi M, Positano V, et al. Evaluation of the efficacy of oral deferiprone in beta-thalassemia major by multislice multiecho T2*. Eur J Haematol 2006;76(3 ):183-192.
5. Ramazzotti A, Pepe A, Positano V, et al. Multicenter validation of the magnetic resonance t2* technique for segmental and global quantification of myocardial iron. J Magn Reson Imaging 2009;30(1):62-68.
6. Restaino G, Meloni A, Positano V, et al. Regional and global pancreatic T*(2) MRI for iron overload assessment in a large cohort of healthy subjects: Normal values and correlation with age and gender. Magn Reson Med 2011;65(3):764-769.
Figures