5606
Validation of Fat Quantitation in Human Liver using SSGR technique1Alltech Medical Systems, Chengdu, China, 2Alltech Medical System America, Solon, OH, United States
Synopsis
MRI has become the mainstay for noninvasive fat quantification in liver in routine clinical practice. To quantify fat fraction, the Dixon method is used most often. However, it is associated with a nontrivial image reconstruction process. In this study, we aim to perform fat quantification using the slice-selective gradient reversal (SSGR) technique, which was proposed previously but has not been validated in human liver. Our evaluation shows that the technique can efficiently separate water and fat, quantifying fat fraction that is highly correlated with that using the Dixon method.
Introduction
Among available fat quantification methods, the Dixon based1 MRI technique is the noninvasive fat quantification method used most often. However, Dixon is known to be associated with a complex reconstruction process2. Here we propose an alternative fat quantification method based on slice-selective gradient reversal (SSGR) 3, which is less sensitive to B1 field inhomogeneity and can generate separated water and fat images without adding additional reconstruction cost. While prior studies have demonstrated its usefulness in fat quantification in small animals4, its validation in human liver has not been done. The purpose of this study is to evaluate the method for fat quantification in human liver and compare it to the conventional two-point Dixon method.Methods
In MRI,
the slice profiles of water and fat will displace to each other due to chemical
shift. The amount of the displacement is can be theoretically calculated5,
which suggests that as long as the water-fat offset frequency ωwf is
larger than the RF pulse bandwidth ωex, water and fat slices can be
completely separated. Thus, by reversing the refocusing slice selection
gradient in FSE, i.e., SSGR, only the water or fat slice will experience both
excitation and subsequent refocusing pulses, depending on which one is set on
resonance. Once the separated fat and water images are generated, their
individual fractions can be calculated.
In this study, to validate the method for fat
quantification in human liver, both phantom and human studies were conducted on
a 1.5T MRI scanner (Centauri, Alltech Medical Systems, Chengdu, China). For
phantom studies, three tubes with a 40 mm inner diameter were filled with water/lipid
emulsion (mayonnaise), pure water and pure oil,
respectively. Fat and water images were obtained in two separate scans using the
SSGR with the center frequency set on fat and water, respectively. Other
imaging parameters were TR/TE = 2000 ms/22 ms, ETL = 3, slice thickness = 6 mm,
resolution = 1.3 mm x 1.45 mm. For a comparison purpose, a conventional FSE
sequence with fat suppression methods of CHESS were also scanned. For
human studies, a total of twelve volunteers (age = 31.8 ± 3.4, 11 males and 1
female) were scanned. Imaging parameters were TR =1500 ms, TE = 18.5 ms, ETL =
3, resolution = 2.5 mm x 2.0 mm, slice thickness = 7 mm, and total scan time =
34 s with one breath-holding. Three ROIs of 4-5 cm2 were defined on
two consecutive slices with portal veins excluded, in which liver fat
percentage was estimated according to |F|/(|F|+|W|). Proton density weighted two-point
Dixon images were obtained with TR = 220 ms, TE = 2.85/4.5 ms , FA = 30 degree,
slice thickness = 7mm, matrix = 2.5 mm x 2 mm, total scan time=42s in two batches
with two breath-holdings. A linear regression analysis was performed to
investigate how well the fat quantitation using the SSGR correlates to the
two-point Dixon.
Results
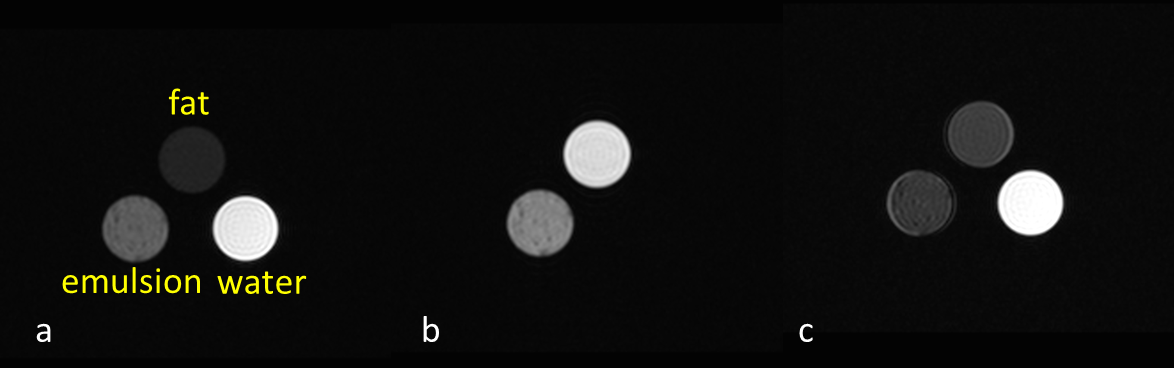
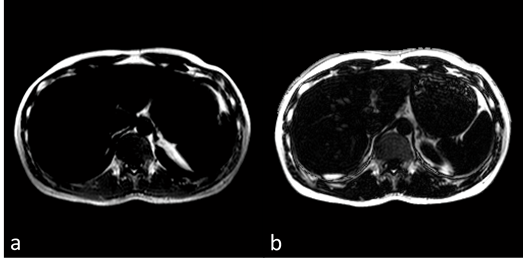
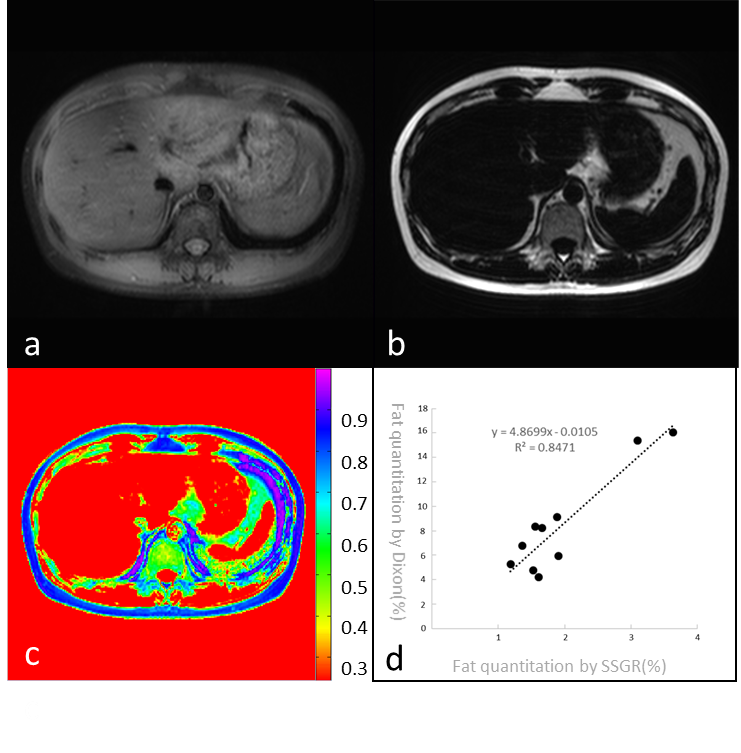
Fig. 1 shows the water (a) and fat (b) images of the phantoms acquired using the SSGR. Because the two-point Dixon on our scanner is not able to deal with pure water/fat images, we used fat saturated images with CHESS for comparison, also shown in 1(c). Fig. 2 shows the reconstructed fat images using SSGR and Dixon respectively. We found that the portal veins were mistakenly categorized as fat with the Dixon method, which were not seen in the fat images with SSGR, as illustrated in Fig 2. These two datasets were excluded for further analysis. Fig. 3 shows the water and fat proton density images from one slice of liver using the SSGR, in which (c) shows a color map of its fat percentage and (d) plots the fat fraction measured using SSGR against using the Dixon method for all ten subjects. The linear regression was performed and suggested high correlations (R2 = 0.8471, P < 0.001).Discussions
In this study, fat quantification in human liver was performed using the SSGR method. Without introducing any additional reconstruction processing, this method can provide a more accurate and efficient way to separate water and fat. A long breath-holding time was used in current study, which can be reduced by using a pulse with shorter duration in the future.Conclusions
In this study, we have validated fat quantification in human liver using SSGR against the Dixon method. Our preliminary study suggests SSGR can be used as an alternative way to quantify liver fat when a dedicated Dixon reconstruction is not available.Acknowledgements
No acknowledgement found.References
- Dixon WT. Simple proton spectroscopic imaging. Radiology.1984;153:189–194.
-
Chandarana H, Lim RP, Jensen JH, et al. Hepatic iron deposition in patients with liver disease: preliminary experience with breath-hold multiecho T2*-weighted sequence. AJR Am J Roentgenol. 2009; 193(5):1261-1267.
- Takahara T, Zwanenburg J, Visser F, et al. Fat suppression with Slice-Selection Gradient Reversal (SSGR) revisited. Presented at the ISMRM 17th Scientific Meeting & Exhibition, Honolulu, Hawai’i, USA, 2009.
- Tang H, Wu EX, Kennan R, et al. Interleaved Water and Fat Imaging and Applications to Lipid Quantitation Using the Gradient Reversal Technique. J Magn Reson Imaging. 2007;26(4):1064-1070.
- Park HW, Kim DJ, Cho ZH. Gradient reversal technique and its applications to chemical-shift-related NMR imaging. Magn Reson Med. 1987; 4:526-536.
Figures