5605
Characterize the relaxation effect during the adiabatic radiofrequency (RF) pulses on relaxation model for continuous wave constant amplitude spin-lock1Imaging and Interventional Radiology, The Chinese University of Hong Kong, Hong Kong, Hong Kong
Synopsis
Adiabatic RF pulses can be used for simultaneous compensation of B1 RF and B0 field inhomogeneity during continuous wave constant amplitude spin-lock. However, due to a relatively long duration of the adiabatic RF pulses, the relaxation effect during the adiabatic RF pulses can introduce a non-negligible effect on the conventional mono-exponential model used to describe T1rho relaxation during the spin-lock. Consequently, quantification using the conventional model can introduce errors. Based on Bloch equations, we derived that such relaxation effect contributes a DC component to the conventional mono-exponential model. We used simulation and in vivo MRI scan to demonstrate our theory.
Introduction
Adiabatic RF pulses have been used for B1 RF inhomogeneity compensation in continuous wave constant amplitude spin-lock1-3. Recently it is reported that these pulses can also be used for simultaneous compensation of B1 RF and B0 field inhomogeneity during continuous wave constant amplitude spin-lock, and can achieve superior image quality compared to the other existing methods3, 4. However, due to a relatively long duration of the adiabatic RF pulses, the relaxation effect during the adiabatic RF pulses can introduce a non-negligible effect on the conventional mono-exponential model used to describe T1rho relaxation during the spin-lock. Consequently, quantification using the conventional model can introduce errors. In reference (3), a dual acquisition method is reported to address this problem. This approach not only doubles scan time but also is inapplicable for off-resonance spin-lock. In reference (4), it was observed that such relaxation effect may be characterized by a revised relaxation model, but no theoretical derivation was provided. In this work, we provide a theoretical derivation of this revised relaxation model based on Bloch equations, and used simulation and in vivo MRI scan to demonstrate our theory.Methods
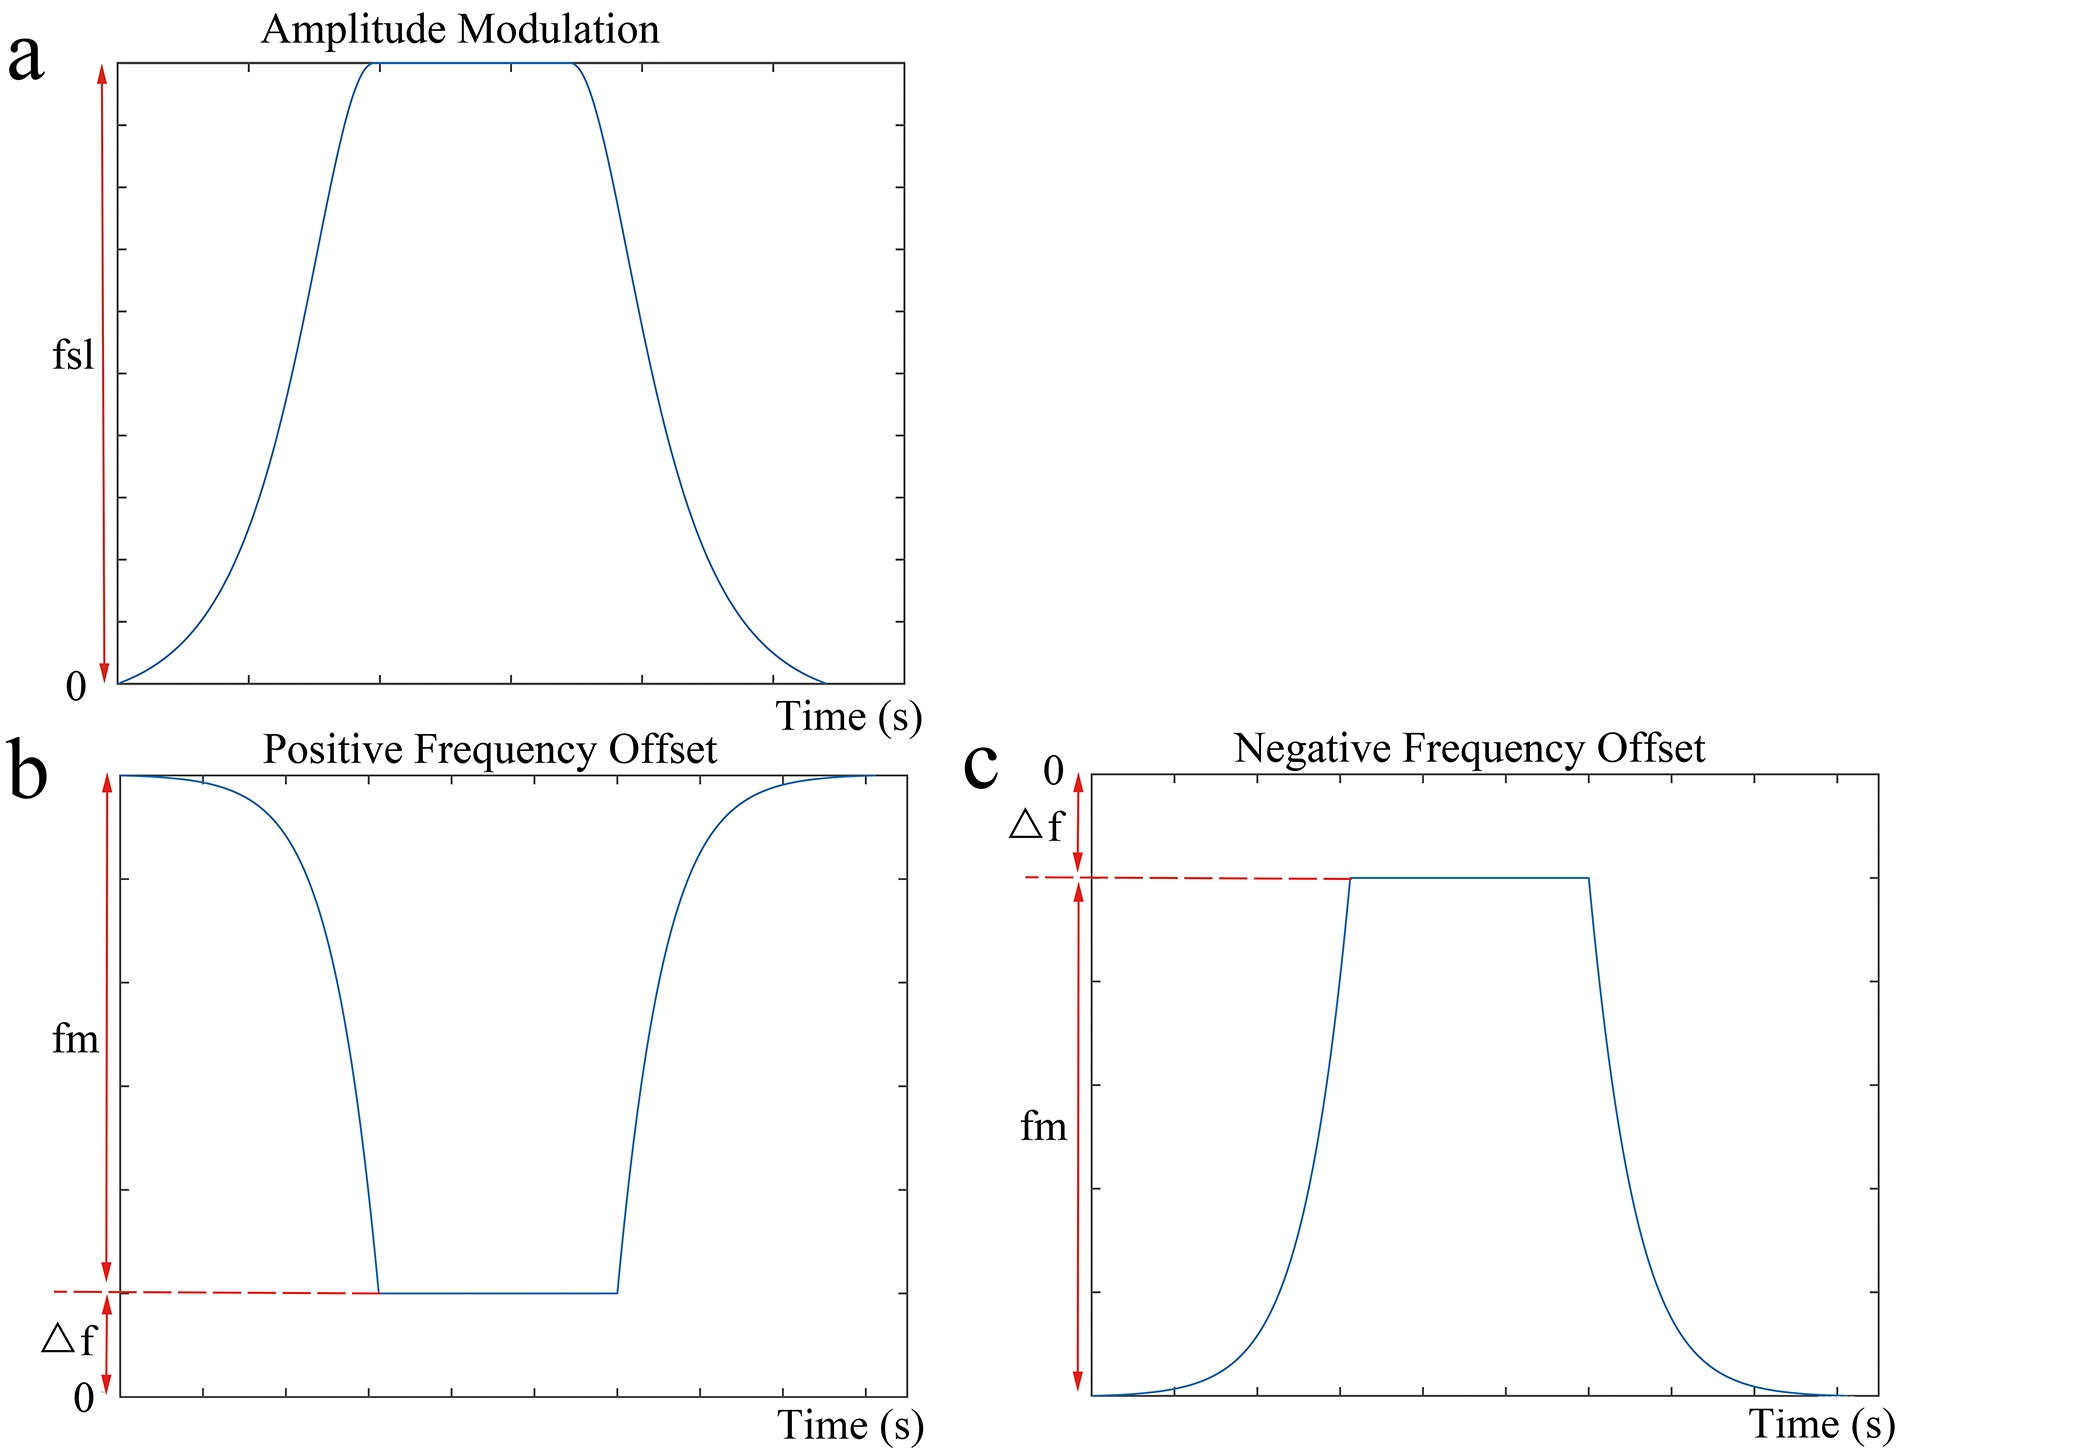
The RF pulse cluster used for simultaneous compensation of B1 RF and B0 field inhomogeneity with continuous wave constant amplitude spin-lock is shown in Figure 1. If the AHP ensures the magnetization is tipped into the direction of the effective spin-lock field under the adiabatic condition, the magnetization along the effective spin-lock field after the spin-lock RF pulse can be expressed as5,6:
M(tsl) = (Mahp - Mss)e-R1rho·TSL + Mss, [1]
where Mahp is the magnetization at the end of the AHP which is along the spin-lock direction, and Mss is the stationary solution, which is zero for on-resonance spin-lock and non-zero for off-resonance spin-lock5,6. By recursively solving the Bloch equation throughout the reverse AHP with the hard pulse approximation, the final magnetization is shown in the form
M(TSL) = Ae-R1rho·TSL + B, [2]
where TSL is the time-of-spinlock, M(TSL) is the magnetization at the end of the reverse AHP; A and B are terms independent of TSL. Eq. [2] shows that the influence on the magnetization due to the relaxation effect during the entire AHP and reverse AHP only creates a DC component to the relaxation model.
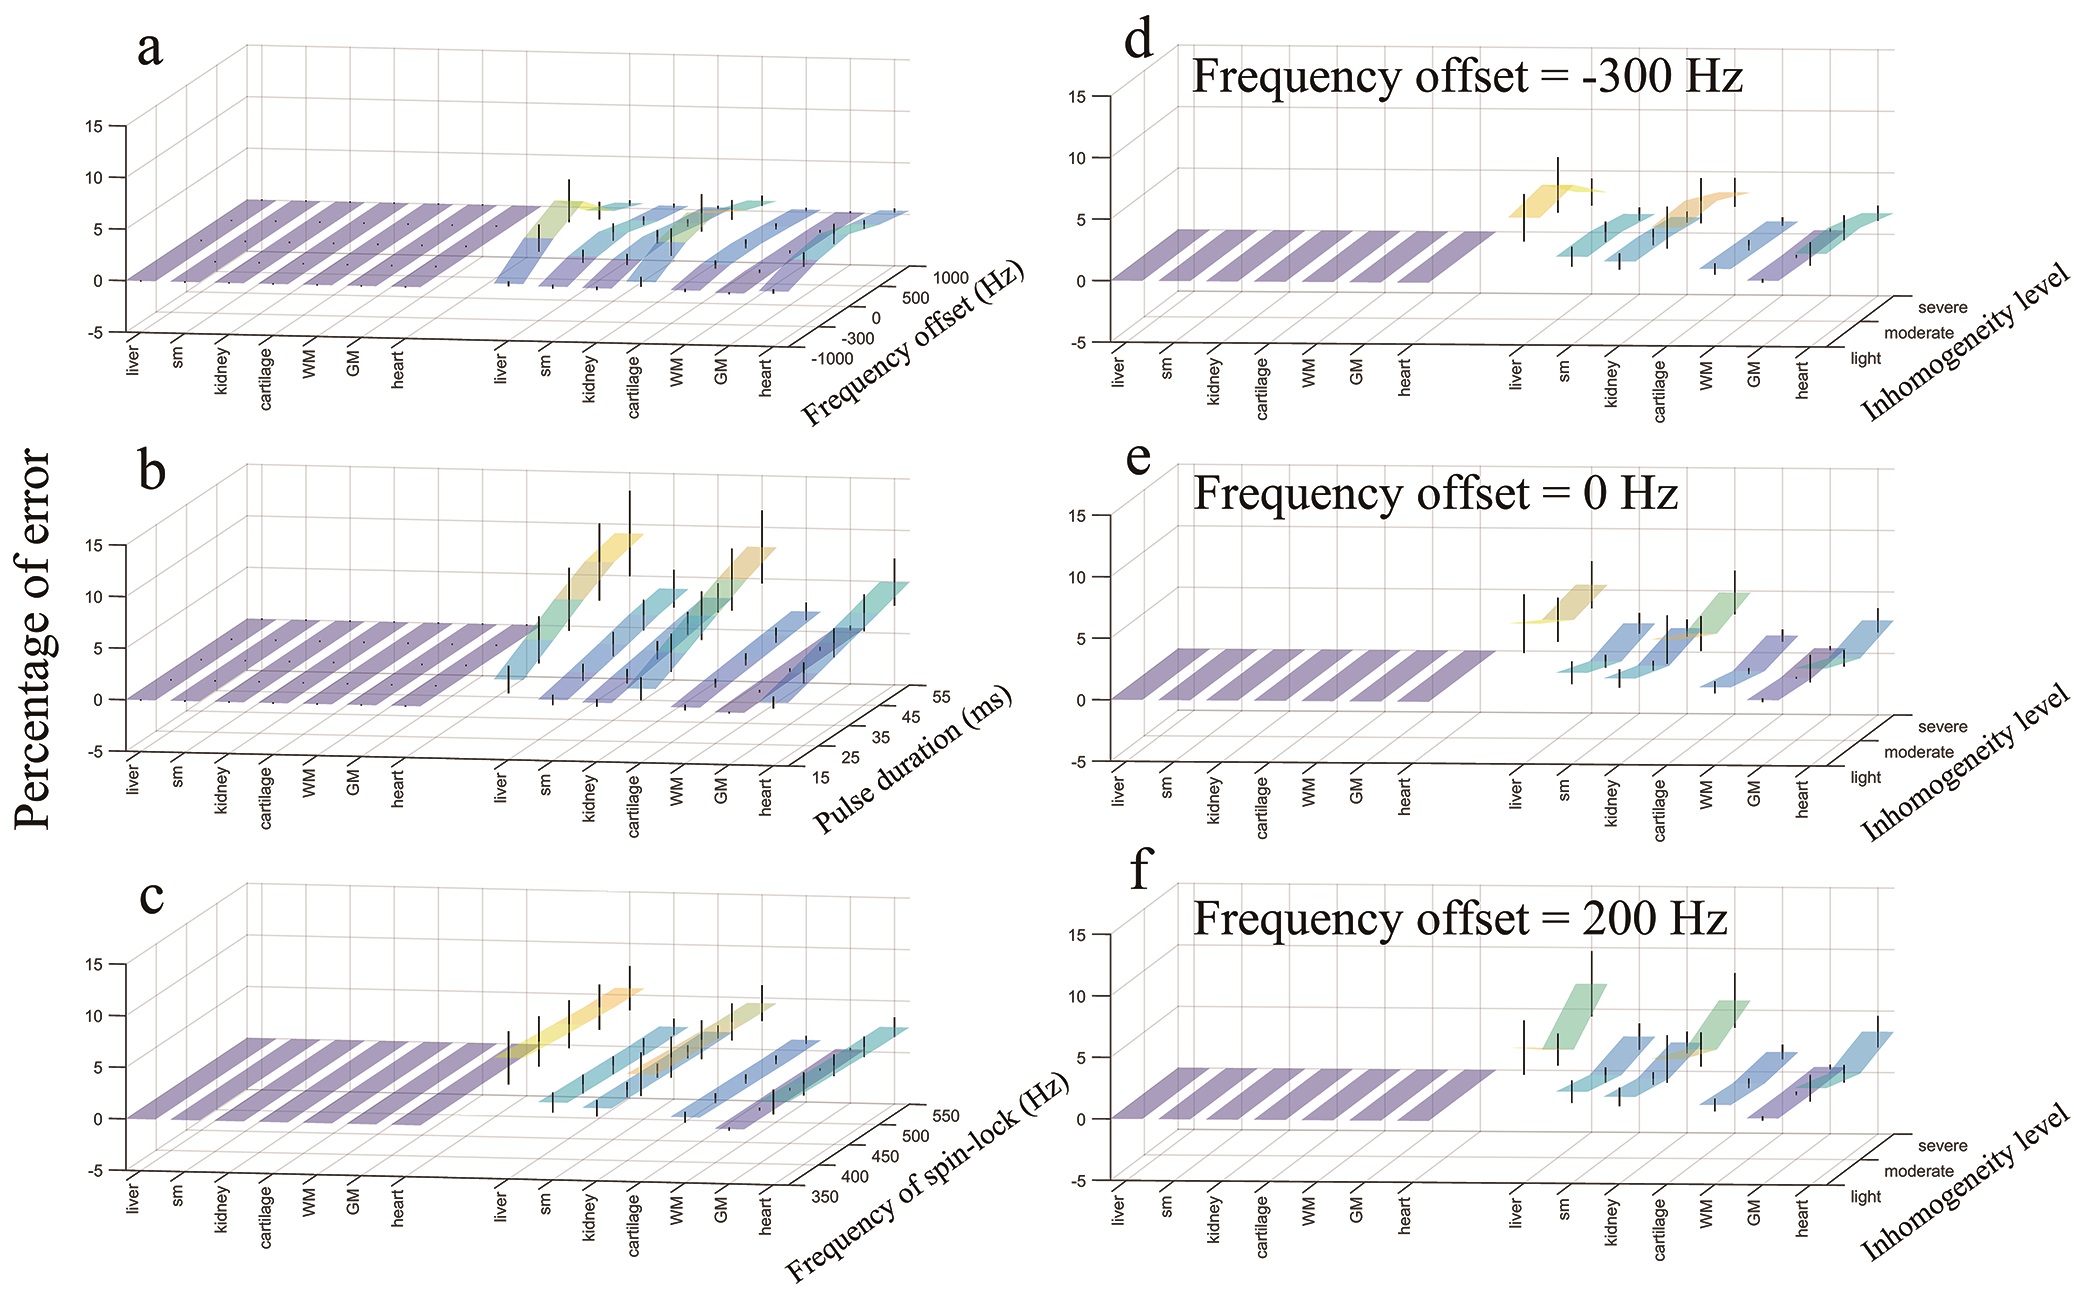
Bloch simulation was performed on a variety of tissues to demonstrate the theory. The magnetization at the end of the constant amplitude spin-lock RF pulse is used as input. The magnetization at the end of the reverse AHP is then calculated and fitted to the conventional mono-exponential model and the proposed mode. The maximum fitting error was then used as a metric to check the accuracy of the relaxation model.
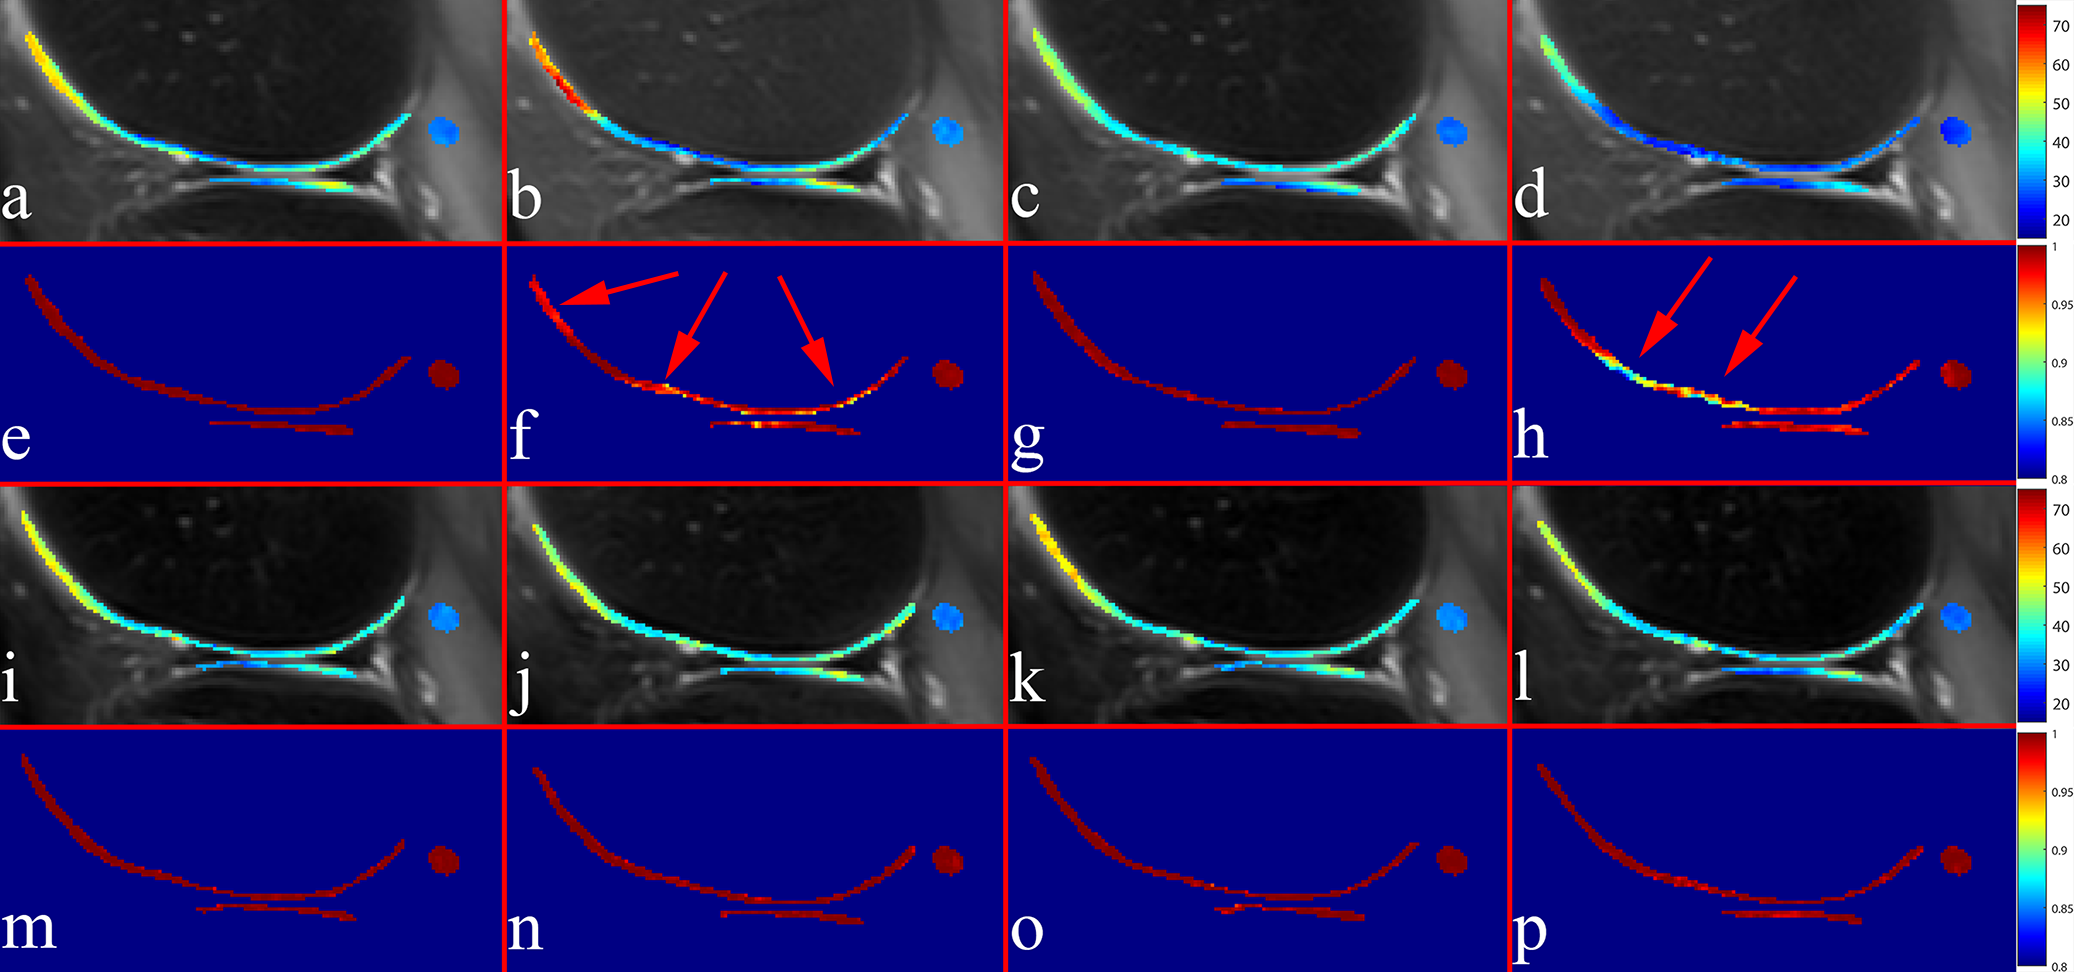
Knee imaging was conducted on healthy volunteers under the approval of the Institutional Review. Data sets were acquired using a Philips Achieva TX 3.0T scanner (Philips Healthcare, Best, the Netherlands) and an eight-channel T/R knee coil (Invivo Corp, Gainesville, USA). Each scan was repeated twice, including without and with an approximately 100 Hz center frequency shift to increase B0 field inhomogeneity. Imaging parameters included FOV 16x15.2 cm, slice thickness 5 mm, echo train length 20, TR/TE 2500/20 ms, and SPAIR for fat suppression. TSL 0, 15, 35, 55, and 80 ms were used, providing five images for fitting. The adjusted R-square was used to compare the reliability of T1rho quantification between the two relaxation models during the in vivo experiments since they have a different number of unknowns.
Results and Discussion
Figures 2 shows the simulation results. Note the proposed relaxation model shows zero error under all scenarios. In contrast, the conventional relaxation model shows a considerable error even at on-resonance spin-lock, indicating that the relaxation effect during the adiabatic pulse can lead to non-negligible effect to the conventional mono-exponential relaxation model. Figure 3 shows T1rho and adjusted R-square maps at on- and off-resonance spin-lock at -100Hz resonance frequency offset. Note the center frequency shift results in obviously reduced adjusted R-square for the conventional method, which does not occur in the proposed method. The new relaxation model results in a high adjusted R-square value, indicating the accuracy of the proposed relaxation model.Conclusion
The adiabatic RF pulses can be used for continuous wave constant amplitude spin-lock to obtain artifact-free images in the presence of B1 RF and B0 field inhomogeneity. However, the relatively long duration of the adiabatic pulses can result in a non-negligible effect on the relaxation model. We demonstrated that the relaxation during the entire adiabatic pulses only introduces a simple DC term to the conventional mono-exponential model.Acknowledgements
This study is supported by the grant from the Innovation and Technology Commission of the government of Hong Kong SAR (Project ITS/469/16) and the grant from the Research Grants Council of the Hong Kong SAR (Project No. SEG CUHK02).References
- Gröhn OH, Mäkelä HI, Lukkarinen JA, et al. On- and off-resonanceT1ρMRI in acute cerebral ischemia of the rat. Magnetic Resonance in Medicine. 2002;49(1):172-176. doi:10.1002/mrm.10356.
- Gröhn HI, Michaeli S, Garwood M, Kauppinen RA, Gröhn OHJ. QuantitativeT1ρ and adiabatic Carr-PurcellT2 magnetic resonance imaging of human occipital lobe at 4 T. Magnetic Resonance in Medicine. 2005;54(1):14-19. doi:10.1002/mrm.20536.
- Chen W. Artifacts correction for T1rho imaging with constant amplitude spin-lock. Journal of Magnetic Resonance. 2017;274:13-23. doi:10.1016/j.jmr.2016.11.002.
- Chen W. Robust On- and Off-Resonance constant amplitude spin-lock at the presence of B1 RF and B0 field inhomogeneity. ISMRM 25th Annual Meeting, Hawaii, 2017, 1394
- Jin T, Wang P, Zong X, Kim S-G. Magnetic resonance imaging of the Amine–Proton EXchange (APEX) dependent contrast. NeuroImage. 2012;59(2):1218-1227. doi:10.1016/j.neuroimage.2011.08.014.
- Zaiss M, Bachert P. Exchange-dependent relaxation in the rotating frame for slow and intermediate exchange - modeling off-resonant spin-lock and chemical exchange saturation transfer. NMR in Biomedicine. 2012;26(5):507-518. doi:10.1002/nbm.2887..
Figures