5601
Comparison of Magnetic Resonance Elastography (MRE) Inversion Reproducibility using MDEV and MREdge in the Brain for the Same Subjects at 1.5, 3 and 7 Tesla1University of Edinburgh, Edinburgh, United Kingdom, 2Centre for Inflammation Research, Queen's Medical Research Institute, University of Edinburgh, Edinburgh, United Kingdom, 3Alzheimer Scotland Dementia Research Centre, University of Edinburgh, Edinburgh, United Kingdom, 4Department of Radiology, Charité – Universitätsmedizin Berlin, Berlin, Germany, 5Institute for Biometrics and Medical Informatics, Otto von Guericke University Magdeburg, Magdeburg, Germany
Synopsis
Magnetic Resonance Elastography (MRE) provides quantitative measures of the mechanical properties of biological tissues. As MRE becomes more widely used, it is important to assess different methods of data acquisition and analysis. In this study, a comparison was made between 3 field strengths using Multi-frequency duel Elasto Visco inversion (MDEV) and the new MREdge pipeline. Both inversions demonstrated significant differences in stiffness at each field strength, MDEV also displayed excellent correlation at 1.5, 3 and 7T. MDEV remains the preferred method of inversion with MREdge offering the prospect of an automatic pipeline which provides stiffness estimates for specific brain regions.
Introduction
Magnetic Resonance Elastography (MRE) has been reported to be a reliable method for measuring the stiffness of the liver with only small variations in values obtained using different MR systems, field strengths and pulse sequences [1]. In the case of the brain MRE measurements at field strengths of 1.5T and 7T have also shown consistent stiffness estimates at multiple frequencies [2]. The effects of field strength have previously been investigated using multifrequency duel elasto visco inversion (MDEV) in conjunction with varied pre-processing schemes [3,4]. The aim of this study is to further investigate MRE reproducibility at different field strengths using MDEV and the new MREdge method.Methods
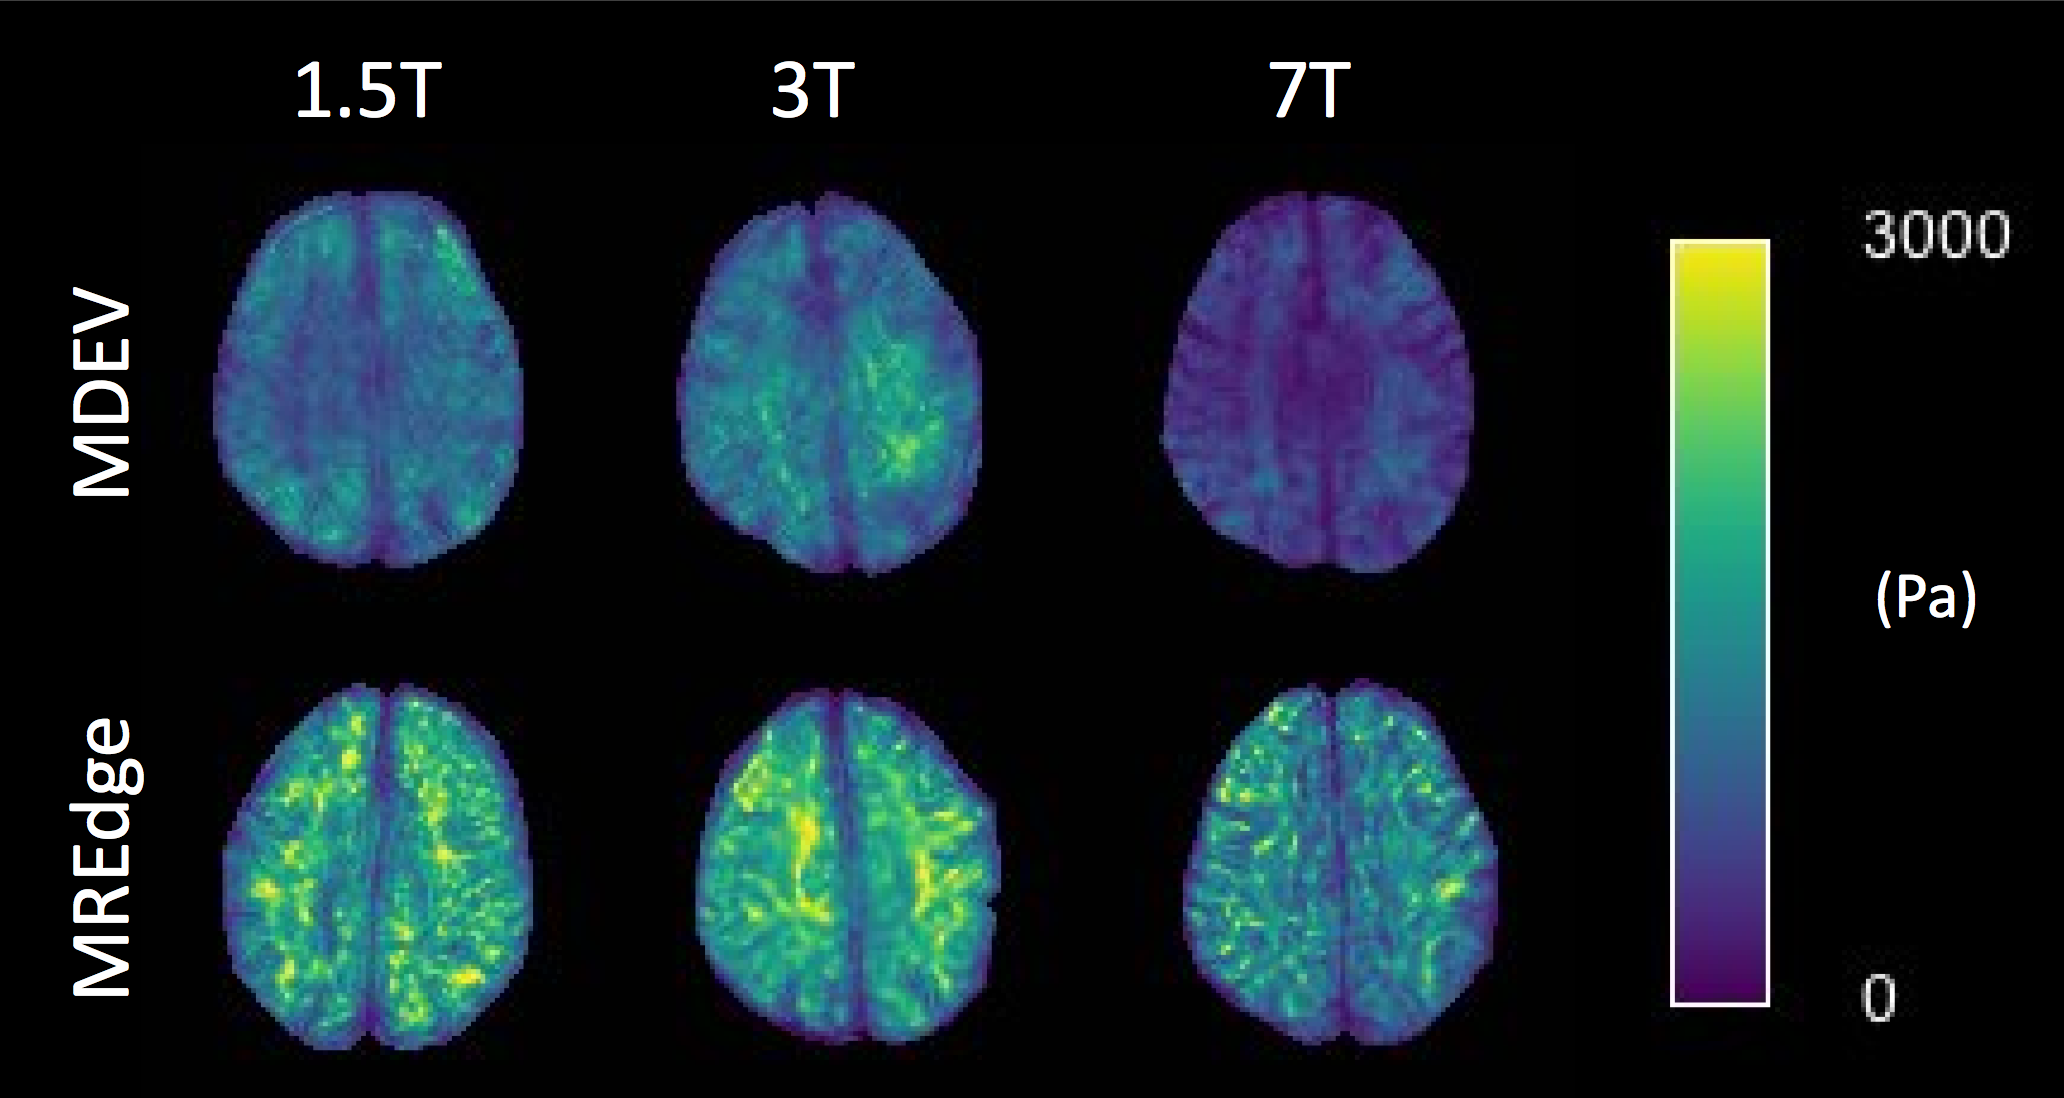
MRE investigations were performed in Eighteen healthy participants (n=18; 36.4[±12.7] years old) on 1.5T, 3T and 7T MRI systems, with three MRE actuation frequencies of 30, 40, and 50Hz. The 1.5 and 3T images were acquired at 2mm isotropic resolution and the 7T images were acquired at 1mm isotropic resolution. Data were processed with two algorithms. The first algorithm is the MDEV approach [3,4], whose implementation is publicly available at https://bioqic-apps.charite.de/. This algorithm incorporates gradient-based phase unwrapping, low-pass filtering and a Helmholtz-type inversion [5]. The second is MREdge, a fully automated brain analysis pipeline designed for larger scale brain studies. For the present study data were phase-unwrapped with a Laplacian-based estimator, de-noised with complex dual-tree wavelets [6] with noise-adaptive thresholding, and, for comparison purposes, inverted using the same MDEV algorithm [4]. Outputs of the pipeline included Elastograms (Figure 1), SNR calculations and global parameter estimates for brain parcels as segmented by the SPM12 atlas [7].Results
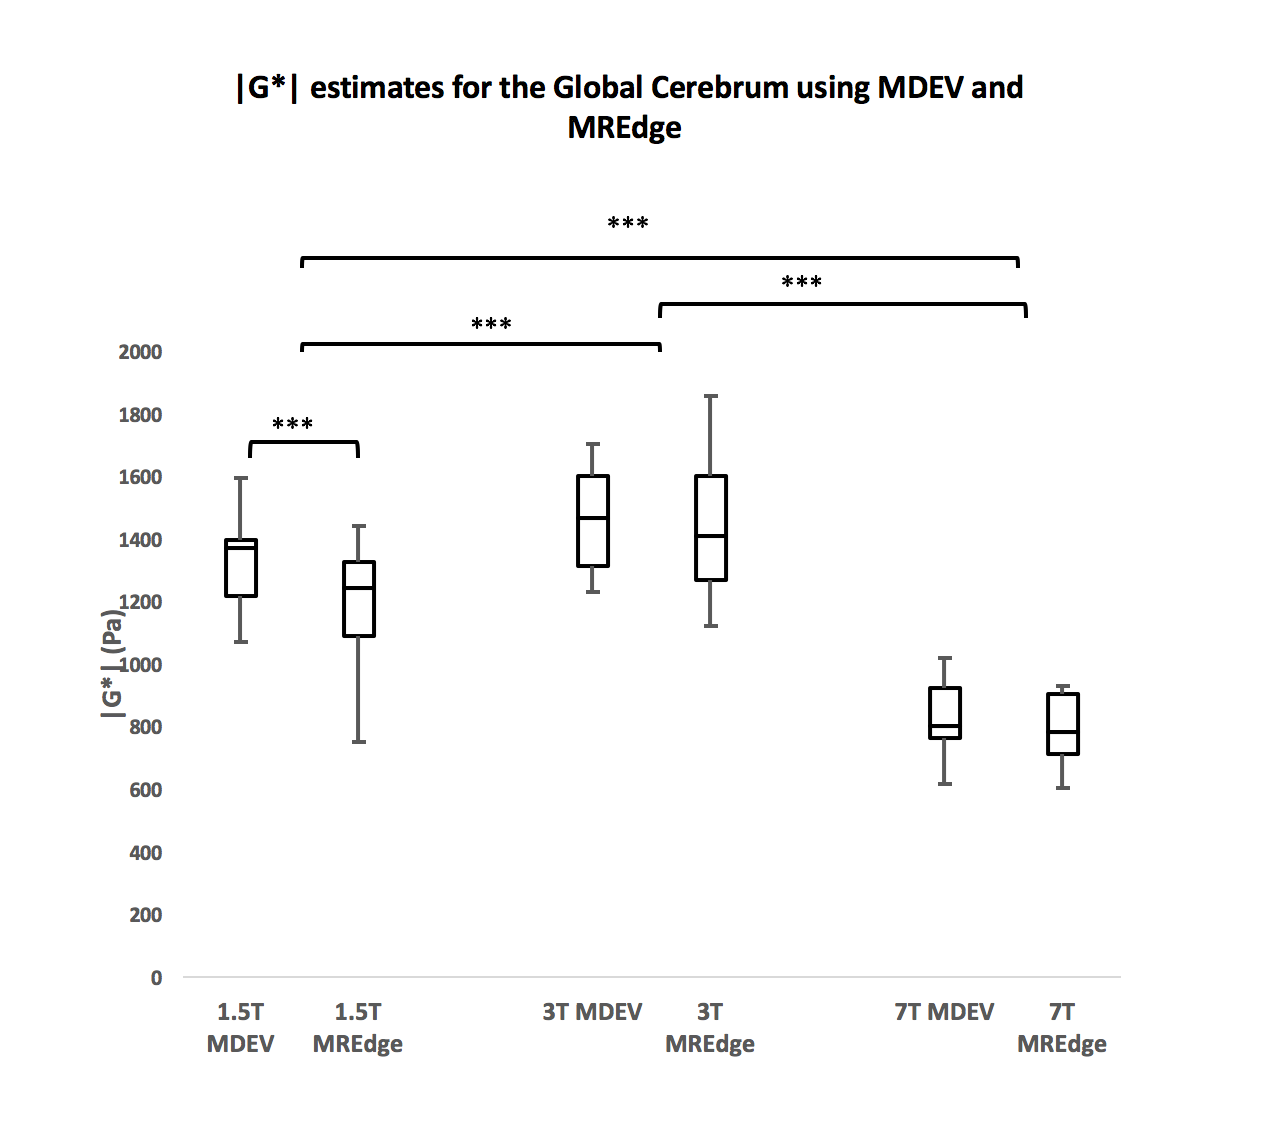
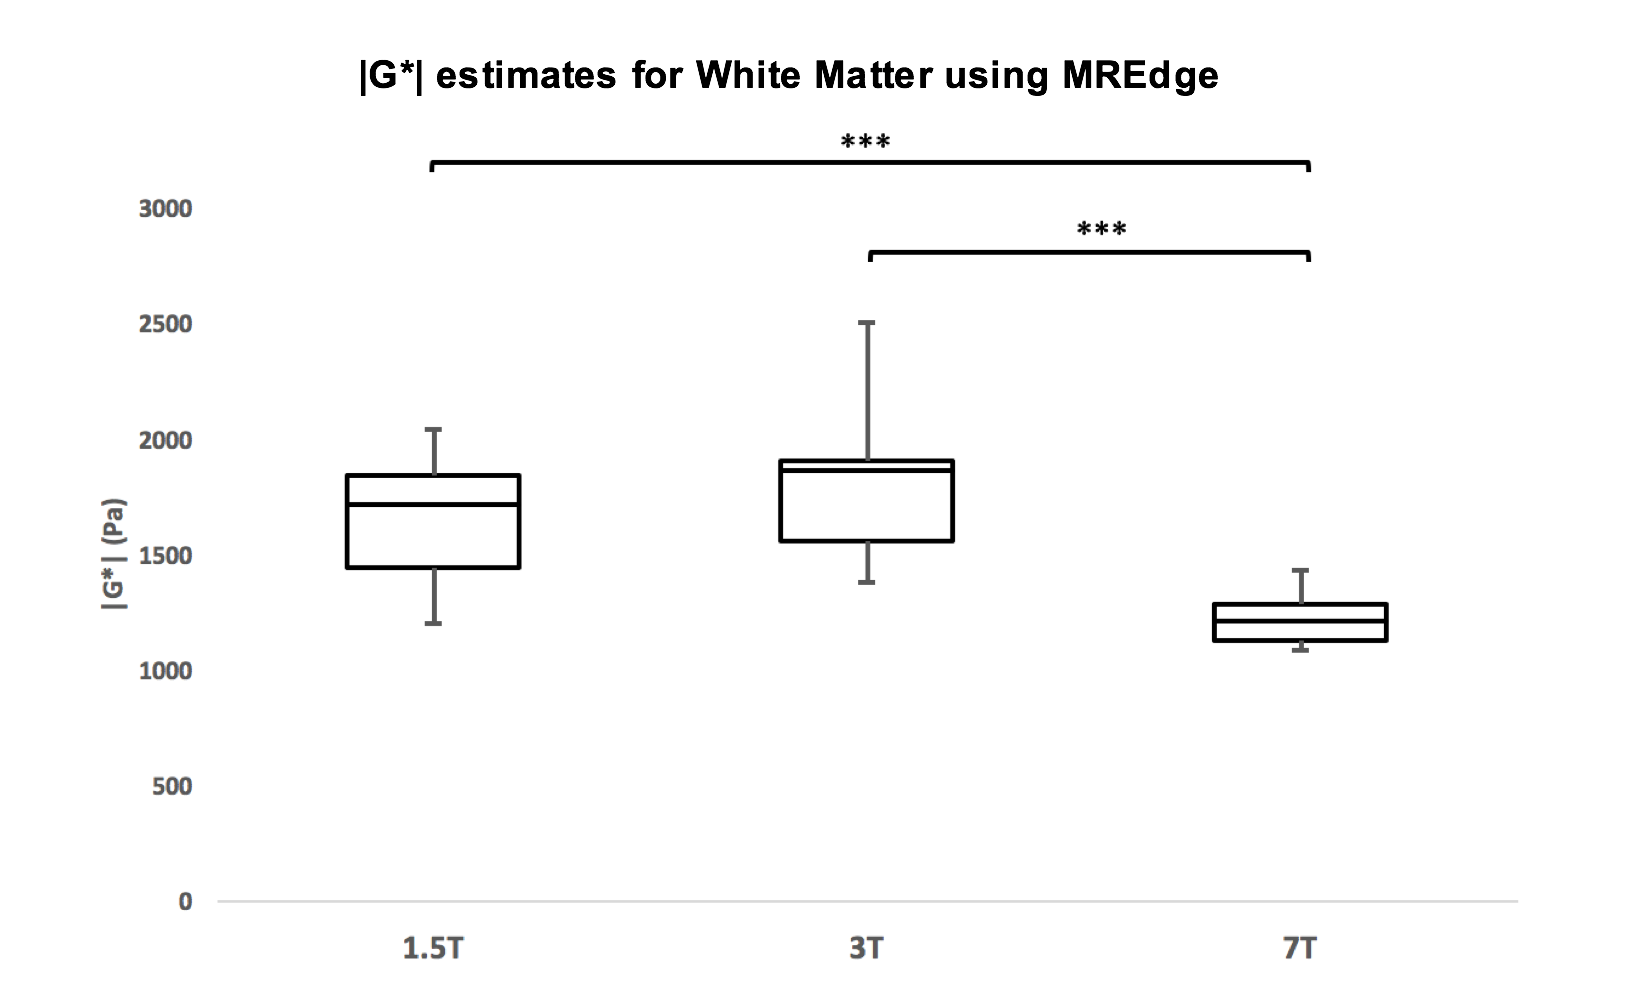
When using the MDEV inversion method, a repeated measures ANOVA revealed a significant difference in |G*| between all field strengths (p<.001), for 1.5T (1.33[±0.14] kPa), 3T (1.45[±0.16] kPa), and 7T (0.82[±0.11] kPa) for the global cerebrum. Interclass correlation (ICC) estimates and their 95% confidence intervals, calculated in SPSS [8] revealed good to excellent correlation between |G*| values: i) 1.5T by 3T (ICC = 0.71; p = .007), ii) 1.5T by 7T (ICC = 0.81; p=.001) and iii) 3T by 7T (ICC = 0.80; p=.001). When using the MREdge automatic processing method, a repeated measures ANOVA also revealed differences for |G*| in all field strengths for the global cerebrum (p<.001), for 1.5T (1.19[±0.19] kPa), 3T (1.44[±0.22] kPa), and 7T (0.79[±0.11] kPa) (Figure 2). ICC estimates revealed no significant reproducibility between |G*| values. MREdge segmented atlases were used to measure white matter stiffness estimates. There were no significant differences in |G*| for white matter at 1.5T and 3T (p=.430) but a significant difference was observed between both 1.5T and 3T, and 7T (p<.001) (figure 3). A significant difference was also observed between postlaplacian SNR values produced by the new pipeline for 1.5T (12.19[±0.95] dB), 3T (10.91[±0.74] dB) and 7T (13.99[±1.24] dB), (F(2,48) = 40.00, p<.001).Discussion
In the case of MDEV brain stiffness |G*| was found to be strongly correlated across different field strengths and frequencies, however mean stiffness values between field strengths were significantly different. This differs from previous work using ESP processing where average stiffness estimates were not significantly different [9]. MREdge showed similar results with significant differences between field strengths for automatically segmented brain structures. The Laplacian SNR was significantly different between acquisition methods but the effect size was small. These values are post application of a noise-adaptive wavelet-based de-noising routine and don't necessarily correlate with the SNR of the raw data. As a result, the difference seen at 7T both globally and for white matter is likely to be due to structural details. In particular, finer structures revealed by 7T MRE demonstrating lower |G*| estimates than large scale structures to which lower resolution MRE is more sensitive.Conclusion
MDEV remains the best method for regional analysis of structures like deep grey matter and for parameter changes due to experimental paradigms as evidenced by the excellent correlation demonstrated. The latest MREdge automatic processing pipeline has developed this inversion method further by providing |G*| values automatically for individual brain structures, leading towards a possible MRE library of standard values for the brain. This will help to further establish the convenient clinical application of MRE. However, in view of the ability to capture different levels of structural detail field strength variations between scanners must be acknowledged when considering absolute values.Acknowledgements
No acknowledgement found.References
1. Trout, A., Serai, S., Mahley, A., Wang, H., Zhang, Y., Zhang, B., Dillman, J., Liver Stiffness Measurements with MR Elastography: Agreement and Repeatability across Imaging Systems, Field Strengths, and Pulse Sequences. Radiology. 2016; 281(3):793-804 2.
2. Hamhaber, U., Dieter, K., Papazoglou, S., Hollmann, M., Stadler, J., Sack, I., Bernarding, J., Braun, J. In vivo magnetic resonance Elastography of human brain at 7T and 1.5T. Journal of Magnetic Resonance Imaging. 2010; 32(3):277-583
3. Papazoglou, S., Hirsch, S., Braun, J., Sack, I. Multifrequency inversion in magnetic resonance Elastography. Physics in Medicine and Biology. 2012; 57:2329
4. Braun, J., Guo, J., Lützkendorf, R., Stadler, J., Papazoglou, S., Hirsch, S., Sack, I., Bernarding, J. High-resolution mechanical imaging of the human brain by three-dimensional mulifrequency magnetic resonance Elastography at 7T. NeuroImage. 2014; 90:308-314 5.
5. Selesnick, I.W., Baraniuk, R.G., Kingsbury, N.C. The dual-tree complex wavelet transform. IEEE Signal Processing Magazine. 2005; 22 (6), 123–151.
6. Barnhill, E., Hollis, L., Sack, I., Braun, J., Hoskins, P., Pankaj, P., Brown, C., van Beek, E. and Roberts, N. Nonlinear multiscale regularisation in MR elastography: Towards fine feature mapping. Medical Image Analysis. 2016; 35, pp.133-145.
7. Ashburner, J.,and Friston, K. Unified segmentation. NeuroImage. 2005; 26:839–851
8. SPSS Inc, Chicago IL, 2016
9. Barnhill, E., Guo, J., Dittmann, F., Hirsch, S., Perrins, M., Hiscox, L., Herrmann, T., Bernarding, J., Roberts, N., Braun, J., Sack, I. Impact of Field Strength and Image Resolution on MRE Stiffness Estimation, Proc. ISMRM; Singapore. 2016
Figures