5598
3D Magnetic Resonance Elastography of the Lungs in A Breathhold: A Reproducibility Study.1Department of Biomedical Engineering, The Ohio State University, Columbus, OH, United States, 2Department of Radialogy, The Ohio State University - Wexner Medical Center, Columbus, OH, United States, 3Department of Internal Medicine-Division of Cardiology, The Ohio State University - Wexner Medical Center, Columbus, OH, United States
Synopsis
Lung stiffness changes with different diseases; in which some diseases make the lung stiffer while others make it softer. This study was performed on 15 healthy volunteers to validate the reproducibility of proposed technique and to determine a base line shear stiffness of healthy lungs at both residual volume (RV) and total lung capacity (TLC) by using magnetic resonance elasotgraphy (MRE). It was found that the actual shear stiffness of the lung at RV is 0.66±0.11 kPa and at TLC is 1.05±0.31 kPa. Also, the technique was successfully reproducible with high correlation coefficients (R2=0.879 at RV and R2=0.961 at TLC).
Introduction
Lung stiffness changes with different diseases; increase or decrease in lungs stiffness beyond the normal range will negatively affect the lungs. Current techniques such as spirometry and CT provide insufficient information regarding the anatomical extent of the disease or quantitative measure of the lung stiffness. On the other hand, other MRI methods involve the use of noble gases or pure oxygen as a contrast agent to obtain signal in the lungs1-3. In this current study, magnetic resonance elastography (MRE) was used to non-invasively obtain 3D stiffness of the lungs at residual volume (RV) and at total lung capacity (TLC) without inhalation of any noble gas within a breathhold. Additionally, a reproducibility study was also performed to determine the robustness of the MRE technique.Methods
15 healthy volunteers (10 males and 5 females) were scanned twice using an approved IRB. Both scans used the same sequence, protocol, and setup. After the first scan, the volunteers were asked to leave the scanner room and were repositioned for the second repeat scan. Both scans were performed by using a SE-EPI MRE sequence on a 1.5T MR scanner (Avanto, Siemens Healthcare, Erlangen, Germany) to obtain 5 axial slices of the right lung. A passive pneumatic driver was placed near the apex of the right lung. Only right lung was considered for imaging because of the heart motion on the left side. In this scan, a single breathhold of 26 seconds was involved for each MRE acquisition at RV and TLC with an EPI factor of 9. The scan parameters included FOV of 40 cm, slice thickness of 10 mm, acquisition matrix of 128x64, TE of 11.6 ms and TR of 400 ms. The MEG frequency was 250 Hz, and an external motion of 50 Hz was applied.
Lung density scans were performed by using a GRE sequence with short TR of 10 ms and four different TEs of 1.07, 1.5, 2, and 2.5 ms to calculate T2* decay, from which the initial signal of the lung was estimated. After obtaining the initial signal of the lung, the lung density was calculated in reference to a Gadolinium-doped water phantom that was placed on the volunteer’s chest while scanning4-6. This scan involved a single breathhold of 16 seconds for each, RV and TLC. A whole body coil was used with the following parameters: FOV of 50 cm, slice thickness of 10 mm, acquisition matrix of 64x64, and 4 averages.
Lung shear stiffness with considering the lung density at both RV and TLC were calculated by using principal frequency analysis (PFA)7 method implemented on MATLAB (Math Works, Natick, MA) by applying 4th order Butterworth bandpass directional filter with cutoff values of 8-40 pixels/wavelength at RV and 4-40 pixels/wavelength at TLC to remove the longitudinal and reflected waves. Filter cutoff values were selected based on number of pixels manually measured in a full wavelength. Shear stiffness of the lungs was estimated by using µ=ρf2λ2 equation, where ρ is the density of lungs, f is the excitation frequency i.e. 50Hz and λ is the wavelength estimated from PFA analysis.
Results
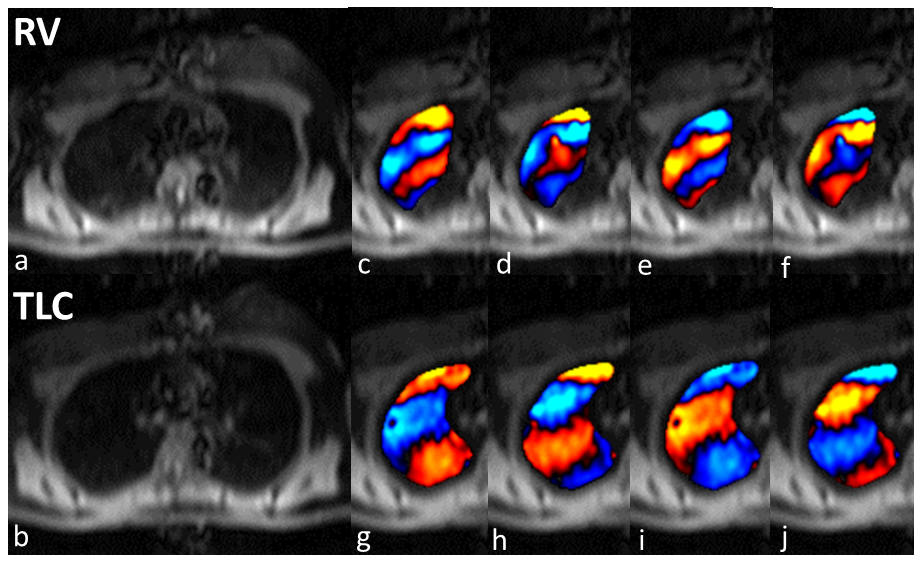
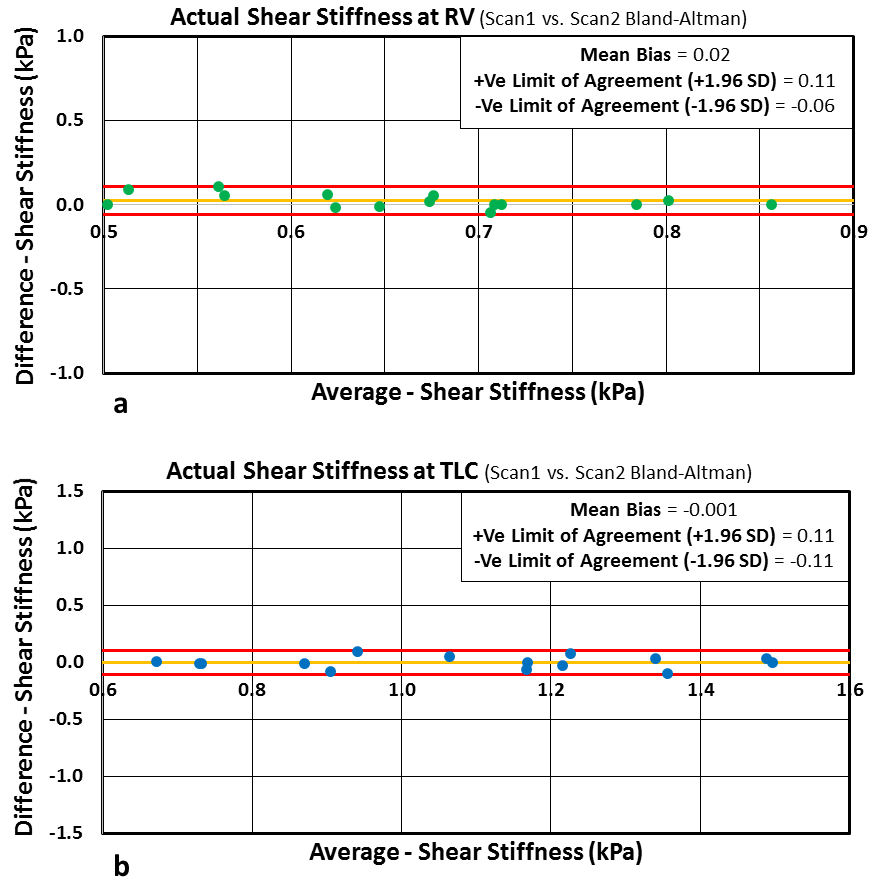
Figure 1 shows magnitude and 4 snapshots of wave images demonstrating excellent wave propagation at RV and TLC. It can also be observed that RV has shorter wavelength (red to blue region) than TLC due to difference in stiffness during respiratory cycle. Figure 2 shows box plot of stiffness at RV and TLC. The mean shear stiffness for all 5 slices by pooling all volunteers at RV and TLC are 0.66±0.11 kPa and 1.05±0.31 kPa, respectively with a significant p-value<0.0001. The lung density estimated in this study had a mean value of 0.2±0.042 g/cm3 at RV and 0.077±0.024 g/cm3 at TLC. Figure 3 shows correlation plots between scan1 and scan2 with good R2 values of 0.88 and 0.96 at RV and TLC, respectively. Additionally, Figure 4 shows Bland-Altman plots for scan1 and scan2 stiffness measurements with about zero mean bias and tight 95% CI at RV (mean bias: 0.02kPa and 95% CI: -0.087 to 0.134kPa) and TLC (mean bias: -0.001kPa and 95% CI: -0.144 to 0.142kPa).Discussion and Conclusion
This study demonstrated 3D MRE of the lungs in a breathhold without any noble gas inhalation. MRE-derived stiffness was reproducible both at RV and TLC. Additionally, MRE-derived stiffness was significantly higher at TLC compared to RV. Future work involves application of this technique in different disease states. In addition, a navigator based sequence will be developed to obtain images under free breathing at different points of respiratory cycle.Acknowledgements
No acknowledgement found.References
1. He M, Robertson SH, Kaushik SS, et al. Dose and pulse sequence considerations for hyperpolarized 129 Xe ventilation MRI. J Magn Reson Imaging. 2015;33(7):877-885.
2. Callot V, Canet E, Brochot J, et al. MR perfusion imaging using encapsulated laser‐polarized 3He. Magn. Reson. Med. 2001; 46(3):535-540.
3. Mai VM, Bankier AA, Prasad PV, et al. MR ventilation‐perfusion imaging of human lung using oxygen‐enhanced and arterial spin labeling techniques. J Magn Reson Imaging. 2001;14(5):574-579.
4. Mariappan YK, Glaser KJ, Levin DL, et al. Estimation of the absolute shear stiffness of human lung parenchyma using 1H spin echo, echo planar MR elastography. J Magn Reson Imaging. 2014;40(5):1230-7.
5. Theilmann RJ, Arai TJ, Samiee A, et al. Quantitative MRI measurement of lung density must account for the change in T2* with lung inflation. J Magn Reson Imaging. 2009;30(3):527-534.
6. Holverda S, Theilmann RJ, Sá RC, et al. Measuring lung water: Ex vivo validation of multi‐image gradient echo MRI. J Magn Reson Imaging. 2011;34(1):220-224.
7. McGee KP, Lake D, Mariappan Y, et al. Calculation of shear stiffness in noise dominated magnetic resonance elastography data based on principal frequency estimation. Phys. Med. Biol. 2011;56(14):4291.
Figures