5596
Physiomechanical noise in brain magnetic resonance elastography1Department of Biomedical Engineering, University of Delaware, Newark, DE, United States
Synopsis
Magnetic resonance elastography (MRE) is an emerging MRI technology that enables in-vivo quantitative assessment of tissue stiffness, which changes with age and in disease states. The accuracy and precision of brain MRE property maps are generally noise-limited; however, most noise assessments don’t appropriately consider contributions from physiological and mechanical noise sources, such as cardiac pulsation, table shaking, and imperfect actuation. In this work, we designed and carried out experiments to isolate these sources of noise. We found increasing noise from physiological vibration sources with varying behavior through space and time.
Introduction
Magnetic resonance elastography (MRE) is an emerging MRI technology that enables in-vivo quantitative assessment of brain tissue stiffness, which changes with age and in disease states1. Current developments in MRE technology include the pursuit of high-resolution, precise, and accurate mechanical property maps, the performance of which are often noise-limited. In MRE, noise is often assumed to be Gaussian in space and time2,3, and signal-to-noise ratio (SNR) can be improved by increasing data sampling. However, this assumption ignores the potential for displacement noise arising from physiological and mechanical sources such as cardiac pulsation4, table shaking5, and imperfect actuation6, and may not be overcome using traditional signal processing methods resulting in some persistent uncertainty or inaccuracy. The purpose of this work is to investigate these potential physiomechanical noise sources in brain MRE experiments.
Methods
Imaging: MRE scans on two subjects were completed using a Siemens 3T Prisma scanner and 20-channel head RF-receive coil. MRE data were collected using a single-shot EPI sequence with the following imaging parameters: FOV = 240x240 mm2; matrix = 80x80; 48 slices; TR/TE = 6720/65 ms; GRAPPA R = 3; final resolution = 3 x 3 x 3 mm3. Flow-compensated motion encoding gradients were applied bilateral to the RF refocusing pulse, with period matched to vibration, and with G = 30 mT/m (4.89 rad/mm). A pneumatic driver system (Resoundant, Inc.; Rochester, MN) delivered vibrations to the head at 50 Hz. We performed three experiments on each subject: (1) with no motion-encoding gradients and no vibration, to estimate image noise; (2) with gradients but no vibration, to estimate physiological motion noise; and (3) with gradients and applied vibration, to estimate additional noise from actuation. In each experiment, we acquired one phase offset in three encoding directions (x, y, z) with 25 repetitions.
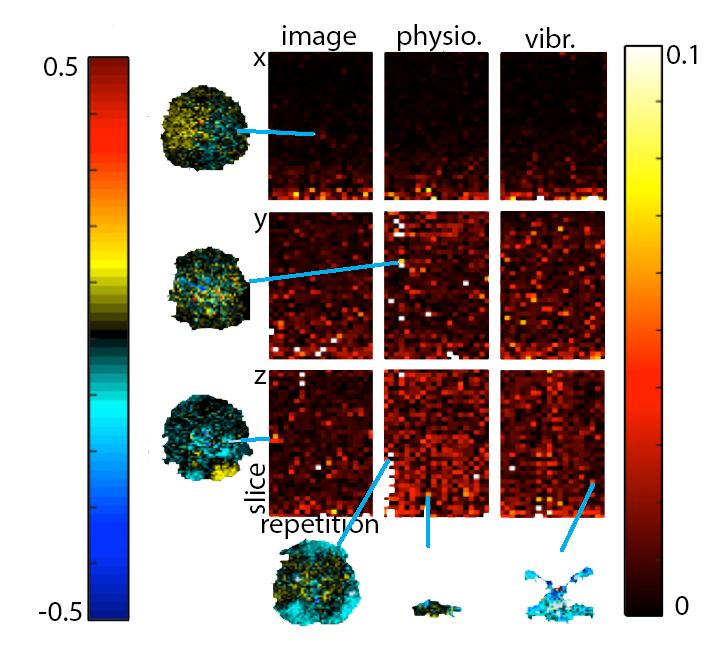
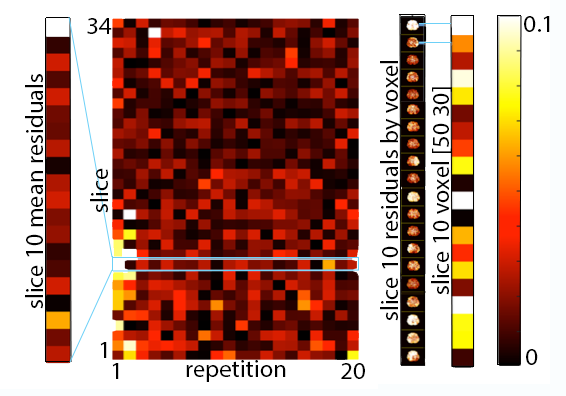
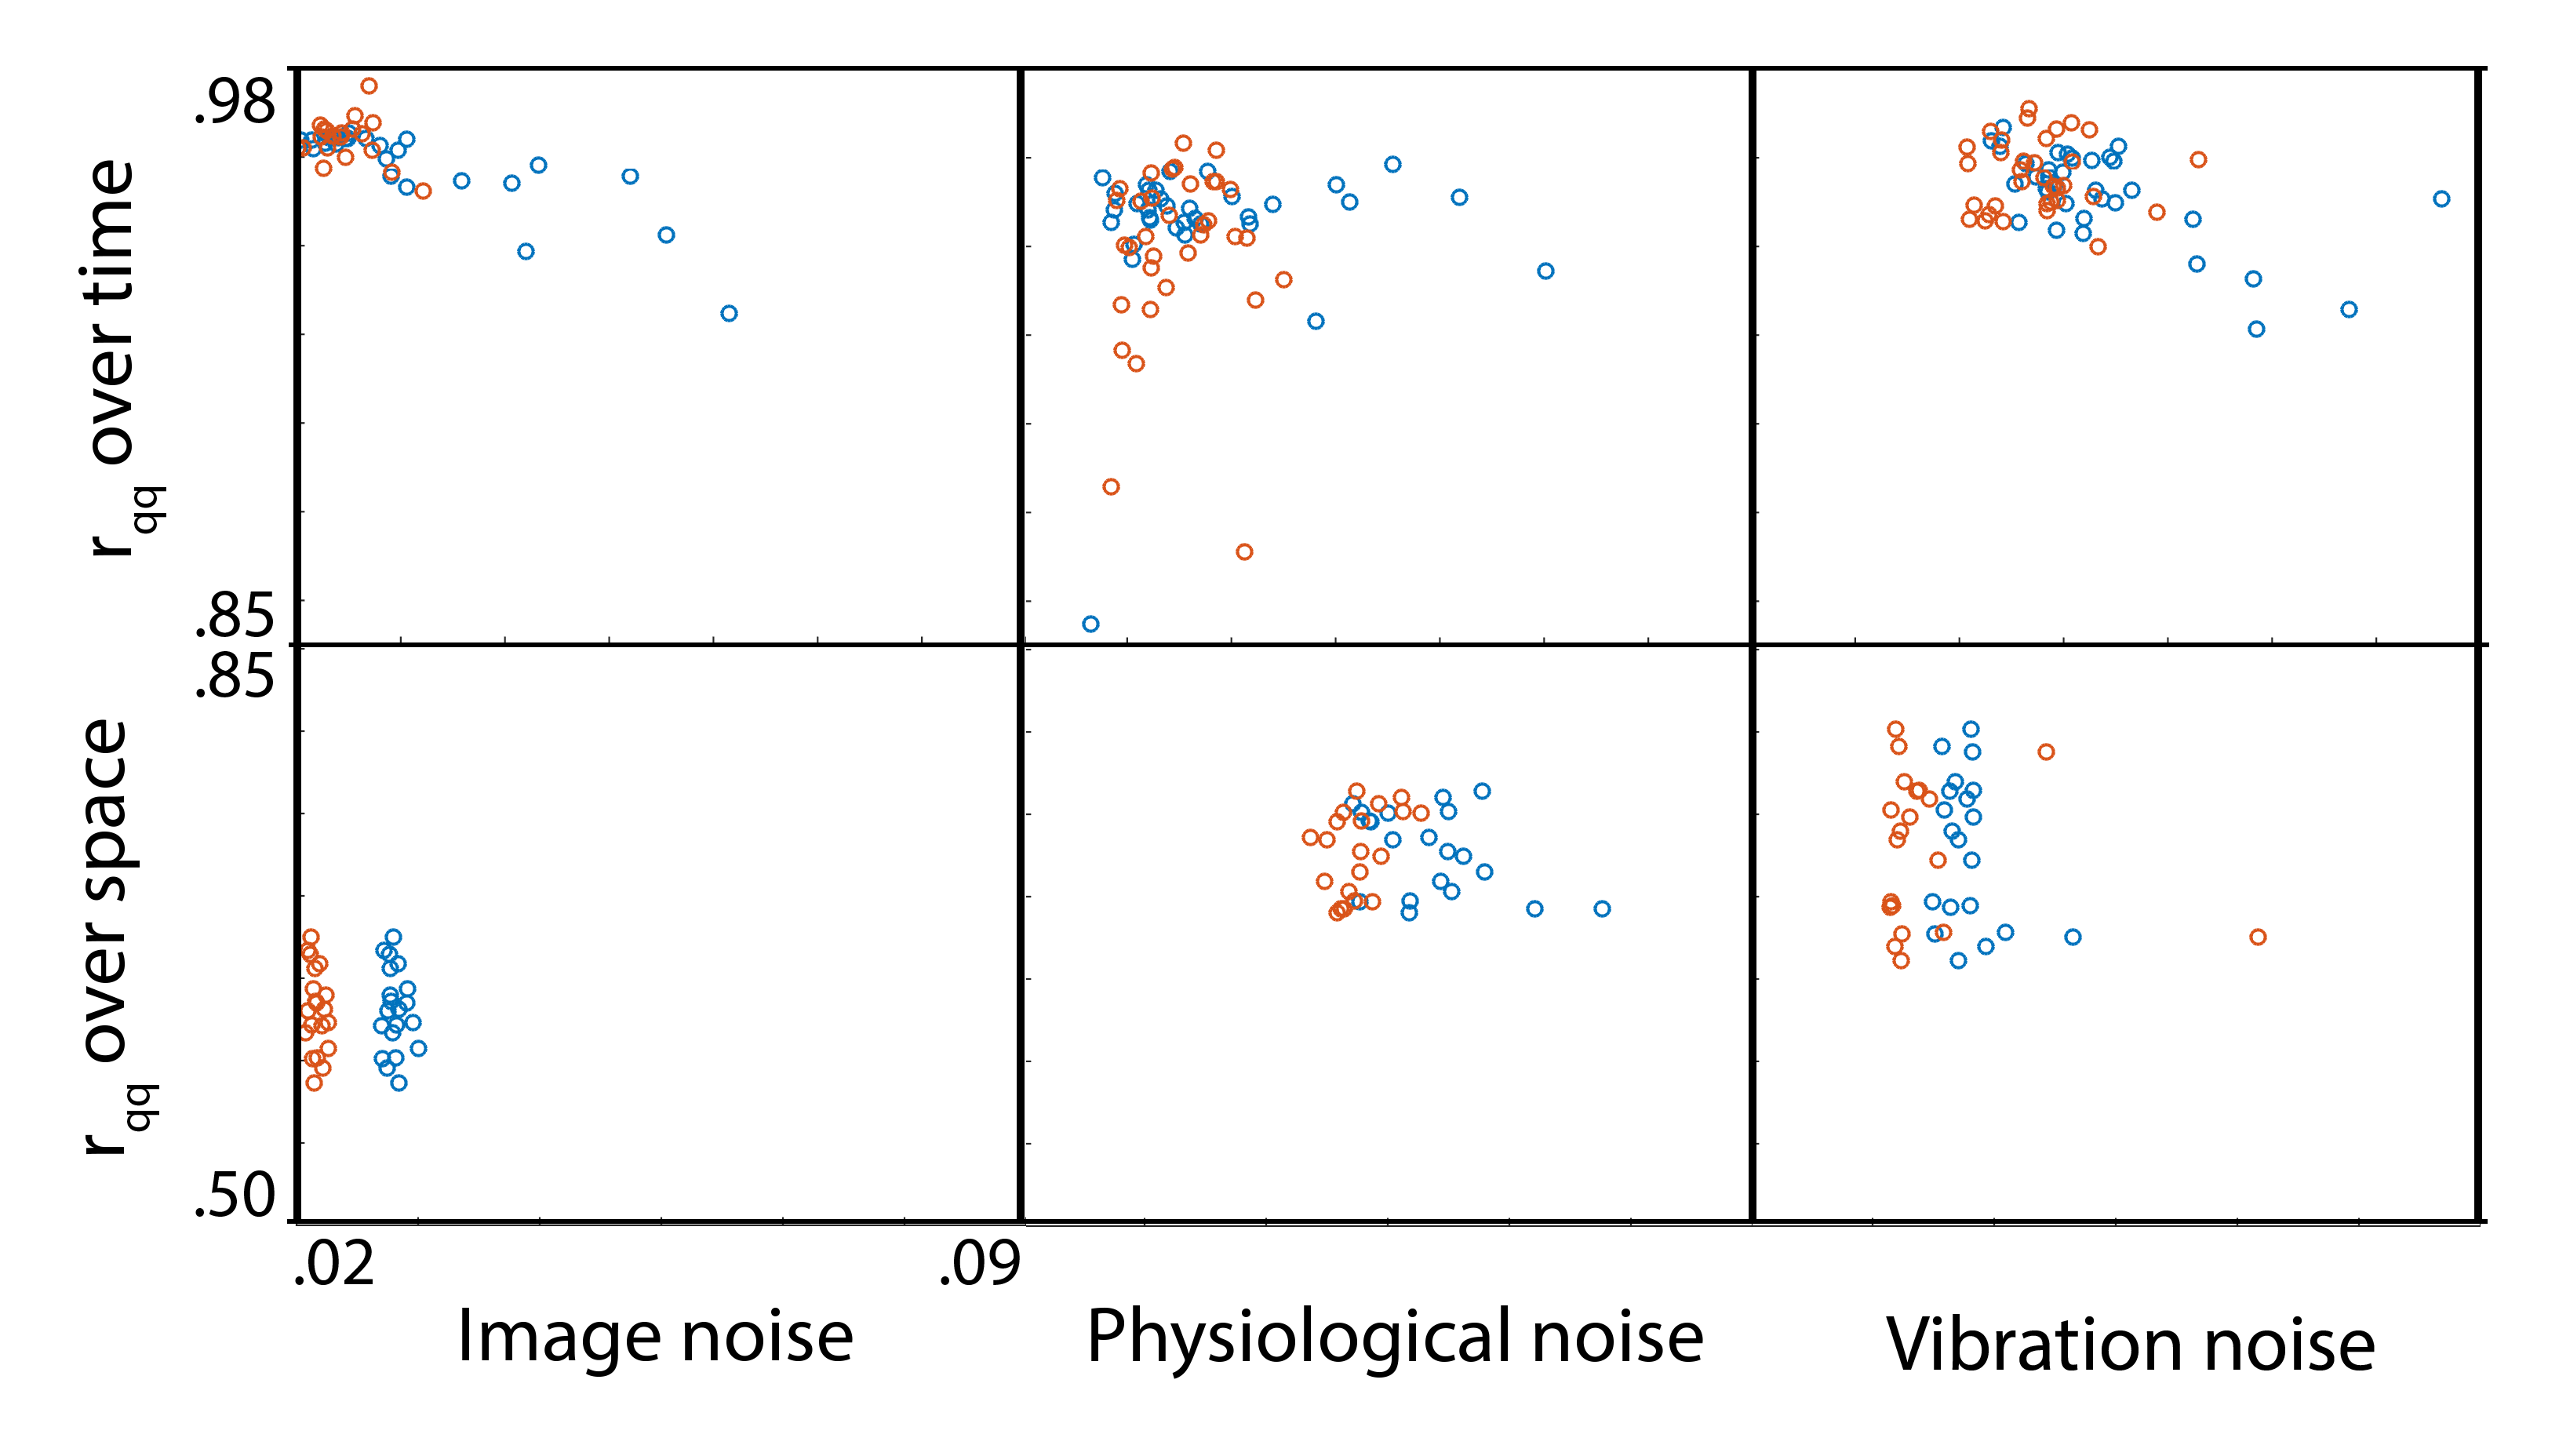
Analysis: Phase noise was calculated by subtracting the mean phase across repetitions from each individual repetition (after phase unwrapping)7. Only the central 34 slices were included in analysis to remove outlier effects from the top of the brain and the spinal cord. The mean of the absolute value of phase noise over time and over space was calculated to determine how noise changes with time and over space, and quantile-quantile plots were calculated to determine how closely each source of noise fits to a Gaussian distribution in both time and space, as quantified by correlation coefficients (rqq)8.
Results & Discusson
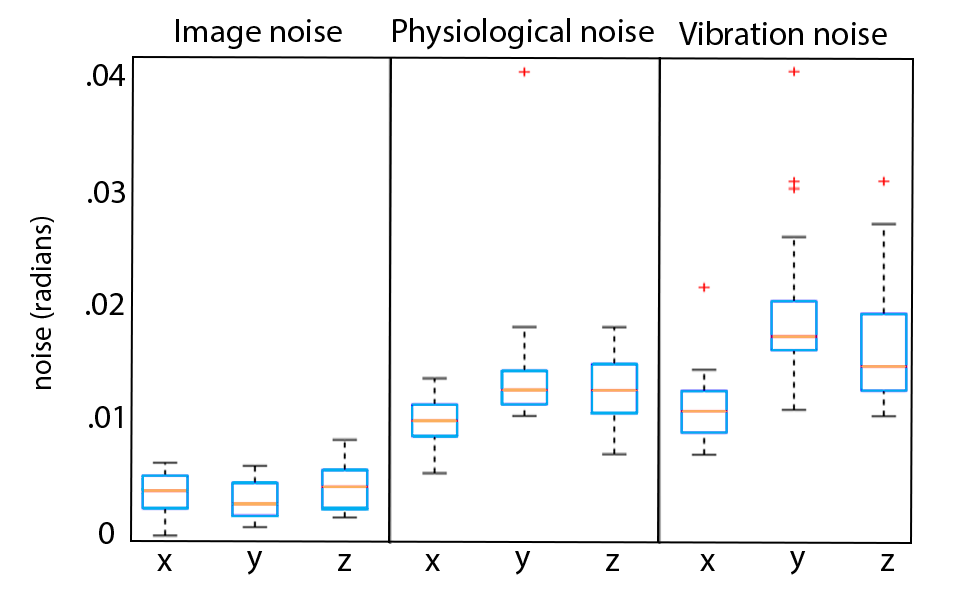
We have found that there is measurable physiological noise and vibration noise present in MRE data beyond imaging noise, and that these sources of noise have varying behavior over space and time. Figures 1 and 2 illustrate that noise varies in magnitude across slices and repetitions, as well as depending on the direction of the gradient (x, y, or z), and that there is an increase in noise due to physiological sources and vibration corresponding to the addition of motion encoding gradients (experiment 2) and applied vibration (experiment 3). The motion-encoding gradient encodes physiological motion, and vibration noise is added from variability in the applied vibration and induced physiological responses, both of which are direction-dependent. Figure 3 quantifies the noise from the different experiments. The rqq value has been used as a measure in fMRI noise analysis to determine if noise is Gaussian distributed or if it exhibits some spatiotemporal coherence, indicated by a low rqq8. Here, we examined the noise distribution in space and time separately, and Figure 4 illustrates that spatiotemporal noise distribution differs between sources. Most interestingly, greater noise from physiological and vibration sources appears more Gaussian distributed in space, though less in time.Conclusion
In this work, we examined physiological and vibration contributions to noise present in brain MRE scans, and that they have varying behavior in space and in time, challenging the common assumptions of noise distribution implicit in MRE techniques. The inherent presence of these noise sources in MRE data directly impacts the development of MRE imaging and inversion methods, particularly those aimed at achieving high spatial resolution. By assessing physiomechanical noise in MRE, we may be able to: 1) develop more appropriate SNR metrics that capture MRE-specific noise characteristics; 2) determine physiomechanical noise limits, such as has been established in fMRI; and 3) design appropriate navigators for multishot MRE sequences with motion-induced phase error correction6,9.Acknowledgements
This work is supported by 1) the Delaware INBRE program with a grant from the National Institutes of General Medical Sciences (P20-GM103446) from the National Institutes of Health and the State of Delaware; and 2) the University of Delaware Research Foundation.References
1. Sack, I., Jöhrens, K., Würfel, J. & Braun, J. Structure-sensitive elastography: on the viscoelastic powerlaw behavior of in vivo human tissue in health and disease Emerging Area Soft Matter Background: springpot and viscoelastic scaling. Soft Matter 9, 5672–5680 (2013).
2. McGarry, M. D. J. et al. An octahedral shear strain-based measure of SNR for 3D MR elastography. Phys. Med. Biol. 56, N153–N164 (2011).
3. Sinkus, R. et al. Imaging anisotropic and viscous properties of breast tissue by magnetic resonance-elastography. Magn. Reson. Med. 53, 372–387 (2005).
4. O’Halloran, R. L., Holdsworth, S., Aksoy, M. & Bammer, R. Model for the correction of motion-induced phase errors in multishot diffusion-weighted-MRI of the head: Are cardiac-motion-induced phase errors reproducible from beat-to-beat? Magn. Reson. Med. 68, 430–440 (2012).
5. Gallichan, D., Robson, M. D., Bartsch, A. & Miller, K. L. TREMR: Table-resonance elastography with MR. Magn. Reson. Med. 62, 815–821 (2009).
6. Johnson, C. L. et al. Magnetic resonance elastography of the brain using multishot spiral readouts with self-navigated motion correction. Magn. Reson. Med. 70, 404–412 (2013).
7. Jenkinson, M. Fast, automated, N-dimensional phase-unwrapping algorithm. Magn. Reson. Med. 49, 193–197 (2003).
8. Stöcker, T. et al. Automated quality assurance routines for fMRI data applied to a multicenter study. Hum. Brain Mapp. 25, 237–246 (2005).
9. Johnson, C. L. et al. 3D multislab, multishot acquisition for fast, whole-brain MR elastography with high signal-to-noise efficiency. Magn. Reson. Med. 71, 477–485 (2014).
Figures