5591
Magnetic resonance elastography accuracy and precision in rat lung and liver at 1.5 T1Imagerie par Résonance Magnétique Médicale et Multi-Modalités, IR4M, CNRS, University Paris Sud 11, Orsay, France, 2Imagerie Moléculaire In Vivo, IMIV, Inserm, CEA, CNRS, University Paris-Sud 11, Orsay, France
Synopsis
Magnetic Resonance Elastography (MRE) is a non-invasive MRI based technique for quantitatively assessing the mechanical properties of tissues. It was formerly demonstrated in a simulation study that 6 to 9 voxels per wavelength is needed to properly quantify the mechanical properties of the tissue. This study investigates the precision and the accuracy of shear wave velocity in two organs at different mechanical excitation frequency and spatial resolution to validate in vivo the optimal conditions of ERM outcomes.
Introduction
Magnetic resonance elastography (MRE) allows to quantitatively measure propagating shear waves in tissue subjected to harmonic mechanical excitation1,2. MRE measurements depend on various factors, which include SNR, spatial resolution (a), mechanical excitation frequency (fexc), induced shear wave amplitude, and method of reconstruction3. Recently, we have shown that 6 to 9 voxels per wavelength (λ) are needed to optimize the quality of reconstruction for a SNR between 5 and 304. Here, we examine the accuracy and precision of the shear wave velocity (v) in the lung and liver of rats by varying fexc and a to validate in vivo the optimal conditions for MRE acquisition and reconstruction. The quality of MRE outcomes can be stated by the evaluation of the curl of the shear displacement field: q/Δq, which includes the influence of both the SNR and the wave amplitude.Methods
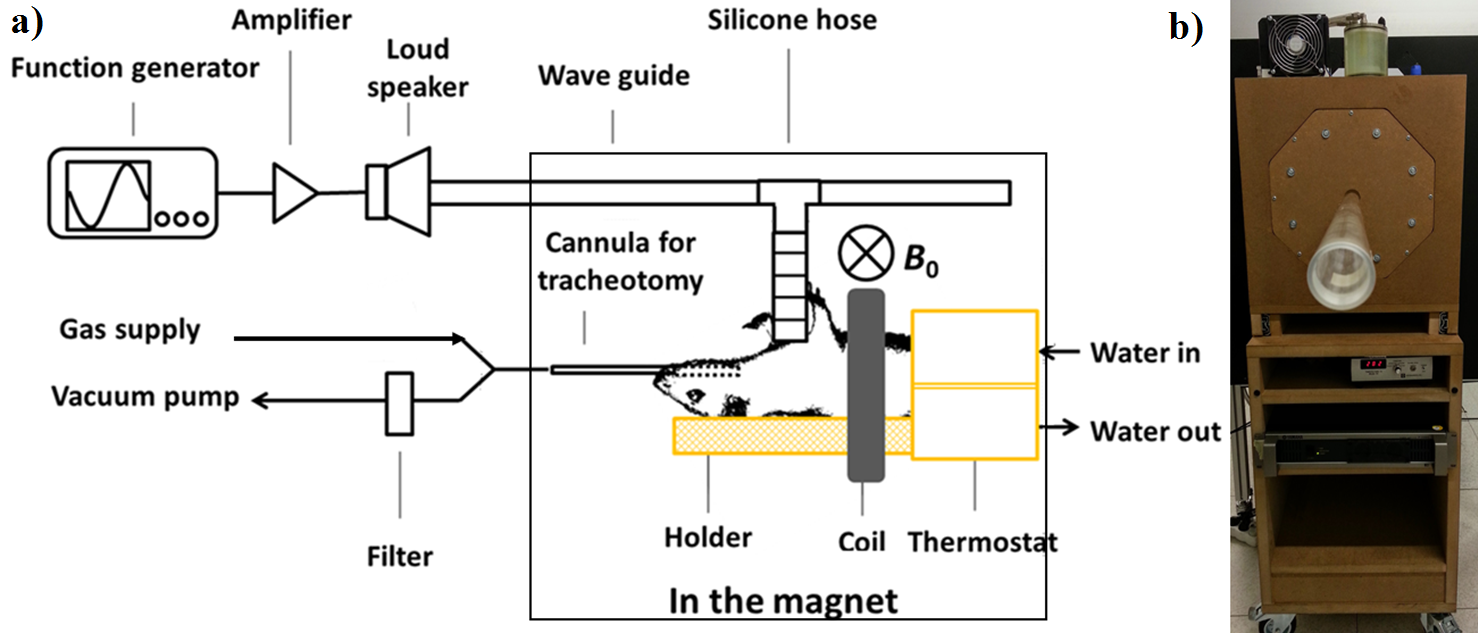
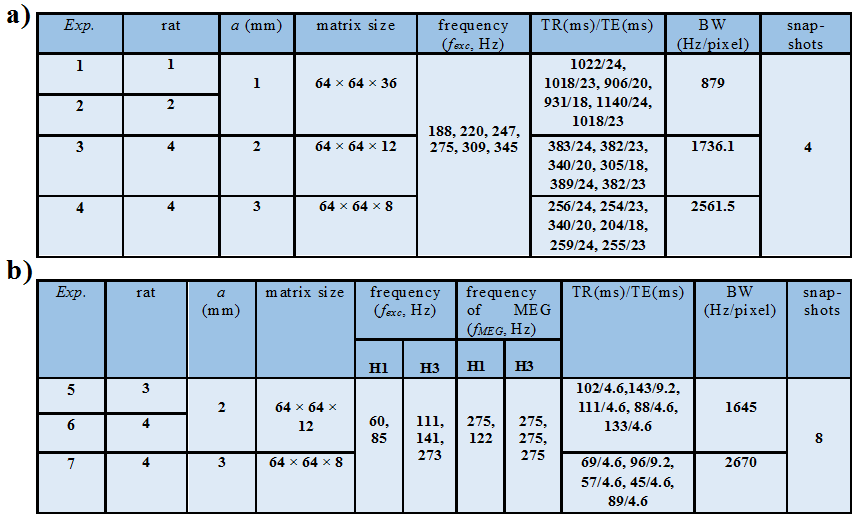
Imaging protocol: MRE experiments were performed on a 1.5 T whole-body imager (Achieva, Philips Healthcare). Four Wistar rats were anaesthetized (isoflurane air/O2) in supine position through a 47 mm microscopy coil (Philips Healthcare, Best, Netherlands), Figure 1. Two sequences sensitized to motion were implemented: a single-frequency spin echo sequence (RFE) and a multi-frequency gradient echo sequence (FFE). For RFE, pressure waves were successively generated at six different frequencies. The reproducibility of the measurements was tested by repeating the acquisitions for three different frequencies. Additional sequences were implemented to measure T1, T2, T2* and tissue density (multi-echo FFE, RFE and UTE) 5,6. For FFE, data were processed by extracting the first (H1) and third (H3) harmonics at two and three frequencies respectively. The acquisition parameters are shown in Figure 2.
Image analysis: The sensitivity inhomogeneity of the microspcopy coil was corrected. Lung parenchyma density was assessed from the sensitivity-corrected UTE data, by considering the surrounding tissue density equal to 1 g/cm3. Lung and liver segmentation was performed by a histogram-based method using GRE and UTE measurements. It provided an estimation of the lung and the liver volume6. An inversion of the 3D motion equation was applied in order to calculate the mechanical parameters7. As λ is a priori unknown in the two organs, the shear velocity v was studied as a function of 1/(fexc·a) which is related to λ/a. Results were expressed as mean ± standard deviation (SD) of v computed first over the whole organ volume then only over voxels with q/Δq > 10 in the liver and with q/Δq > 20 in the lung.
Results
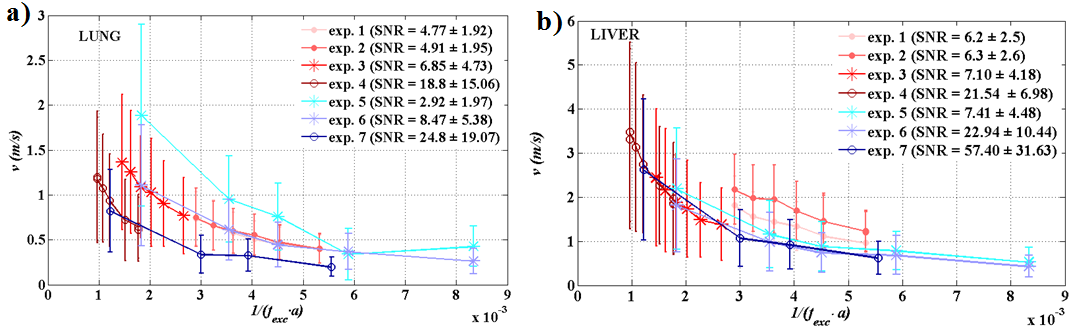
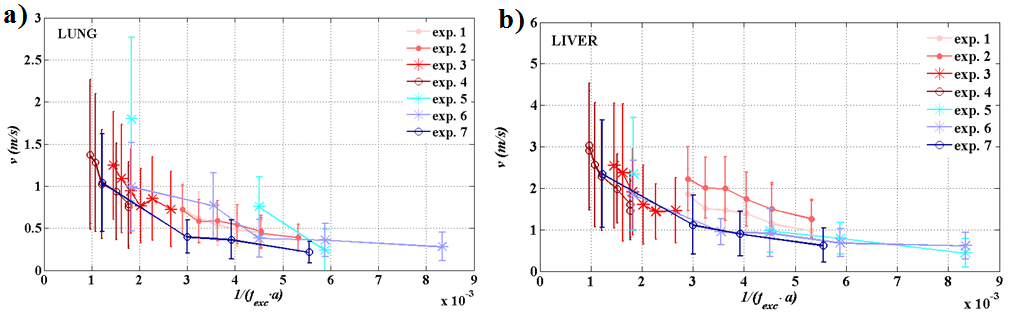
Mean T1, T2 and T2* for all rats were (952±30) ms, (32.5±8.5) ms, (1.77±1.00) ms in the lung parenchyma and (571±89) ms, (43±9) ms, (4.55±1.60) ms in the liver, respectively. These results are in good agreement with the literature for lung 8,6 and liver 9. The mean density was (0.53±0.06) g/cm3 in the lung and (0.99±0.09) g/cm3 in the liver. The relative difference of shear velocity between two repeated acquisitions is less than 5 % for three different frequencies.Shear velocity mean values as a function of 1/(fexc·a) are shown over the whole organs in Figure 3 and over selected-quality voxels in Figure 4.Discussion
For both organs, both sequences, and spatial resolutions, v follows the expected trend with 1/(fexc·a). In Figure 3, the introduced bias can be associated to the quality factor q/Δq difference between the acquisitions. The velocity is overestimated when the SNR falls down to 2-3 (exp.5). In the liver, the results obtained at a = 1 mm are slightly more overestimated than the results at a = {2, 3} mm for values close the same 1/(fexc·a).The overestimation could be resulting from the actual animal overweight. In Figure 4, when the quality factor is above 10 or 20, the curves for the different acquisitions are much less spread and the shear velocities are comparable for similar 1/(fexc·a). In both organs, the lower the frequency is, the lower the dispersion is and the more optimal the acquisition conditions are. The wavelength is actually smaller in the lung than in the liver and, at high frequencies, the shear velocity dispersion is smaller in the lung than in the liver under the same acquisition conditions. This suggests that acquisitions made in the lung are closer to optimal conditions than acquisitions made in the liver.Conclusion
The results confirm the predictions of the simulation and corroborate the need for optimizing the MRE according to λ/a. The accuracy and precision of MRE measurements are optimized for acquisitions performed close to optimal conditions. The quality factor, q/Δq, and the ratio λ/a are effective reference parameters to accurately and precisely estimate the shear velocity and more generally the mechanical properties in vivo.Acknowledgements
MRE was performed on a CEA/SHFJ MRI platform affiliated to the France Life Imaging network (grant ANR-11-INBS-0006).References
1. Muthupillai, R. et al. Magnetic resonance imaging of transverse acoustic strain waves. Magnetic Resonance in Medicine 36, 266–274 (1996).
2. Muthupillai, R., Lomas, D. J., Rossman, P. J. & Greenleaf, J. F. Magnetic resonance elastography by direct visualization of propagating acoustic strain waves. Science 269, 1854 (1995). 3. Julea, F. et al. Reconstruction accuracy dependence with induced-shear-wave magnitude in Magnetic Resonance Elastography. in Journées RITS 2015 pp 104-105 (2015).
4. Yue, J. L. et al. Acquisition and reconstruction conditions in silico for accurate and precise magnetic resonance elastography. Physics in Medicine and Biology (2017).
5. Deoni, S. C., Peters, T. M. & Rutt, B. K. Determination of optimal angles for variable nutation proton magnetic spin‐lattice, T1, and spin‐spin, T2, relaxation times measurement. Magnetic resonance in medicine 51, 194–199 (2004).
6. Wang, H. et al. Aerosol deposition in the lungs of spontaneously breathing rats using Gd‐DOTA‐based contrast agents and ultra‐short echo time MRI at 1.5 Tesla. Magnetic resonance in medicine 75, 594–605 (2016).
7. Sinkus, R. et al. Viscoelastic shear properties of in vivo breast lesions measured by MR elastography. Magnetic resonance imaging 23, 159–165 (2005).
8. Shioya, S. et al. A 1‐year time course study of the relaxation times and histology for irradiated rat lungs. Magnetic resonance in medicine 14, 358–368 (1990).
9. Stanisz, G. J. et al. T1, T2 relaxation and magnetization transfer in tissue at 3T. Magnetic resonance in medicine 54, 507–512 (2005).
Figures