5586
Accelerating MR Elastography acquisition with compressed sensing1Philips, Cincinnati, OH, United States, 2Radiology, Cincinnati Children's Hospital Medical Center, Cincinnati, OH, United States
Synopsis
We propose the use of compressed sensing (CS) for Magnetic Resonance Elastography (MRE). Through validation in a gel phantom and subsequent measurement of liver stiffness in vivo, we demonstrate that CS MRE can be used to accelerate image acquisition, thereby shortening breath holds.
Introduction
MRE allows noninvasive measurement of hepatic stiffness which correlates with histopathologic grading of fibrosis (1-3). Two-dimensional (2D) fast field echo (FFE) based MRE with breath holding is the most common approach. However, breath hold times are approximately 13-16 seconds which can be too long for some children and adults with chronic liver disease. CS is being more widely used to accelerate MR image acquisitions of all types (4). In this work, we utilize undersampling and CS reconstruction to accelerate 2D FFE MRE acquisitions. We validate this accelerated sequence relative to a conventional (i.e., non-CS) 2D FFE MRE technique in a gel phantom and in vivo.Materials and Methods
The conventional 2D FFE MRE sequence was implemented through the modification of a standard phase contrast sequence to include a Motion Encoding Gradient (MEG, 16.7 msec and 18mT/m) along the slice-select direction. The conventional 2D FFE MRE scan parameters were as follows: TR=50 msec; TE=22 msec; flip angle=30°; acquisition matrix=256x64; motion frequency=60 Hz; 3 motion cycles per TR; 4 axial slices, slice thickness=10 mm, slice gap=1 mm; and SENSE acceleration factor=2. Trigger pulses were produced by the pulse sequence to synchronize the active driver to the imaging sequence.
In the CS MRE method, a ‘hybrid’ undersampling pattern was used. Specifically, the center of k-space was measured using a standard Cartesian sampling pattern with acceleration SENSE factor=2, while the sampling density in the outer part of k-space was further decreased by a factor of 1.5 or 2 through the use of a pseudo-random sampling pattern. Using this approach, breath hold times decreased to 8.9 sec and 6.9 sec with CS factors of 1.5 and 2, respectively. The breath hold time per slice was 13.3 sec without CS.
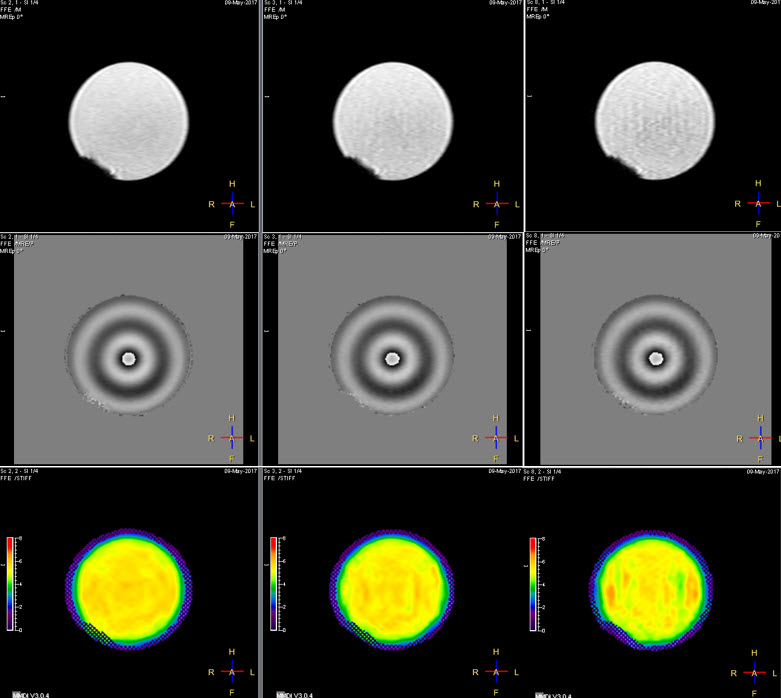
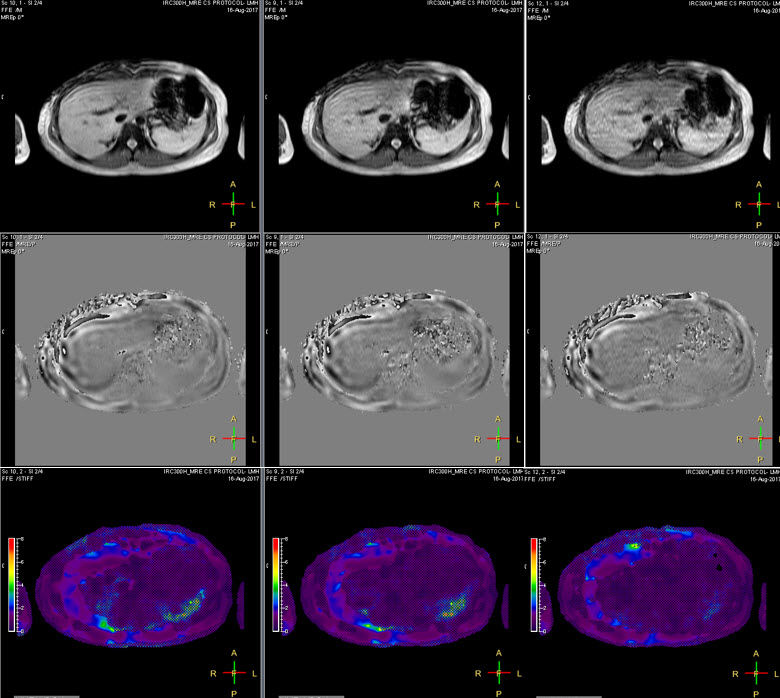
Gel phantom (Resoundant, Inc., MN, USA) studies and in vivo human imaging were performed on a Philips Ingenia 1.5T scanner (Best, The Netherlands). All phantom data was acquired with an active driver amplitude setting of 5%. MRE was performed with the 2D FFE MRE sequence without and with CS with acceleration factors ranging from 1.1 to 2.0 in steps of 0.1. Stiffness measurements were made on all 4 slices, and the overall mean stiffness values were recorded. Fig.1 shows an example of MRE data acquired on a phantom without CS (left column), CS factor = 1.5 (middle column), and CS factor= 2 (right column). For the human studies, 8 volunteer subjects (6 with normal livers and 2 with abnormally stiff livers) were recruited under an approved institutional review board protocol. Liver MRE scans were performed using 28-channel posterior and anterior coil arrays. Four axial slices through the mid liver were obtained in 4 breath holds for each sequence. MR elastograms were generated using a multimodal direct inversion (MMDI) algorithm (Mayo Clinic, Rochester, MN), with overall liver stiffness calculated as an average of mean stiffness measured on each slice (kPa). Fig.2 shows an example of MRE data from an adult volunteer.
Results
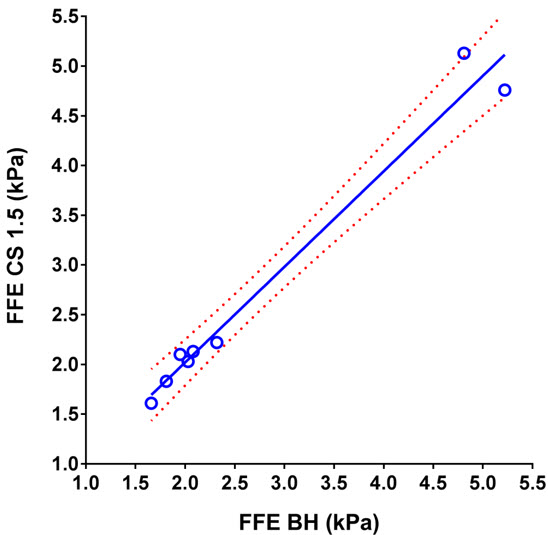
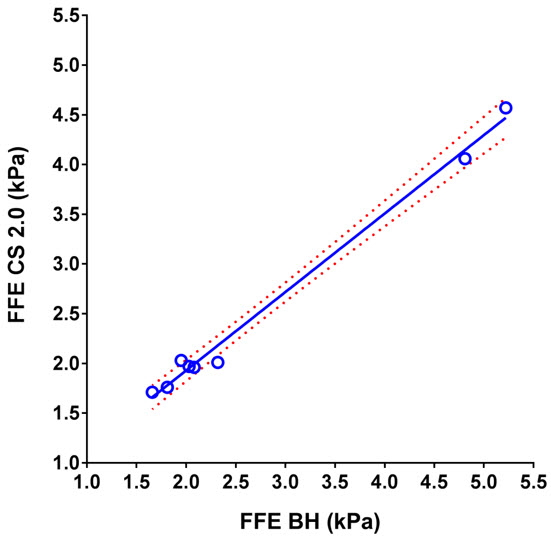
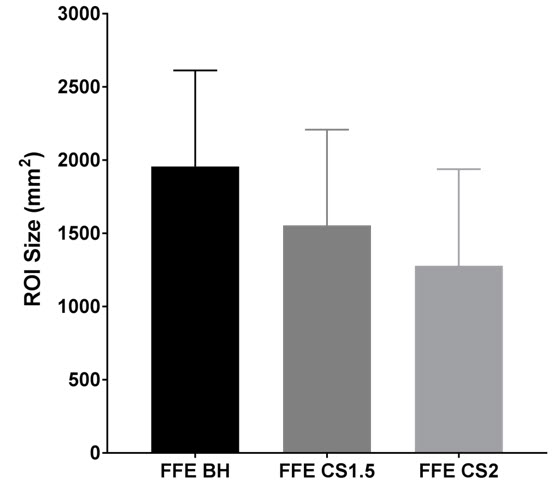
Table 1 shows measured mean stiffness of the phantom without CS (reference standard) and with CS factors ranging from 1.1 to 2. For human subjects, mean liver stiffness was measured to be 2.74 ± 1.43 kPa by conventional FFE MRE, 2.73 ± 1.39 kPa by CS=1.5 (n=8; p=0.92), and 2.51 ± 1.13 kPa by CS=2 (n= 8; p=0.08). Scatter plots show the degree of agreement between in vivo stiffness values measured by conventional FFE MRE and FFE MRE CS=1.5 (r=0.988), and between conventional FFE MRE and FFE MRE CS=2 (r=0.996) (Figs. 3 and 4). Measurable regions of interest (ROI) decreased in size as the CS factor increased (1957 ± 657 mm2 for standard FFE MRE, 1555 ± 654 mm2 for CS=1.5, and 1279 ± 660 mm2 for CS=2; p=0.0001) (Fig. 5). This could be due to decreasing SNR with increasing CS acceleration factor.
Table 1: Stiffness measurements on MRE phantom with different compressed sensing (CS) factors.
CS factor No 1.1 1.2 1.3 1.4 1.5 1.6 1.7 1.8 1.9 2.0
Stiffness (kPa) 5.63 5.55 5.54 5.54 5.50 5.51 5.52 5.50 5.45 5.40 5.35
Conclusion
We have successfully demonstrated a 2D FFE MR elastography technique with CS that shortens scan time and thus breath hold duration. In phantom studies and 8 human volunteers, we have demonstrated no significant difference in measured stiffness between 2D FFE MRE with or without CS. CS MRE may be particularly clinically useful in children and adults with limited breath hold capacity.Acknowledgements
No acknowledgement found.References
[1] Yin et.al, Radiology 2016, 278(1):114-24. [2] Xanthakos et. al, J Pediatr 2014, 164(1):186-8. [3] Serai et. al, Abdom Imaging 2015, 40(4): 789-94. [4] Lustig et. al. MRM 2007, 58(6), 1182-1195Figures