5585
In Vivo Cardiac MR Elastography using a Gravitational Transducer1Division of Imaging Sciences and Biomedical Engineering, King’s College London, London, United Kingdom, 2Philips Healthcare, Guildford, Surrey, United Kingdom, 3ITL Group, Ashford, Kent, United Kingdom
Synopsis
MR Elastography is valuable in evaluating biomechanical stiffness of tissues, which can exhibit marked changes in case of disease. However, the number of cardiac MRE studies remains limited due to challenges in measuring the dynamic muscle tissue using existing MRE sequences and hardware. Here, we aimed to acquire reliable cardiac MRE data by combining a gravitational transducer driven by a novel synchronising strategy with a single-shot SE-EPI-MRE sequence with flow and acceleration compensated motion encoding gradients to image the myocardium in different cardiac phases. Our method reveals higher myocardial stiffness, agreeing with results from biomechanical models/simulations, conflicting with current literature.
INTRODUCTION
MR Elastography (MRE) can assess biomechanical properties of soft tissues like myocardial stiffness which is known to correlate with cardiac tissue health. However, only few studies have been published for cardiac MRE applications mainly due to challenges in measuring dynamic muscle tissue using existing MRE sequences and lack of reliable hardware. Here, we aimed to improve data quality for cardiac MRE by combining a multi-slice (MS), multi-phase single-shot SE-EPI-MRE sequence with flow and acceleration compensated motion encoding gradients and using a gravitational transducer driven by a new synchronising strategy. In-vivo results were compared to personalized biomechanics models and simulated wave phantom results.
METHODS
Hardware: The MRE gravitational transducer concept1 was used to produce shear waves. Unlike previous strategies, the transducer runs continuously to produce periodic steady-state waves at the desired MRE frequency. Synchronization with the scanner is achieved by detecting the ECG trigger from the subject wirelessly via an MR-compatible Patient Monitor (MR400, Philips Medical Systems), routed into a custom-built controller box implemented with Arduino UNO and delaying transmission to the scanner until the correct transducer position is reached. Subsequently, an artificially generated ECG signal from the Arduino is sent to the scanner for the cardiac triggering of the MRE sequence.
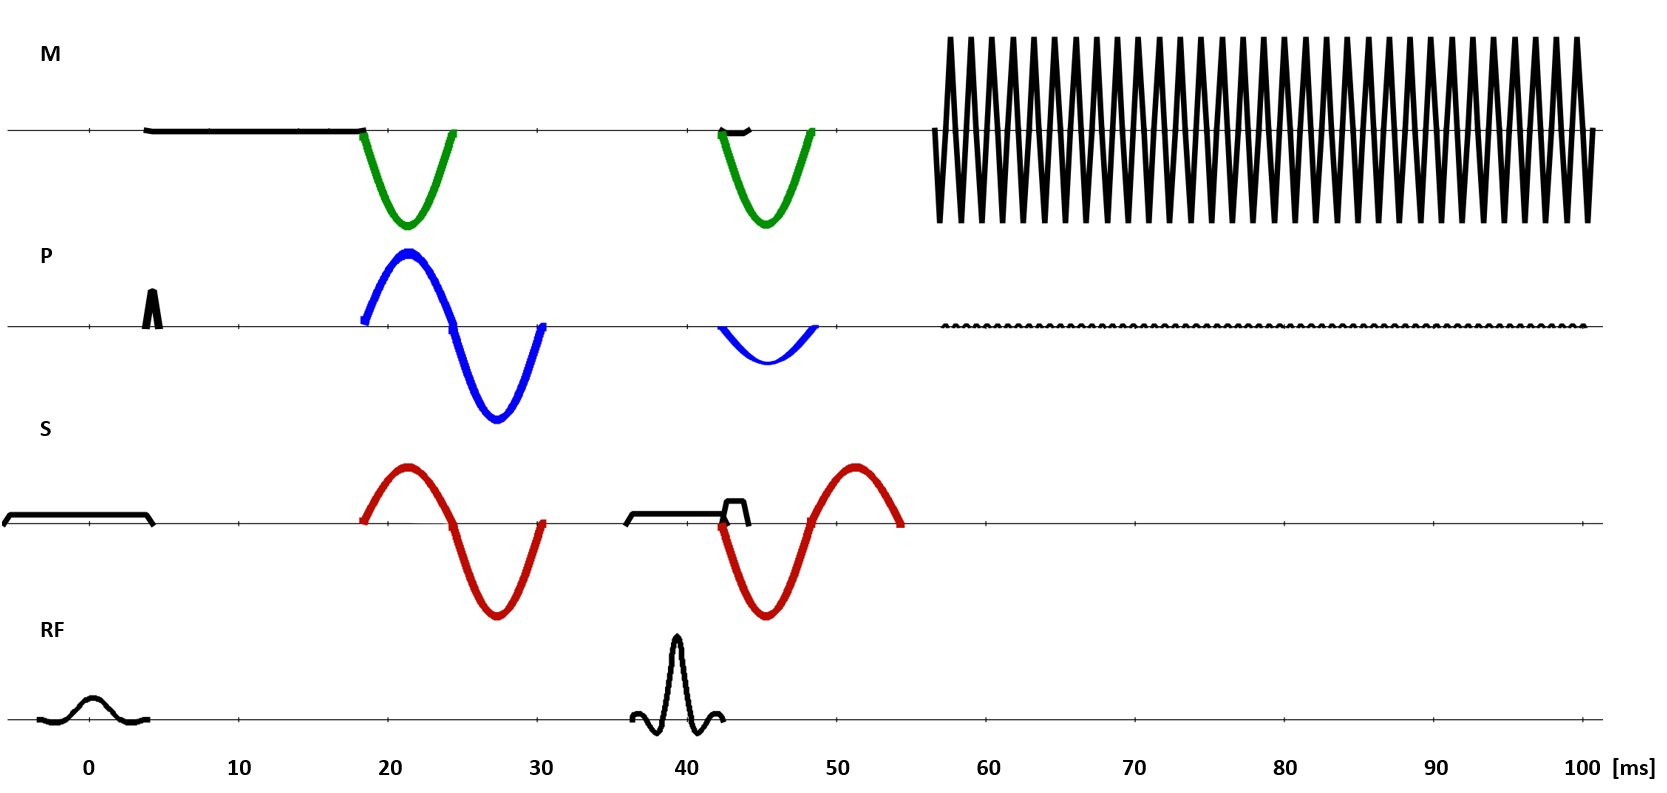
MR Sequence: A cardiac-triggered single-shot SE-EPI sequence, similar to the study2 but with second-order motion compensated MRE motion encoding gradients (MEGs), was implemented as shown in Fig.1 and used in a cycled MS mode. Two other sets of MEGs were incorporated into the sequence to compare the cases of no motion compensation and flow compensation with the current scheme. Delays of individual slices within one cardiac cycle were synchronised with the vibration frequency to coincide the acquisition with the same wave phase. A gradually increasing delay allowed for different mechanical wave phases.
MR Measurements: Measurements were performed on a 3T Achieva MR scanner (Philips Healthcare, The Netherlands) in breath-hold with imaging parameters: TR=2RR; TE = 69ms for a 2.5x2.5x4mm3 voxel and TE = 75ms for a 2x2x4mm3 voxel; SENSE factor = 2; ETL = 63. 5 slices and 5 cardiac phases were acquired from two healthy subjects using flow and acceleration compensated gradient scheme at 83Hz MRE frequency. All MEG schemes were compared in another volunteer without the transducer to observe image quality. MEGs were applied in slice selection, phase encoding, and readout directions plus one reference scan without MEGs.
Simulations: Mechanical wave simulations at 80Hz were performed on a cylindrical domain assuming a linear viscoelastic material with the aim of replicating the MRE experiment within a controlled environment. Six stiffness values between 2 and 50kPa were considered, while the viscosity was 1/3 of each stiffness value. A comparison was also made with a personalised biomechanical model, using a nonlinear anisotropic material model. The model was vibrated at 80Hz at both end systolic and end diastolic states.
RESULTS AND DISCUSSION
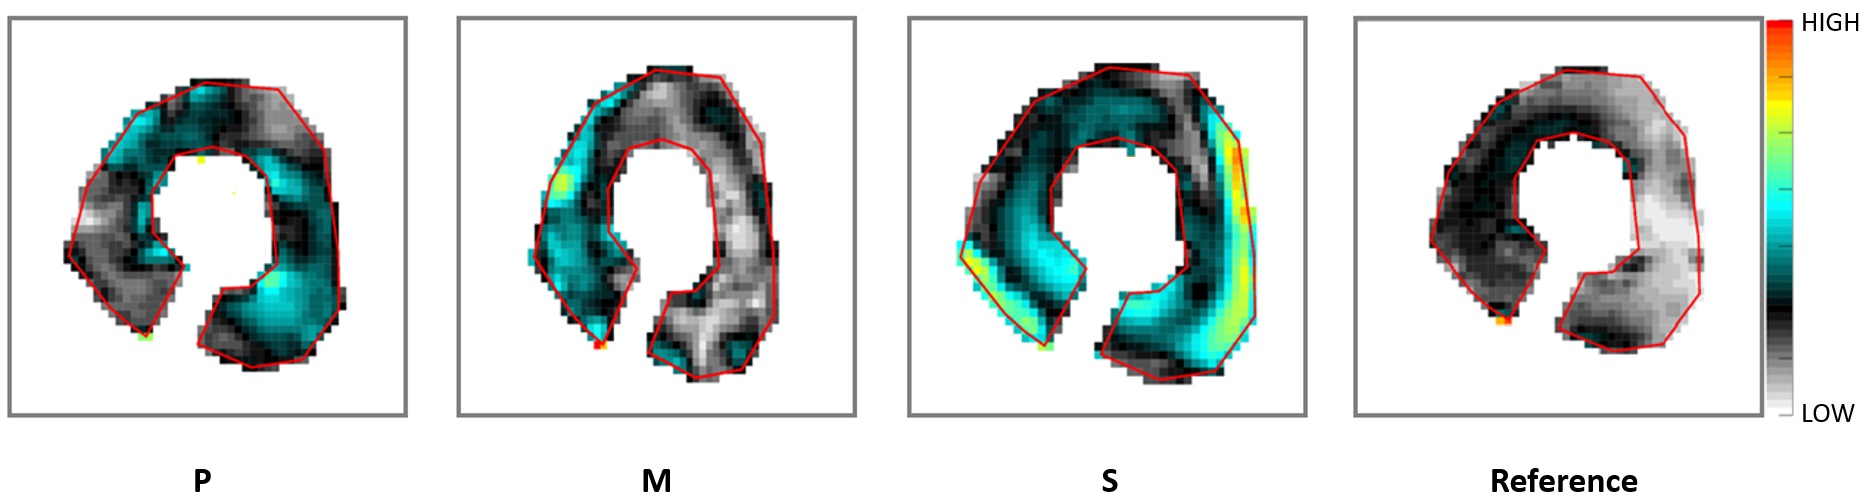
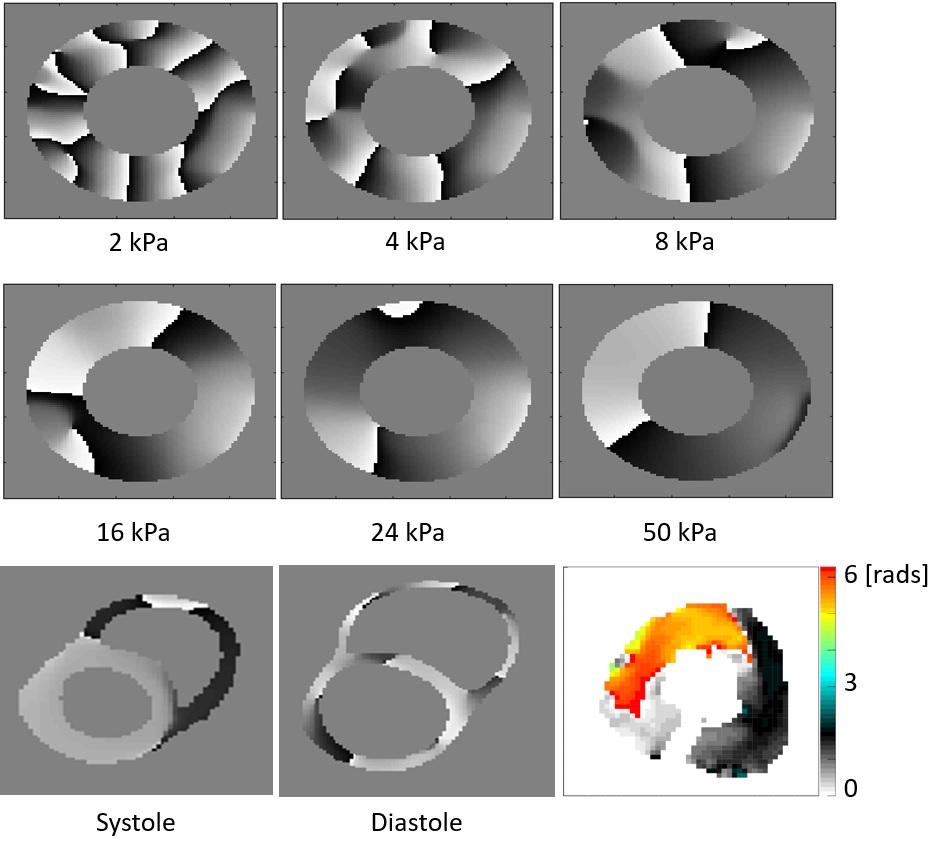
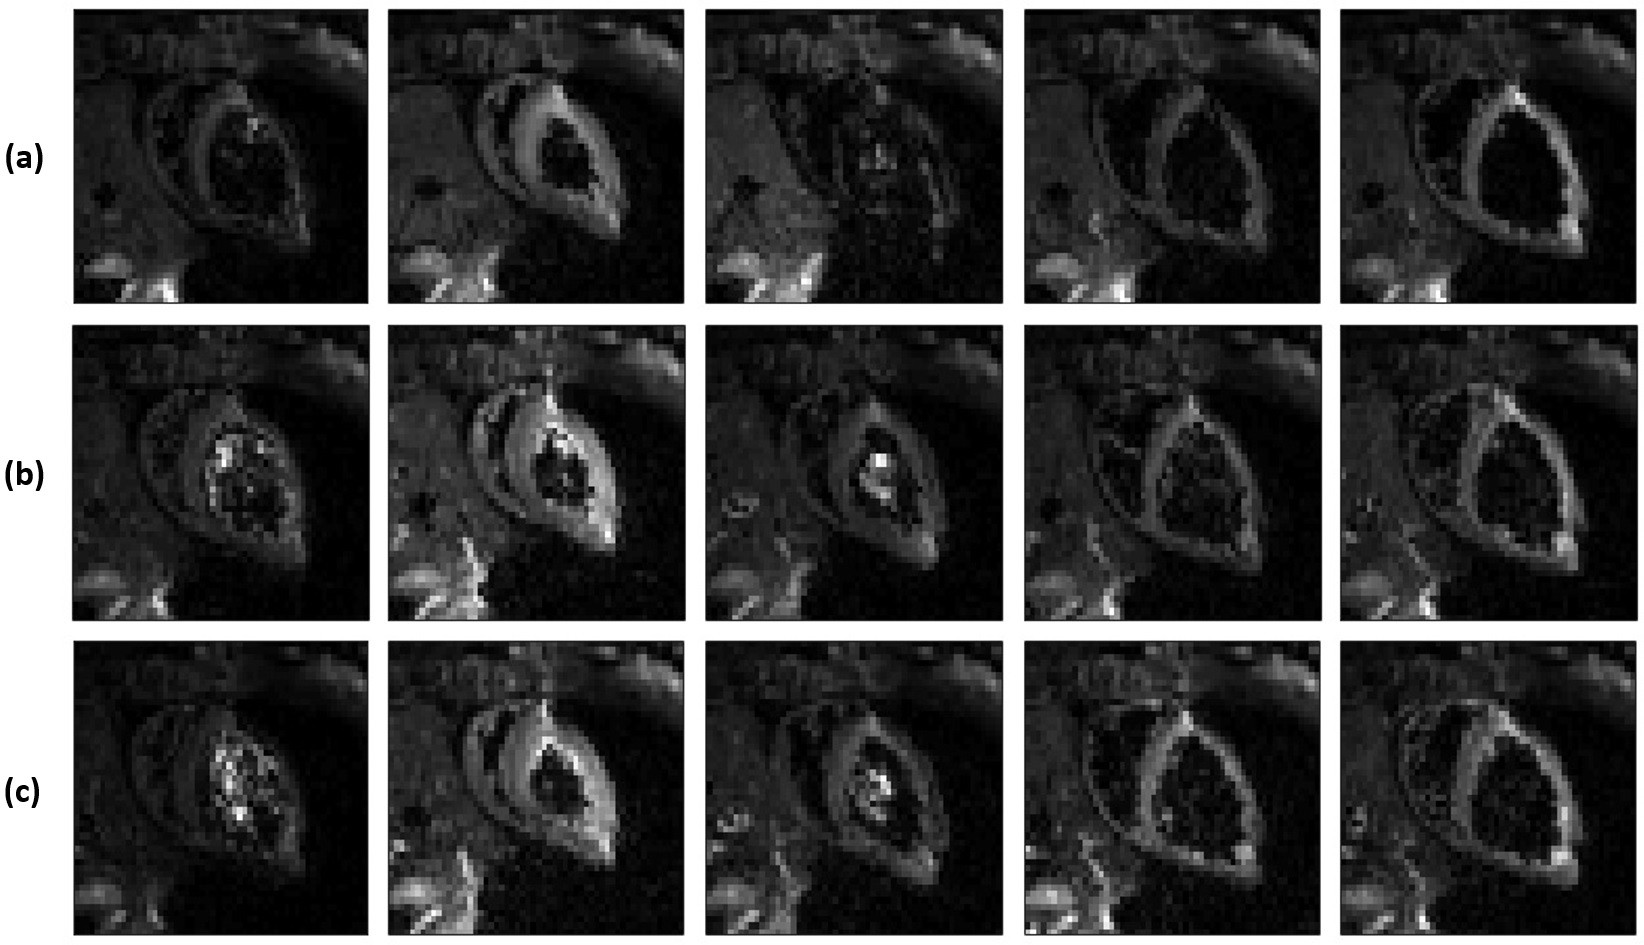
Fig.2 demonstrates wave amplitudes for different encoding directions and the reference. The reference image clearly lacks any waves even though residual encoding is possible due to the imaging gradients. The through plane direction (S) showed the largest wave amplitudes. The spatial phase distribution of the mechanical wave in the S direction for one slice in the second cardiac phase is shown in Fig.3 along with simulations at 80Hz for phase images using different stiffness values. In contrast to previous cardiac stiffness values obtained via MRE2, which are on the order of 8kPa in systole, the observed behaviour resembles most the 24-50kPa case. Comparison with a personalised biomechanical model also shows a significantly increased stiffness relative to previous literature results. These results compare favourably with a transient stiffness measure achieved through imaging transient waves caused by valve closure3. Fig.4 shows different cardiac phases for a single slice using different MEG schemes. In case of no motion compensation, poor image quality was observed for cardiac phases with significant intraventricular blood flow. The other schemes produced similar image quality. The total phase accrual normalized by TE and the number of encoding periods was 1.38x, 1x, and 1.12x for no compensation, flow compensation, flow and acceleration compensation schemes, respectively, making the flow compensated scheme the least efficient.CONCLUSION
It was demonstrated that by using a SE-EPI based sequence with both flow and acceleration compensated MEGs in a cycled MS mode in combination with robust hardware employing a new synchronising strategy, it was possible to capture more of the cardiac cycle effectively. In vivo data showed remarkably higher myocardial stiffness values, inconsistent with current literature2. However, these results were consistent with personalized biomechanics models and simulated wave phantom results.Acknowledgements
Authors would like to acknowledge funding from the EPSRC (EP/N011554/1 and EP/R003866/1).References
- Runge J, Hoelzl S, Sudakova J, Dokumaci AS, Nelissen JL, Lee J, Stoker J, Nederveen AJ, Nordsletten D, Sinkus R. A Novel MR Elastography Transducer Concept Based on a Rotational Eccentric Mass: The Gravitational Transducer. In: Intl. Soc. Mag. Reson. Med. 25. Vol 1369. Honolulu; 2017.
- Arani A, Arunachalam SP, Chang ICY, Baffour F, Rossmann PJ, Glaser KJ, Trzasko JD, McGee KP, Manduca A, Grogan M, Dispenzieri A, Ehman RL, Araoz PA. Cardiac MR Elastography for Quantitative Assessment of Elevated Myocardial Stiffness in Cardiac Amyloidosis. J Magn Reson Imaging. 2017;46(5):1361-1367.
- Webb J, Runge J, Martorell J, Carr-White G, Razavi R, Nordsletten D, Sinkus R. Using transient intrinsic torsional shear wave propagation to measure Left Ventricular Myocardial stiffness with a 2D pencil beam navigator at 0.5ms temporal resolution: Initial results from phantom studies and volunteers. In: Intl. Soc. Mag. Reson. Med. 25. Vol 1369. Honolulu; 2017.
Figures